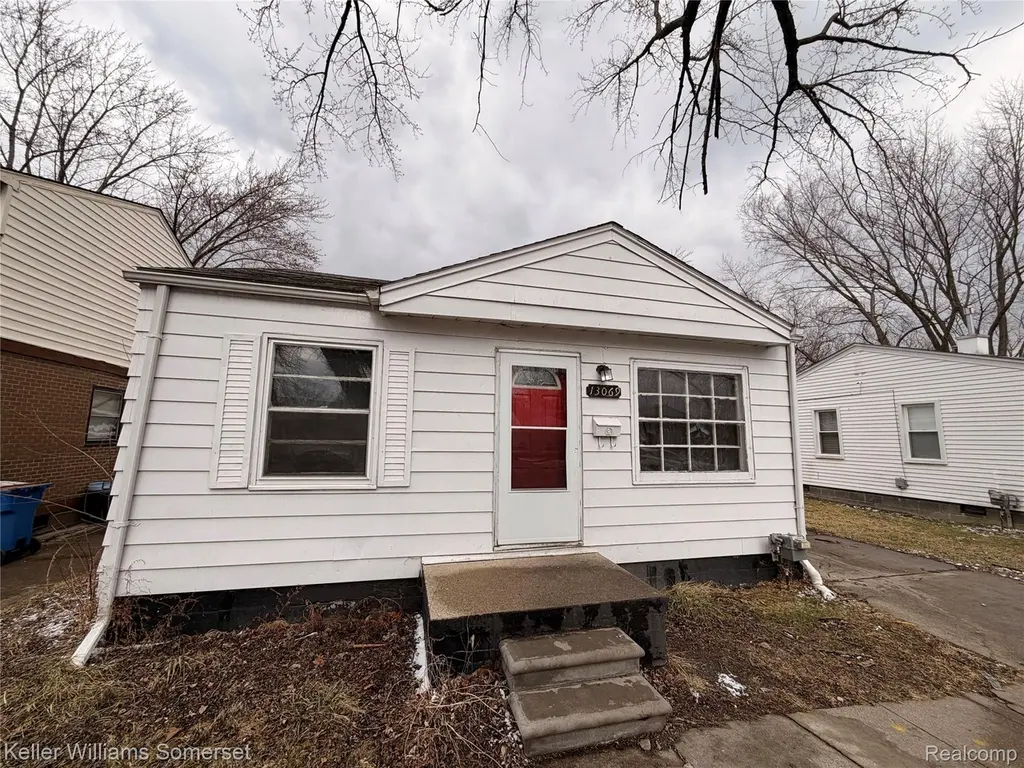
13069 Sarsfield Ave · Warren, MI
Flood risk 1/10 · Minimal
- FEMA flood zone
- X (unshaded)
- Chance of flooding over 30 yrs
- 0.0%
- Est. flood insurance / yr
- $507 – $1,088
Fire risk 1/10 · Minimal
- Est. fire insurance / yr
- $784 – $1,456
Heat risk 3/10 · Minor
- Hot days now (above 96°F)
- 7 days/yr
- Hot days in 30 yrs
- 15 days/yr
Wind risk 1/10 · Minimal
- Chance of severe wind over 30 yrs
- —
Air-quality risk 3/10 · Minor
- Unhealthy air days now
- 3 days/yr
- Unhealthy air days in 30 yrs
- 4 days/yr
Risk factors via First Street. Map © Google.
Why this score? — see what drove the B- grade
The composite is a weighted blend of 9 inputs, each scored 0–100. Each bar is that input's sub-score; the figure is the points it added to the 100-point composite (weight × sub-score).
- Cash flow +30.0/30.0
- 1% rule +10.0/10.0
- DSCR +10.0/10.0
- ARV discount +6.0/15.0
- Livability +3.7/5.0
- Rent growth +3.2/5.0
- Condition / age +2.5/5.0
- Schools +1.0/10.0
- Appreciation +0.0/10.0
$77,000
🖨 Deal sheet 📄 Offer letter ✓ Due diligence
Listing remarks MLS
Section 8 rental investment property with $1,145 monthly income. The HAP portion is $959 and the tenant portion is $186. Long term tenant already in place. Reach out to the listing agent for any questions or inquiries. No showings without an accepted offer first. Great opportunity for immediate cash flow!
Key facts
- 5,227 sq ft lot
- 2 garage spots
- Built 1953
Property features AI
Finance
- Other: Located in Fairfield Gardens subdivision; Directions: South on Schoenherr, right on 8 Mile, right on Fairfield to right on Sarsfield; Cross street near 8 Mile & Schoenherr
Exterior
- Parking: Detached garage with about 2.5 car spaces
- Utilities: Public water; Public sewer
- Home design: Single-family residence; One story; Ground-level entry with steps; Aluminum siding
- Construction: Aluminum siding construction
- Exterior features: Paved road access; Lot approximately 0.12 acres (39 x 131)
Interior
- Bathrooms: 1 full bathroom
- Heating & cooling: Forced air heating (natural gas); No cooling
- Interior features: Crawl space basement; Five total rooms
Neighborhood map
What this means for you Summary
Snapshot
- This is a 2-bed/1.0-bath single-family listed at $77k.
Deal economics
- At list price, monthly cash flow is $306 ($4k/yr) — positive.
- The deal already cash-flows at list — no discount required.
- Meets the 1% rule at list price ($1k rent vs $77k).
- Recommended offer: $75k (3.0% below list) — sets the bar for market timing.
- Cap rate 11.1% vs local median 5.3% in Warren — top-decile yield for the area; either an underpriced asset or a hidden risk that comps aren't pricing in. Stress-test before assuming the spread holds.
Location & tenants
- Location reads 74/100 on livability (#171 in MI, #4,491 nationally) — a middle-class / working-renter tenant base. Strengths: commute A+, cost of living A+, housing A+; Watch: schools D, amenities D, employment D.
- Van Dyke Public Schools (urban): math 7% / reading 19% proficiency, ranked #512 of 540 in MI (top 95%) — low school quality limits family demand, transient renter base, plan for 1-2y turnover; 80% free/reduced lunch — lower-income household profile, screen leases tightly.
- Market conditions: Rents rising (+2.9%/yr); 160 active listings in the ZIP; 6 comparable units currently listed for rent nearby; rentals lingering (median 44d on market — plan ~5-8 weeks vacancy on turnover, expect pricing pressure); 67% of comp listings sitting > 30 days — soft ceiling on asking rent; 1,321 units permitted in Macomb County in 2024 (86 in 5+ unit buildings).
Forward outlook
- Local home prices are declining (-3.0%/yr); year-one equity from $532 of loan paydown is wiped out by about $2k of value loss. Plan a longer hold.
- Macomb County population projected at +9% by 2050 — modest demand growth; plan on rents tracking national, not racing it.
- At projected returns (-3.0% appreciation + 2.9% rent growth), your $22k cash investment doubles in ~8 years — after that, you're playing with house money.
Negotiation context
- It's been on market 31 days — a 3% lower offer ($75k) is reasonable based on typical stale-listing flexibility.
- 11 sale attempts since 21y ago; this cycle's ask has dropped $8k (9%) from the opening price — seller is motivated, your offer sets the floor, not the list.
Risks & watch-outs
- Watch-outs: property tax is 3.5% of price; built in 1953 — expect roof / HVAC / electrical / plumbing capex.
Questions for the listing agent
- It's been on market 31 days. Have you received any prior offers? Is the seller open to a 3% concession, seller financing, or rate buy-down credit?
- Built in 1953 — when were the roof, HVAC, electrical panel, plumbing, and water heater last replaced?
- Property tax is high relative to price — has the assessment been appealed recently, and will the sale trigger a re-assessment?
- Is there a deadline driving the sale (1031 exchange, divorce, estate, relocation)? That informs how much negotiation room exists.
- Schools are D-rated, which usually means shorter tenancies and higher turnover. Who's the typical renter profile here, and what's been the actual vacancy rate?
- Crime grade is D in this area — have there been break-ins, vandalism, or insurance claims at this property in the last 3 years? What carrier currently insures it and at what premium?
- What's the average days-on-market for RENTAL listings here right now (not sales)? A rising rental-DOM trend means longer vacancies and softer asking-rent achievability than the comps imply.
- What's the recent tenant-quality profile in this submarket — average credit score on applications, eviction rate, late-payment / NSF rate, and stable-employment percentage? A property-management company in the area should have these aggregated.
- How much new for-sale + rental construction is in the pipeline within 1–3 miles? Heavy new supply typically softens prices + rents 12–24 months out; constrained supply supports both.
Investment metrics
- 1% rule
- 1.59% ✓
- Cap rate
- 11.06%
- Cash-on-cash
- 17.01%
- DSCR
- 1.76
- GRM
- 5.3
CMA / ARV
- ARV (on-the-fly)
- $74,472
- Comps found
- 12
Show comp detail 12 sales within ~0.75 mi
| Address | Dist | Beds/Ba | Sqft | Sold | Price | $/sf | Match |
|---|---|---|---|---|---|---|---|
| 12832 Sherman Ave | 0.13mi | 2/1.0 | 696 (0%) | 2mo | $100,000 | $144 | 92 |
| 13075 Sherman Ave | 0.06mi | 2/1.0 | 700 (+1%) | 6mo | $83,000 | $119 | 92 |
| 13415 Sherman Ave | 0.18mi | 2/1.0 | 710 (+2%) | 7mo | $113,300 | $160 | 82 |
| 13475 Coleen Ave | 0.26mi | 2/1.0 | 672 (-3%) | 6mo | $65,000 | $97 | 77 |
| 22447 Sharrow Ave | 0.55mi | 2/1.0 | 696 (0%) | 0mo | $102,000 | $147 | 74 |
| 22446 Sharrow Ave | 0.55mi | 2/1.0 | 700 (+1%) | 6mo | $75,000 | $107 | 68 |
| 12426 Sidonie Ave | 0.36mi | 2/1.0 | 750 (+8%) | 4mo | $131,000 | $175 | 67 |
| 12856 Couwlier Ave | 0.21mi | 2/1.0 | 768 (+10%) | 7mo | $57,000 | $74 | 67 |
| 20520 Dresden St | 0.58mi | 2/1.5 | 680 (-2%) | 0mo | $33,000 | $49 | 67 |
| 12484 Sherman Ave | 0.28mi | 2/1.0 | 800 (+15%) | 3mo | $72,000 | $90 | 60 |
| 22705 Sharrow Ave | 0.64mi | 2/1.0 | 750 (+8%) | 7mo | $80,000 | $107 | 52 |
| 20210 Hickory St | 0.49mi | 3/1.0 (+1) | 779 (+12%) | 6mo | $21,500 | $28 | 47 |
Match score weights: distance 35% · size 25% · config 20% · recency 20%. Top-matched comps best support the ARV.
Projected returns pro-forma
-3.0% appreciation · 2.94% rent growth · sell at horizon
- IRR
- 8.3%
- Equity multiple
- 1.33×
- Total profit
- $7,015
- Equity at exit
- $11,481
- IRR
- 17.5%
- Equity multiple
- 2.45×
- Total profit
- $31,269
- Equity at exit
- $6,658
Cash invested: $21,560 (down + closing). Projections, not guarantees.
Landlord ↔ Tenant lean methodology
- Overall (STATE)
- 62 Landlord-Friendly
- State Michigan
- 62 Landlord-Friendly · EVEN
- County
- — inherits STATE
- City
- — inherits STATE
ZIP-level market 48089
- Rents YoY
- 2.9%
- Active inventory
- 160
- Price-to-rent
- 5.3×
Monthly cashflow live
- Estimated rent
- $1,221 high interval (Pro) →
- Mortgage (P&I)
- −$404
- Tax from tax record
- −$223 /mo · $2,680/yr
- Insurance
- −$32
- HOA
- −$0
- Vacancy / Maint / Mgmt
- −$256
- Net cashflow
- $306
Break-even live
UW: 25.0% down · 7.5% · 30yr · 1.5% tax · 5.0% vac · 8.0% maint · 8.0% mgmt
Financing live
Cash to close
- Down payment
- $19,250
- Closing costs
- $2,310
- Reserves months
- —
- Total cash needed
- —
Loan-product check · same deal, 3 products live
Conventional
25% down · 7.5% · 30yr
- Down + closing
- —
- Monthly P&I
- —
- Monthly cashflow
- —
- DSCR
- —
- Eligible?
- —
Personal DTI + credit; lowest rate.
DSCR
20% down · 8.5% · 30yr
- Down + closing
- —
- Monthly P&I
- —
- Monthly cashflow
- —
- DSCR
- —
- Eligible?
- —
No personal income docs; deal must DSCR.
Hard money
10% down · 12.0% · 12mo
- Down + closing
- —
- Monthly P&I
- —
- Monthly cashflow
- —
- DSCR
- —
- Eligible?
- —
Short-term bridge; refi at stabilization.
Rent comps 6 comps
| Address | Beds | Baths | Sqft | Rent | $/sqft | DOM | Units | Dist |
|---|---|---|---|---|---|---|---|---|
| 21412 Waltham Rd Warren, MI | 2.0 | 1.0 | 696 | $1,225 | $1.76 | 44d | 1 | 0.24mi |
| 20242 Hickory St Detroit, MI | 3.0 | 1.0 | 747 | $1,300 | $1.74 | 11d | 1 | 0.48mi |
| 11236 Studebaker Ave Warren, MI | 2.0 | 1.0 | 672 | $1,175 | $1.75 | 44d | 1 | 1.12mi |
| 19335 Hoover St Detroit, MI | 2.0 | 1.0 | 620 | $1,099 | $1.77 | 17d | 1 | 1.33mi |
| 19335 Hoover St Detroit, MI | 2.0 | 1.0 | 620 | $1,099 | $1.77 | 44d | 1 | 1.33mi |
| 15030 Rossini Dr Unit 2 Detroit, MI | 1.0 | 1.0 | 720 | $800 | $1.11 | 44d | 1 | 1.42mi |
Listing history 40 events
-
2026-06-18days on market $77,000 Active 31 DOM
-
2026-06-17days on market $77,000 Active 30 DOM
-
2026-06-16days on market $77,000 Active 29 DOM
-
2026-06-15days on market $77,000 Active 28 DOM
-
2026-06-13days on market $77,000 Active 26 DOM
-
2026-06-13days on market $77,000 Active 25 DOM
-
2026-06-09days on market $77,000 Active 22 DOM
-
2026-06-08days on market $77,000 Active 21 DOM
-
2026-06-07pricedays on market $77,000 Active 20 DOM
-
2026-06-04days on market $85,000 Active 17 DOM
-
2026-06-03days on market $85,000 Active 16 DOM
-
2026-06-02days on market $85,000 Active 15 DOM
-
2026-06-01days on market $85,000 Active 14 DOM
-
2026-05-31days on market $85,000 Active 13 DOM
-
2026-05-18$85,000 Active
Show marketing remark (306 chars)
Section 8 rental investment property with $1,145 monthly income. The HAP portion is $959 and the tenant portion is $186. Long term tenant already in place. Reach out to the listing agent for any questions or inquiries. No showings without an accepted offer first. Great opportunity for immediate cash flow!
-
2026-05-18$85,000 Active 306-char remark
Show marketing remark (306 chars)
Section 8 rental investment property with $1,145 monthly income. The HAP portion is $959 and the tenant portion is $186. Long term tenant already in place. Reach out to the listing agent for any questions or inquiries. No showings without an accepted offer first. Great opportunity for immediate cash flow!
-
2026-04-10historical
-
2026-04-10historical
-
2026-03-06$105,000 Active
-
2026-03-06$105,000 Active
-
2023-10-17soldstatus $89,000
-
2023-10-06soldstatus $89,000 Sold
-
2023-10-06soldstatus $89,000 Closed
-
2023-09-01status Pending
-
2023-09-01status Pending
-
2023-08-22$94,000 Active
-
2023-08-22$94,000 Active
-
2023-08-07historical
-
2023-08-07historical
-
2023-06-15$99,000 Active
-
2023-06-15$99,000 Active
-
2022-10-18price $99,000
-
2022-10-18historical
-
2022-10-18price $99,000
-
2022-10-18historical
-
2022-10-07$70,000 Active
-
2022-10-07$70,000 Active
-
2005-09-02historical
-
2005-07-30$74,500
-
1992-03-23soldstatus $36,900
ⓘ Source: listings_history table (triggers on properties + properties_extension) + one-shot
backfill from property_details.listing_events for pre-trigger history.
Tax reassessment forecast MI · Partial reset (capped growth)
- Current annual tax
- $2,680 · $223/mo
- Projected year-2 tax
- $2,680 · $223/mo
- Expected delta
- $0/yr ($0/mo · 0.0%)
ⓘ Screening estimate from a state-policy table — verify with the county assessor before closing.
Climate risk First Street
- Flood 1/10 Low FEMA zone X (unshaded) · 0% chance over 30 yrs
- Wildfire 1/10 Low
- Heat 3/10 Moderate 7 d/yr ≥96°F today · 15 d/yr by 30 yrs out
- Wind 1/10 Low
- Air quality 3/10 Moderate 3 unhealthy d/yr today · 4 by 30 yrs out
Nearby sold comps map
Loading sold comps map…
Walkable amenities ~0.75 mi
Loading nearby amenities…
Taxation est. · year 1
- Rental income
- $14,657
- − Mortgage interest
- −$4,313
- − Property taxes
- −$2,680
- − Insurance
- −$385
- − Repairs & maintenance
- −$1,173
- − Management
- −$1,173
- − Depreciation
- −$2,240
- Taxable income
- $2,694
- Est. tax owed @ 24.0%
- −$646
- After-tax cash flow
- $3,022/yr
For passive investors: Depreciation is non-cash, so a rental often shows a tax loss while cash-flowing — sheltering income. Rental losses are passive: they offset passive income freely, and up to $25,000/yr can offset ordinary (W-2) income if you actively participate and your MAGI is under $100k (phasing out to $0 by $150k); unused losses carry forward. On sale, claimed depreciation is recaptured at up to 25%, and gains may owe capital-gains tax (a 1031 exchange can defer both). Figures are a year-1 estimate at your 24.0% rate — not tax advice; consult a CPA.
Schools (NCES district)
- District
- Van Dyke Public Schools
- NCES district ID
- 2634680
- Math proficiency
- 7% ▼ -11.00%
- Reading proficiency
- 19% ▼ -5.00%
- Median HH income
- $33,231
- Composite
- 10.46/100
- National rank
- #9784
- State rank
- #512 of 540 in MI
Livability — Warren
- Score
- 74/100
- State rank
- #171
- US rank
- #4491
Category grades
Schools grade is shown separately in the Schools card above.
Census & demographics
- Census place
- Warren, MI
- County
- Macomb County · 638,552 people
- City population
- 114,937
- Metro
- Detroit-Warren-Dearborn, MI
- Population (ZIP)
- 31,853
- Household income
- $52,366
- Rent vs Own
- Severe rent burden
- 1754.0
Population outlook (Macomb County) Hauer SSP2
- Today (2025)
- 925,296 people
- By 2030
- 948,226 · +2.5%
- By 2040
- 983,961 · +6.3%
- By 2050
- 1,010,200 · +9.2%
- By 2075
- 1,076,222 · +16.3%
- By 2100
- 1,077,065 · +16.4%
Race, ethnicity, and origin ACS 2023
- Neighborhood character
- Diverse neighborhood (Simpson 0.61)
- Race & ethnicity
- White 53% Black 31% Asian 7% Two or more races 6% Hispanic / Latino 3%
- Common ancestry
- Romanian 11% Lithuanian 3% Slovak 2%
- Foreign-born
- 5% · Canada
- Languages at home
- 92% English-only · Other Asian/Pacific 3% Other Indo-European 2% Arabic 1%
Political lean MEDSL · Macomb
- 2024 margin
- R (+13.7) · D 42.2% · R 55.9% · Other 1.9%
- 2008→2024 swing
- -22.3pp toward R · 2008: 8.6pp · 2024: -13.7pp
- All cycles
- 2024: R+13.7 2020: R+8.1 2016: R+11.6 2012: D+4.0 2008: D+8.6
Not yet ingested
- Civics
- —
Market trends
- HPI YoY
- ▼ -211.46%
- Current HPI
- 154.8325
- Rent YoY
- ▲ 2.94%
- Metro
- Detroit-Warren-Dearborn, MI
- State GDP YoY
- ▲ 1.37%
- F500 in state
- 28
Industry mix (Fortune 500 HQ in MI)
| Industry | F500 HQs | Revenue |
|---|---|---|
| Automotive Parts | 3 | $48B |
|
||
| Automotive | 2 | $372B |
|
||
| Chemicals | 1 | $45B |
|
||
| Automotive Retail | 1 | $29B |
|
||
| Healthcare / Medical Devices | 1 | $23B |
|
||
| Automotive Technology | 1 | $20B |
|
||
Price history
+130.4% since first listed26 events — show timeline
- 2026-05-18 Listed $85,000 REALCOMP
- 2026-05-18 Listed $85,000 MiRealSource-MiMLS
- 2026-04-10 Listing Removed — MiRealSource-MiMLS
- 2026-04-10 Listing Removed — REALCOMP
- 2026-03-06 Listed $105,000 MiRealSource-MiMLS
- 2026-03-06 Listed $105,000 REALCOMP
- 2023-10-17 Sold (Public Records) $89,000 Public Records
- 2023-10-06 Sold (MLS) $89,000 MiRealSource-MiMLS
- 2023-10-06 Sold (MLS) $89,000 REALCOMP
- 2023-09-01 Pending — MiRealSource-MiMLS
- 2023-09-01 Pending — REALCOMP
- 2023-08-22 Listed $94,000 MiRealSource-MiMLS
- 2023-08-22 Listed $94,000 REALCOMP
- 2023-08-07 Listing Removed — MiRealSource-MiMLS
- 2023-08-07 Listing Removed — REALCOMP
- 2023-06-15 Listed $99,000 MiRealSource-MiMLS
- 2023-06-15 Listed $99,000 REALCOMP
- 2022-10-18 Listing Removed — MiRealSource-MiMLS
- 2022-10-18 Price Changed $99,000 MiRealSource-MiMLS
- 2022-10-18 Listing Removed — REALCOMP
- 2022-10-18 Price Changed $99,000 REALCOMP
- 2022-10-07 Listed $70,000 MiRealSource-MiMLS
- 2022-10-07 Listed $70,000 REALCOMP
- 2005-09-02 Listing Removed — MiRealSource-MiMLS
- 2005-07-30 Listed $74,500 MiRealSource-MiMLS
- 1992-03-23 Sold (Public Records) $36,900 Public Records
Property tax history
+10.8%/yrLatest (2025): $2,680 · +2.6% YoY. Source: county tax records.
Cash-flow waterfall
monthlySold comps — $/sqft
last 12 mo · ≤1 miLoading sold comps…