 🏷️ Likely Rental
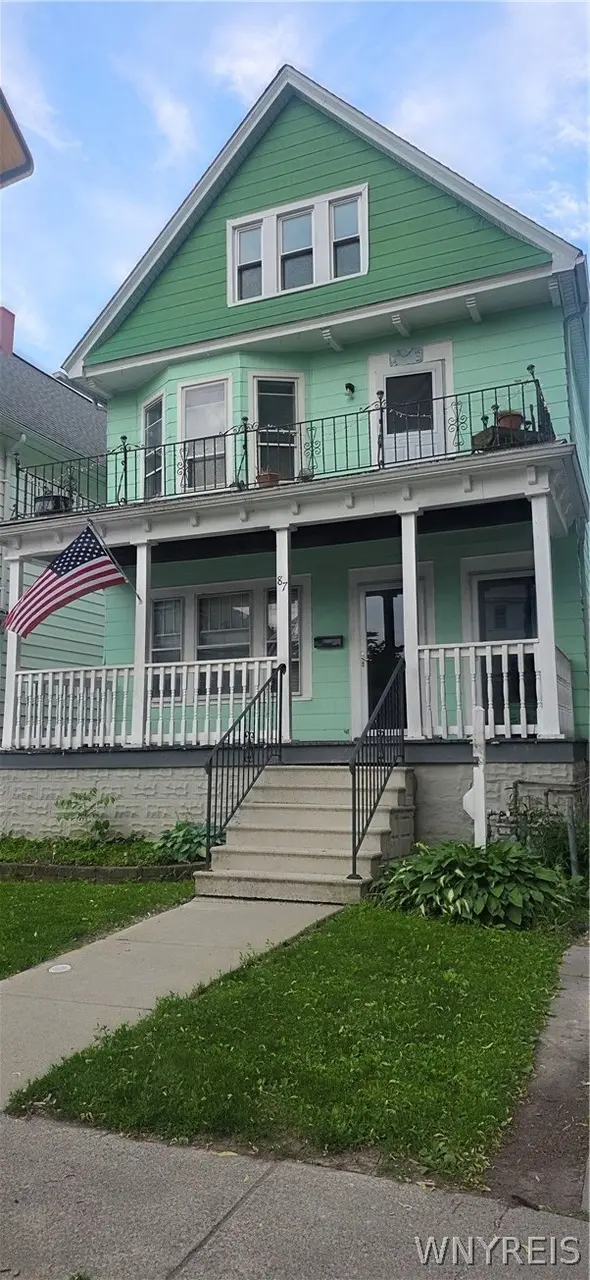
87 Hayden St · Buffalo, NY
Flood risk 6/10 · Moderate
- FEMA flood zone
- X (unshaded)
- Chance of flooding over 30 yrs
- 0.74%
- Est. flood insurance / yr
- $473 – $860
Fire risk 1/10 · Minimal
- Est. fire insurance / yr
- $691 – $1,283
Heat risk 3/10 · Minor
- Hot days now (above 92°F)
- 7 days/yr
- Hot days in 30 yrs
- 15 days/yr
Wind risk 1/10 · Minimal
- Chance of severe wind over 30 yrs
- —
Air-quality risk 3/10 · Minor
- Unhealthy air days now
- 2 days/yr
- Unhealthy air days in 30 yrs
- 3 days/yr
Risk factors via First Street. Map © Google.
Why this score? — see what drove the A- grade
The composite is a weighted blend of 9 inputs, each scored 0–100. Each bar is that input's sub-score; the figure is the points it added to the 100-point composite (weight × sub-score).
- Cash flow +27.9/30.0
- ARV discount +15.0/15.0
- Appreciation +10.0/10.0
- DSCR +9.9/10.0
- 1% rule +6.4/10.0
- Rent growth +5.0/5.0
- Livability +3.9/5.0
- Schools +3.3/10.0
- Condition / age +2.5/5.0
$169,000
🖨 Deal sheet 📄 Offer letter ✓ Due diligence
Listing remarks
Are you looking to add a duplex to your portfolio? Or maybe you're searching for a place that affords the luxury of rental income to help with the high cost of living? Either way, this solid 3/2 Double located on a quiet, one-way street in South Buffalo is a wonderful option! The lower unit is occupied & on a month to month lease, conveniently providing the next owner with immediate income! The upper unit is vacant and easy to view. While you could opt for some minor updating, for the most part, this unit is ready for immediate occupancy. The kitchens provide ample storage with its original floor to ceiling cupboards, original hardwood floors run throughout both units, all mechanicals
Key facts
- Replaced windows
- Immediate income
- Newer mechanicals
Tags
Property features AI
Finance
- Other: Operating expenses include water/sewer (see remarks)
- Financial info: Owner pays water; One unit currently rented for $500 (month-to-month); Two separate gas meters and two separate electric meters; Two total units
Exterior
- Parking: Garage (1 car); On-street parking; Two or more parking spaces available
- Utilities: Electricity connected; Public water connected; Sewer connected; Cable available; High-speed internet available
- Home design: 3-story building; Existing structure
- Construction: Frame construction with vinyl siding; Architectural shingle roof; Stone foundation; Built (existing)
- Exterior features: Fully fenced private yard; Covered and open porch; Patio/porch; Property near public transit; Rectangular, residential lot; City street / main thoroughfare frontage
Interior
- Kitchen: Eat-in kitchen in each unit
- Bedrooms: Two 3-bedroom units (each unit has 3 bedrooms)
- Flooring: Carpet; Hardwood; Varies
- Bathrooms: Each unit has 1 full bathroom (2 full bathrooms total)
- Heating & cooling: Gas forced-air heating
- Interior features: Ceiling fans; Natural woodwork; Full basement
- Laundry & utility: Washer hookup; One unit lists washer and dryer
Neighborhood map
What this means for you Summary
Snapshot
- This is a 5-bed/2.0-bath townhouse listed at $169k.
Deal economics
- At list price, monthly cash flow is $519 ($6k/yr) — positive.
- The deal already cash-flows at list — no discount required.
- Meets the 1% rule at list price ($2k rent vs $169k).
- Cap rate 10.0% vs local median 8.0% in Buffalo — meaningfully above typical; check what's discounted (condition, days-on-market, listing class) to confirm the premium yield is real.
Location & tenants
- Location reads 77/100 on livability (#195 in NY, #3,011 nationally) — a middle-class / working-renter tenant base. Strengths: commute A+, housing A+, health & safety A+; Watch: crime F, employment D-.
- Buffalo City School District (urban): math 41% / reading 40% proficiency, ranked #535 of 590 in NY (top 91%) — families likely to look elsewhere, expect single-tenant / working-renter base with shorter leases; 75% free/reduced lunch — lower-income household profile, screen leases tightly.
- Market conditions: Rents rising fast (+12.7%/yr); 94 active listings in the ZIP; 1,244 units permitted in Erie County in 2024 (563 in 5+ unit buildings).
- This rent runs 43% of the median local income ($54k/yr) — at the standard rent-burdened threshold; future hikes will face affordability resistance.
Forward outlook
- In year one you build about $18k of equity ($1k loan paydown + $17k appreciation (10.0% local appreciation)).
- At projected returns (10.0% appreciation + 8.0% rent growth), your $47k cash investment doubles in ~2 years — after that, you're playing with house money.
- By year 3, paydown + projected appreciation supports a ~$46k cash-out refi (75% LTV) — recoverable capital for the next deal without selling this one.
Negotiation context
- Only 12 days on market — expect competitive offers; lowballing is unlikely to land.
Risks & watch-outs
- Watch-outs: built in 1920 — expect roof / HVAC / electrical / plumbing capex.
- Climate carrying-cost: major flood risk — expect insurance premiums to compound above CPI over the hold.
Questions for the listing agent
- Built in 1920 — when were the roof, HVAC, electrical panel, plumbing, and water heater last replaced?
- Is there a deadline driving the sale (1031 exchange, divorce, estate, relocation)? That informs how much negotiation room exists.
- Crime grade is F in this area — have there been break-ins, vandalism, or insurance claims at this property in the last 3 years? What carrier currently insures it and at what premium?
- What's the average days-on-market for RENTAL listings here right now (not sales)? A rising rental-DOM trend means longer vacancies and softer asking-rent achievability than the comps imply.
- What's the recent tenant-quality profile in this submarket — average credit score on applications, eviction rate, late-payment / NSF rate, and stable-employment percentage? A property-management company in the area should have these aggregated.
- How much new for-sale + rental construction is in the pipeline within 1–3 miles? Heavy new supply typically softens prices + rents 12–24 months out; constrained supply supports both.
Investment metrics
- 1% rule
- 1.14% ✓
- Cap rate
- 9.98%
- Cash-on-cash
- 13.17%
- DSCR
- 1.59
- GRM
- 7.3
CMA / ARV
- ARV (on-the-fly)
- $213,400
- Comps found
- 12
Show comp detail 12 sales within ~0.75 mi
| Address | Dist | Beds/Ba | Sqft | Sold | Price | $/sf | Match |
|---|---|---|---|---|---|---|---|
| 18 S Ryan St | 0.23mi | 6/2.0 (+1) | 2,244 (+2%) | 3mo | $270,000 | $120 | 79 |
| 58 Roanoke Pkwy | 0.21mi | 5/2.0 | 2,344 (+6%) | 6mo | $225,000 | $96 | 74 |
| 11 Indian Church Rd | 0.55mi | 5/2.0 | 2,156 (-2%) | 2mo | $182,000 | $84 | 69 |
| 42 Meriden St | 0.63mi | 6/2.0 (+1) | 2,220 (+1%) | 5mo | $250,000 | $113 | 60 |
| 42 Kamper Ave | 0.19mi | 6/2.0 (+1) | 1,898 (-14%) | 4mo | $136,000 | $72 | 59 |
| 26 Zittel St | 0.30mi | 6/2.0 (+1) | 2,456 (+12%) | 5mo | $250,000 | $102 | 58 |
| 53 Duerstein St | 0.65mi | 6/2.0 (+1) | 2,112 (-4%) | 0mo | $270,000 | $128 | 58 |
| 128 Armin Pl | 0.28mi | 6/2.0 (+1) | 2,490 (+13%) | 8mo | $242,500 | $97 | 53 |
| 81 Duerstein St | 0.65mi | 6/2.0 (+1) | 2,400 (+9%) | 2mo | $140,000 | $58 | 48 |
| 15 Teresa Pl | 0.55mi | 6/2.0 (+1) | 2,376 (+8%) | 10mo | $275,000 | $116 | 47 |
| 88 Parkview Ave | 0.46mi | 6/2.0 (+1) | 2,464 (+12%) | 9mo | $199,088 | $81 | 46 |
| 425 Cumberland Ave | 0.63mi | 6/2.0 (+1) | 2,355 (+7%) | 16mo | $135,000 | $57 | 41 |
Match score weights: distance 35% · size 25% · config 20% · recency 20%. Top-matched comps best support the ARV.
Projected returns pro-forma
10.0% appreciation · 8.0% rent growth · sell at horizon
- IRR
- 36.1%
- Equity multiple
- 3.86×
- Total profit
- $135,244
- Equity at exit
- $152,249
- IRR
- 32.8%
- Equity multiple
- 9.40×
- Total profit
- $397,414
- Equity at exit
- $328,330
Cash invested: $47,320 (down + closing). Projections, not guarantees.
Landlord ↔ Tenant lean methodology
- Overall (STATE)
- 15 Strongly Tenant-Friendly
- State New York
- 15 Strongly Tenant-Friendly · D+10
- County
- — inherits STATE
- City
- — inherits STATE
ZIP-level market 14210
- Home prices YoY
- 13.8%
- Rents YoY
- 12.7%
- Active inventory
- 94
- Price-to-rent
- 7.3×
Monthly cashflow live
- Estimated rent
- $1,931 medium interval (Pro) →
- Mortgage (P&I)
- −$886
- Tax from tax record
- −$50 /mo · $598/yr
- Insurance
- −$70
- HOA
- −$0
- Vacancy / Maint / Mgmt
- −$406
- Net cashflow
- $519
Break-even live
UW: 25.0% down · 7.5% · 30yr · 1.5% tax · 5.0% vac · 8.0% maint · 8.0% mgmt
Financing live
Cash to close
- Down payment
- $42,250
- Closing costs
- $5,070
- Reserves months
- —
- Total cash needed
- —
Loan-product check · same deal, 3 products live
Conventional
25% down · 7.5% · 30yr
- Down + closing
- —
- Monthly P&I
- —
- Monthly cashflow
- —
- DSCR
- —
- Eligible?
- —
Personal DTI + credit; lowest rate.
DSCR
20% down · 8.5% · 30yr
- Down + closing
- —
- Monthly P&I
- —
- Monthly cashflow
- —
- DSCR
- —
- Eligible?
- —
No personal income docs; deal must DSCR.
Hard money
10% down · 12.0% · 12mo
- Down + closing
- —
- Monthly P&I
- —
- Monthly cashflow
- —
- DSCR
- —
- Eligible?
- —
Short-term bridge; refi at stabilization.
Listing history 11 events
-
2026-06-18days on market $169,000 Active 12 DOM
-
2026-06-17days on market $169,000 Active 11 DOM
-
2026-06-16days on market $169,000 Active 10 DOM
-
2026-06-15days on market $169,000 Active 9 DOM
-
2026-06-13days on market $169,000 Active 7 DOM
-
2026-06-13days on market $169,000 Active 6 DOM
-
2026-06-10days on market $169,000 Active 4 DOM
-
2026-06-09days on market $169,000 Active 3 DOM
-
2026-06-08days on market $169,000 Active 2 DOM
-
2026-06-07remarks 695-char remark
-
2026-06-07$169,000 Active 1 DOM
ⓘ Source: listings_history table (triggers on properties + properties_extension) + one-shot
backfill from property_details.listing_events for pre-trigger history.
Tax reassessment forecast NY · Partial reset (capped growth)
- Current annual tax
- $598 · $50/mo
- Projected year-2 tax
- $1,727 · $144/mo
- Expected delta
- +$1,129/yr (+$94/mo · 188.9%)
ⓘ Screening estimate from a state-policy table — verify with the county assessor before closing.
Climate risk First Street
- Flood 6/10 Major FEMA zone X (unshaded) · 74% chance over 30 yrs
- Wildfire 1/10 Low
- Heat 3/10 Moderate 7 d/yr ≥92°F today · 15 d/yr by 30 yrs out
- Wind 1/10 Low
- Air quality 3/10 Moderate 2 unhealthy d/yr today · 3 by 30 yrs out
Nearby sold comps map
Loading sold comps map…
Walkable amenities ~0.75 mi
Loading nearby amenities…
Taxation est. · year 1
- Rental income
- $23,175
- − Mortgage interest
- −$9,467
- − Property taxes
- −$598
- − Insurance
- −$845
- − Repairs & maintenance
- −$1,854
- − Management
- −$1,854
- − Depreciation
- −$4,916
- Taxable income
- $3,641
- Est. tax owed @ 24.0%
- −$874
- After-tax cash flow
- $5,356/yr
For passive investors: Depreciation is non-cash, so a rental often shows a tax loss while cash-flowing — sheltering income. Rental losses are passive: they offset passive income freely, and up to $25,000/yr can offset ordinary (W-2) income if you actively participate and your MAGI is under $100k (phasing out to $0 by $150k); unused losses carry forward. On sale, claimed depreciation is recaptured at up to 25%, and gains may owe capital-gains tax (a 1031 exchange can defer both). Figures are a year-1 estimate at your 24.0% rate — not tax advice; consult a CPA.
Schools (NCES district)
- District
- Buffalo City School District
- NCES district ID
- 3605850
- Math proficiency
- 41% ▲ 11.00%
- Reading proficiency
- 40% ▲ 7.00%
- Median HH income
- $31,665
- Composite
- 33.17/100
- National rank
- #5544
- State rank
- #535 of 590 in NY
Livability — Buffalo
- Score
- 77/100
- State rank
- #195
- US rank
- #3011
Category grades
Schools grade is shown separately in the Schools card above.
Census & demographics
- Census place
- Buffalo, NY
- County
- Erie County · 714,559 people
- City population
- 440,021
- Metro
- Buffalo-Cheektowaga, NY
- Population (ZIP)
- 15,563
- Household income
- $54,197
- Rent vs Own
- Severe rent burden
- 959.0
Population outlook (Erie County) Hauer SSP2
- Today (2025)
- 933,037 people
- By 2030
- 935,181 · +0.2%
- By 2040
- 928,531 · -0.5%
- By 2050
- 905,725 · -2.9%
- By 2075
- 834,037 · -10.6%
- By 2100
- 708,033 · -24.1%
Race, ethnicity, and origin ACS 2023
- Neighborhood character
- Predominantly White (79%)
- Race & ethnicity
- White 79% Two or more races 8% Black 8% Hispanic / Latino 7% Asian 1%
- Hispanic origin (detail)
- Puerto Rican 6%
- Common ancestry
- Romanian 21% Lithuanian 2% Serbian 1%
- Foreign-born
- 2% · Canada, China
- Languages at home
- 95% English-only · Spanish 2% Arabic 1% Other Indo-European 1%
Political lean MEDSL · Erie
- 2024 margin
- Lean D (+9.7) · D 54.8% · R 45.2%
- 2008→2024 swing
- -7.9pp toward R · 2008: 17.5pp · 2024: 9.7pp
- All cycles
- 2024: D+9.7 2020: D+14.7 2016: D+4.8 2012: D+15.6 2008: D+17.5
Not yet ingested
- Civics
- —
Market trends
- HPI YoY
- ▲ 52.34%
- Current HPI
- 431.7951
- Rent YoY
- ▲ 12.67%
- Metro
- Buffalo-Cheektowaga, NY
- State GDP YoY
- ▲ 2.60%
- F500 in state
- 92
Industry mix (Fortune 500 HQ in NY)
| Industry | F500 HQs | Revenue |
|---|---|---|
| Financial Services | 10 | $950B |
|
||
| Consumer Goods | 9 | $162B |
|
||
| Insurance | 4 | $225B |
|
||
| Telecommunications | 2 | $144B |
|
||
| Pharmaceuticals | 2 | $112B |
|
||
| Media / Entertainment | 2 | $69B |
|
||
Price history
1 event — show timeline
- 2026-06-05 Listed $169,000 WNYREIS
Property tax history
+8.5%/yrLatest (2025): $598 · +69.3% YoY. Source: county tax records.
Cash-flow waterfall
monthlySold comps — $/sqft
last 12 mo · ≤1 miLoading sold comps…