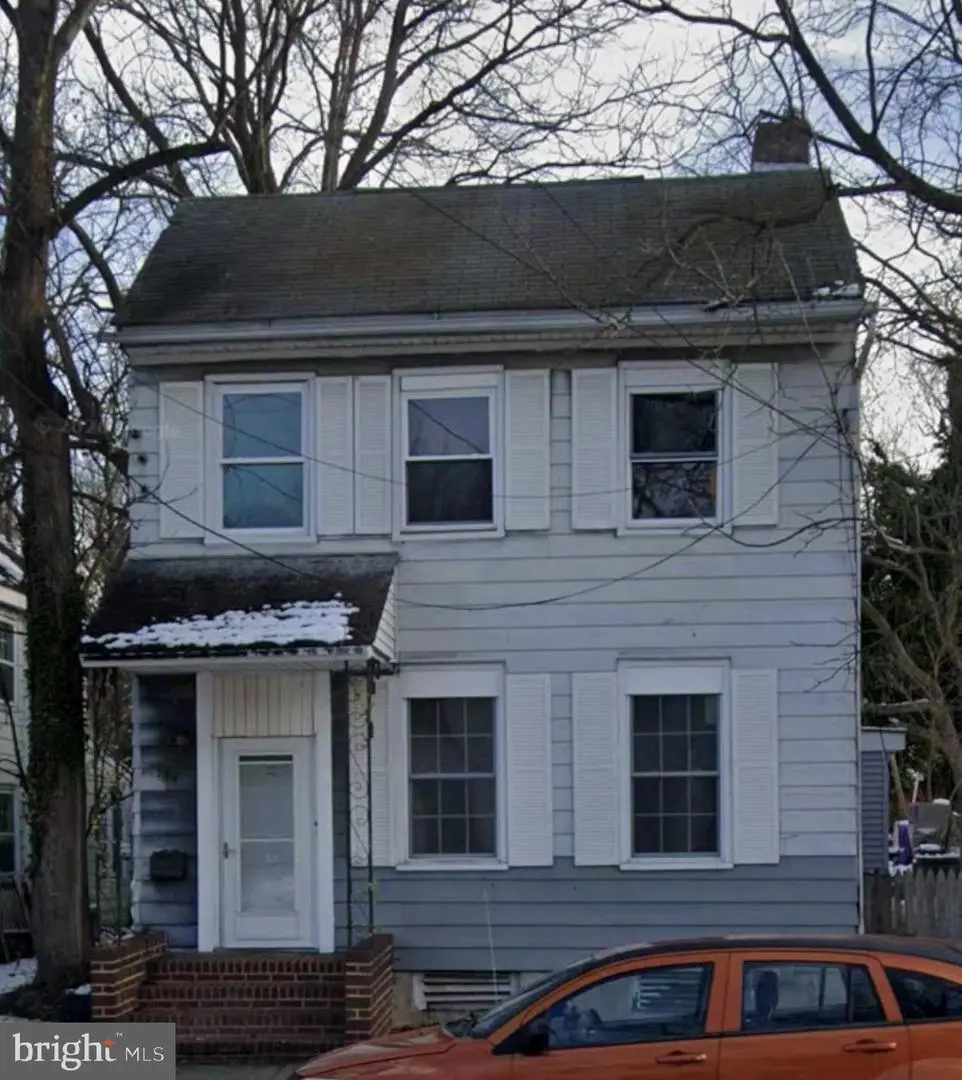
294 E Broadway · Salem, NJ
Flood risk 6/10 · Moderate
- FEMA flood zone
- X (shaded)
- Chance of flooding over 30 yrs
- 0.52%
- Est. flood insurance / yr
- $507 – $1,088
Fire risk 1/10 · Minimal
- Est. fire insurance / yr
- $526 – $976
Heat risk 8/10 · Major
- Hot days now (above 103°F)
- 7 days/yr
- Hot days in 30 yrs
- 15 days/yr
Wind risk 6/10 · Moderate
- Chance of severe wind over 30 yrs
- 27.0%
Air-quality risk 3/10 · Minor
- Unhealthy air days now
- 2 days/yr
- Unhealthy air days in 30 yrs
- 4 days/yr
Risk factors via First Street. Map © Google.
Why this score? — see what drove the B+ grade
The composite is a weighted blend of 9 inputs, each scored 0–100. Each bar is that input's sub-score; the figure is the points it added to the 100-point composite (weight × sub-score).
- Cash flow +30.0/30.0
- ARV discount +15.0/15.0
- 1% rule +10.0/10.0
- DSCR +10.0/10.0
- Appreciation +4.8/10.0
- Livability +3.1/5.0
- Rent growth +2.5/5.0
- Condition / age +2.5/5.0
- Schools +1.2/10.0
$130,000
🖨 Deal sheet (PDF) 📄 Offer letter ✓ Due diligence
Listing remarks MLS
Calling all investors don't let this one slip through your fingers this 3 BR 1 BR home has two meters so could be broken down into two units for rental. There is a separate area that is a 1 BR with 1 BR off the kitchen that has its own separate exterior entrance. Seller is willing to bundle with NJSA2000452 and NJSA2000460. Properties are being sold strictly in as is condition buyer is responsible for certificate of Occupancy, any inspections are for buyers information only.
Key facts
- 6,599 sq ft lot
- Built 1920
- Listed 68 days
Property features AI
Exterior
- Parking: On-street parking
- Utilities: Public water; Public sewer
- Home design: Detached structure; Frame construction
- Construction: Frame construction with brick/mortar foundation; Above-grade and below-grade structures
- Exterior features: Not in a federal flood zone
Interior
- Bedrooms: Four bedrooms on the first upper level; One bedroom on the main level
- Bathrooms: Two full bathrooms (one on main level, one on first upper level)
- Heating & cooling: Forced air heating (90% of home); Natural gas heating fuel; Electric hot water
- Interior features: Two or more access exits
Neighborhood map
What this means for you Summary
Snapshot
- This is a 5-bed/2.0-bath single-family listed at $130k.
Deal economics
- At list price, monthly cash flow is $729 ($9k/yr) — positive.
- The deal already cash-flows at list — no discount required.
- Meets the 1% rule at list price ($2k rent vs $130k).
- Recommended offer: $122k (6.0% below list) — sets the bar for market timing.
- Cap rate 13.0% vs local median 8.4% in Salem — top-decile yield for the area; either an underpriced asset or a hidden risk that comps aren't pricing in. Stress-test before assuming the spread holds.
Location & tenants
- Location reads 61/100 on livability (#462 in NJ) — a middle-class / working-renter tenant base. Strengths: cost of living A+, health & safety A+, crime B; Watch: schools D, amenities F, commute F.
- Salem City School District (town): math 6% / reading 24% proficiency, ranked #464 of 472 in NJ (top 98%) — low school quality limits family demand, transient renter base, plan for 1-2y turnover; 85% free/reduced lunch — lower-income household profile, screen leases tightly.
- Market conditions: 100 active listings in the ZIP; 1 comparable units currently listed for rent nearby; 95 units permitted in Salem County in 2024 (0 in 5+ unit buildings).
- At $2,284/mo this rent would consume 50% of the median local household income ($55k/yr) (locally 663% of renters already pay >50% of income on rent) — very limited rent-growth headroom before tenants either downsize or default.
Forward outlook
- In year one you build about $405 of equity ($899 loan paydown + $-494 appreciation (-0.4% local appreciation)).
- Salem County population projected at -23% by 2050 — secular population decline; favor cash flow + early exit over multi-decade hold.
- At projected returns (-0.4% appreciation + 3.0% rent growth), your $36k cash investment doubles in ~4 years — after that, you're playing with house money.
Negotiation context
- It's been on market 68 days — a 6% lower offer ($122k) is reasonable based on typical stale-listing flexibility.
- 7 sale attempts since 20y ago with the ask held roughly flat each time — persistent listings suggest the price (not the market) is what's stuck; bring a comps-based counter.
- Current owner paid $32k; list at $130k implies a 300% gain — meaningful room to come down on a strong offer.
Risks & watch-outs
- Watch-outs: property tax is 3.1% of price; built in 1920 — expect roof / HVAC / electrical / plumbing capex.
- Climate carrying-cost: major flood risk; major wind risk, 27% chance of damaging wind over 30y; extreme-heat days projected 7→15/yr by 2055 (HVAC capex compounding) — expect insurance premiums to compound above CPI over the hold.
Questions for the listing agent
- It's been on market 68 days. Have you received any prior offers? Is the seller open to a 6% concession, seller financing, or rate buy-down credit?
- Built in 1920 — when were the roof, HVAC, electrical panel, plumbing, and water heater last replaced?
- Property tax is high relative to price — has the assessment been appealed recently, and will the sale trigger a re-assessment?
- Why hasn't it sold? Are there any deal-killer items the seller is aware of (foundation, flood, title, zoning, code violations)?
- Is there a deadline driving the sale (1031 exchange, divorce, estate, relocation)? That informs how much negotiation room exists.
- Schools are D-rated, which usually means shorter tenancies and higher turnover. Who's the typical renter profile here, and what's been the actual vacancy rate?
- What's the average days-on-market for RENTAL listings here right now (not sales)? A rising rental-DOM trend means longer vacancies and softer asking-rent achievability than the comps imply.
- What's the recent tenant-quality profile in this submarket — average credit score on applications, eviction rate, late-payment / NSF rate, and stable-employment percentage? A property-management company in the area should have these aggregated.
- How much new for-sale + rental construction is in the pipeline within 1–3 miles? Heavy new supply typically softens prices + rents 12–24 months out; constrained supply supports both.
Investment metrics
- 1% rule
- 1.76% ✓
- Cap rate
- 13.02%
- Cash-on-cash
- 24.04%
- DSCR
- 2.07
- GRM
- 4.7
CMA / ARV
- ARV (on-the-fly)
- $220,864
- Comps found
- 8
Show comp detail 8 sales within ~0.75 mi
| Address | Dist | Beds/Ba | Sqft | Sold | Price | $/sf | Match |
|---|---|---|---|---|---|---|---|
| 334 Craven Ave | 0.16mi | 4/1.5 (-1) | 1,843 (-1%) | 2mo | $245,000 | $133 | 82 |
| 6 Walnut St | 0.20mi | 4/2.0 (-1) | 1,764 (-5%) | 2mo | $70,000 | $40 | 76 |
| 187 7th St | 0.22mi | 4/2.0 (-1) | 1,929 (+4%) | 3mo | $67,000 | $35 | 76 |
| 216 N Union St | 0.19mi | 4/2.0 (-1) | 1,798 (-3%) | 16mo | $265,000 | $147 | 68 |
| 8 Eakin St | 0.08mi | 4/2.0 (-1) | 1,676 (-10%) | 17mo | $226,000 | $135 | 61 |
| 320 Fenwick Ave | 0.23mi | 4/2.0 (-1) | 1,958 (+6%) | 18mo | $190,000 | $97 | 60 |
| 93 7th St | 0.39mi | 6/2.5 (+1) | 2,042 (+10%) | 8mo | $183,000 | $90 | 51 |
| 14 Hillcrest Ave | 0.59mi | 4/1.0 (-1) | 1,649 (-11%) | 6mo | $196,000 | $119 | 40 |
Match score weights: distance 35% · size 25% · config 20% · recency 20%. Top-matched comps best support the ARV.
Projected returns pro-forma
-0.38% appreciation · 3.0% rent growth · sell at horizon
- IRR
- 23.4%
- Equity multiple
- 2.11×
- Total profit
- $40,470
- Equity at exit
- $35,295
- IRR
- 27.9%
- Equity multiple
- 4.02×
- Total profit
- $110,110
- Equity at exit
- $40,516
Cash invested: $36,400 (down + closing). Projections, not guarantees.
Landlord ↔ Tenant lean methodology
- Overall (STATE)
- 21 Tenant-Leaning
- State New Jersey
- 21 Tenant-Leaning · D+6
- County
- — inherits STATE
- City
- — inherits STATE
ZIP-level market 08079
- Home prices YoY
- -0.1%
- Active inventory
- 100
- Price-to-rent
- 4.7×
Monthly cashflow live
- Estimated rent
- $2,284 medium interval (Pro) →
- Mortgage (P&I)
- −$682
- Tax from tax record
- −$339 /mo · $4,072/yr
- Insurance
- −$54
- HOA
- −$0
- Vacancy / Maint / Mgmt
- −$480
- Net cashflow
- $729
Break-even live
Sensitivity live
| Price | -10% $803 | -5% $766 | +0% $729 | +5% $692 | +10% $655 |
|---|---|---|---|---|---|
| Rent | -10% $549 | -5% $639 | +0% $729 | +5% $819 | +10% $910 |
| Rate | -1.0pp $795 | -0.5pp $762 | base $729 | +0.5pp $695 | +1.0pp $661 |
UW: 25.0% down · 7.5% · 30yr · 1.5% tax · 5.0% vac · 8.0% maint · 8.0% mgmt
Financing live
Cash to close
- Down payment
- $32,500
- Closing costs
- $3,900
- Reserves months
- —
- Total cash needed
- —
Loan-product check · same deal, 3 products live
Conventional
25% down · 7.5% · 30yr
- Down + closing
- —
- Monthly P&I
- —
- Monthly cashflow
- —
- DSCR
- —
- Eligible?
- —
Personal DTI + credit; lowest rate.
DSCR
20% down · 8.5% · 30yr
- Down + closing
- —
- Monthly P&I
- —
- Monthly cashflow
- —
- DSCR
- —
- Eligible?
- —
No personal income docs; deal must DSCR.
Hard money
10% down · 12.0% · 12mo
- Down + closing
- —
- Monthly P&I
- —
- Monthly cashflow
- —
- DSCR
- —
- Eligible?
- —
Short-term bridge; refi at stabilization.
Rent comps 1 comps
| Address | Beds | Baths | Sqft | Rent | $/sqft | DOM | Units | Dist |
|---|---|---|---|---|---|---|---|---|
| 270-272 Grant St Salem, NJ | 4.0 | 1.0 | 1644 | $2,100 | $1.28 | 5d | 1 | 0.25mi |
Listing history 32 events
-
2026-06-18days on market $130,000 Active 68 DOM
-
2026-06-17days on market $130,000 Active 67 DOM
-
2026-06-16days on market $130,000 Active 66 DOM
-
2026-06-15days on market $130,000 Active 65 DOM
-
2026-06-13days on market $130,000 Active 63 DOM
-
2026-06-13days on market $130,000 Active 62 DOM
-
2026-06-09days on market $130,000 Active 59 DOM
-
2026-06-08days on market $130,000 Active 58 DOM
-
2026-06-07days on market $130,000 Active 57 DOM
-
2026-06-04days on market $130,000 Active 54 DOM
-
2026-06-03days on market $130,000 Active 53 DOM
-
2026-06-02days on market $130,000 Active 52 DOM
-
2026-06-01days on market $130,000 Active 51 DOM
-
2026-05-31days on market $130,000 Active 50 DOM
-
2026-04-11$130,000 Active
-
2021-09-17soldstatus $32,500 Closed 479-char remark
Show marketing remark (479 chars)
Calling all investors don't let this one slip through your fingers this 3 BR 1 BR home has two meters so could be broken down into two units for rental. There is a separate area that is a 1 BR with 1 BR off the kitchen that has its own separate exterior entrance. Seller is willing to bundle with NJSA2000452 and NJSA2000460. Properties are being sold strictly in as is condition buyer is responsible for certificate of Occupancy, any inspections are for buyers information only.
-
2021-08-31status Pending 479-char remark
Show marketing remark (479 chars)
Calling all investors don't let this one slip through your fingers this 3 BR 1 BR home has two meters so could be broken down into two units for rental. There is a separate area that is a 1 BR with 1 BR off the kitchen that has its own separate exterior entrance. Seller is willing to bundle with NJSA2000452 and NJSA2000460. Properties are being sold strictly in as is condition buyer is responsible for certificate of Occupancy, any inspections are for buyers information only.
-
2021-07-20$60,000 Active 479-char remark
Show marketing remark (479 chars)
Calling all investors don't let this one slip through your fingers this 3 BR 1 BR home has two meters so could be broken down into two units for rental. There is a separate area that is a 1 BR with 1 BR off the kitchen that has its own separate exterior entrance. Seller is willing to bundle with NJSA2000452 and NJSA2000460. Properties are being sold strictly in as is condition buyer is responsible for certificate of Occupancy, any inspections are for buyers information only.
-
2018-03-30soldstatus $8,000 Sold 309-char remark
Show marketing remark (309 chars)
Lots of room for a great price. Make this home yours! Cash or 203 K financing only. Home being sold in "as is" condition with buyer responsible for all inspections and certifications needed to close. This home is available to owner occupant or not for profit buyers for first 20 days of the listing.
-
2018-03-30soldstatus $8,000 Closed
Show marketing remark (309 chars)
Lots of room for a great price. Make this home yours! Cash or 203 K financing only. Home being sold in "as is" condition with buyer responsible for all inspections and certifications needed to close. This home is available to owner occupant or not for profit buyers for first 20 days of the listing.
-
2018-02-21status Under Contract 309-char remark
Show marketing remark (309 chars)
Lots of room for a great price. Make this home yours! Cash or 203 K financing only. Home being sold in "as is" condition with buyer responsible for all inspections and certifications needed to close. This home is available to owner occupant or not for profit buyers for first 20 days of the listing.
-
2018-02-21historical
Show marketing remark (309 chars)
Lots of room for a great price. Make this home yours! Cash or 203 K financing only. Home being sold in "as is" condition with buyer responsible for all inspections and certifications needed to close. This home is available to owner occupant or not for profit buyers for first 20 days of the listing.
-
2018-02-05$9,999 Active 309-char remark
Show marketing remark (309 chars)
Lots of room for a great price. Make this home yours! Cash or 203 K financing only. Home being sold in "as is" condition with buyer responsible for all inspections and certifications needed to close. This home is available to owner occupant or not for profit buyers for first 20 days of the listing.
-
2018-02-05$9,999
Show marketing remark (309 chars)
Lots of room for a great price. Make this home yours! Cash or 203 K financing only. Home being sold in "as is" condition with buyer responsible for all inspections and certifications needed to close. This home is available to owner occupant or not for profit buyers for first 20 days of the listing.
-
2018-02-03soldstatus $9,999
-
2018-02-03soldstatus $9,999 Sold
-
2018-01-08status Under Contract
-
2017-12-27$9,999
-
2017-12-27$9,999 Active
-
2007-03-28soldstatus $37,000
-
2007-03-08historical
-
2006-10-19$37,000
ⓘ Source: listings_history table (triggers on properties + properties_extension) + one-shot
backfill from property_details.listing_events for pre-trigger history.
Tax reassessment forecast NJ · Partial reset (capped growth)
- Current annual tax
- $4,072 · $339/mo
- Projected year-2 tax
- $4,072 · $339/mo
- Expected delta
- $0/yr ($0/mo · 0.0%)
ⓘ Screening estimate from a state-policy table — verify with the county assessor before closing.
Climate risk First Street
- Flood 6/10 Major FEMA zone X (shaded) · 52% chance over 30 yrs
- Wildfire 1/10 Low
- Heat 8/10 Severe 7 d/yr ≥103°F today · 15 d/yr by 30 yrs out
- Wind 6/10 Major 27% chance of damaging wind over 30 yrs
- Air quality 3/10 Moderate 2 unhealthy d/yr today · 4 by 30 yrs out
Nearby sold comps map
Loading sold comps map…
Walkable amenities ~0.75 mi
Loading nearby amenities…
Taxation est. · year 1
- Rental income
- $27,408
- − Mortgage interest
- −$7,282
- − Property taxes
- −$4,072
- − Insurance
- −$650
- − Repairs & maintenance
- −$2,193
- − Management
- −$2,193
- − Depreciation
- −$3,782
- Taxable income
- $7,236
- Est. tax owed @ 24.0%
- −$1,737
- After-tax cash flow
- $7,012/yr
For passive investors: Depreciation is non-cash, so a rental often shows a tax loss while cash-flowing — sheltering income. Rental losses are passive: they offset passive income freely, and up to $25,000/yr can offset ordinary (W-2) income if you actively participate and your MAGI is under $100k (phasing out to $0 by $150k); unused losses carry forward. On sale, claimed depreciation is recaptured at up to 25%, and gains may owe capital-gains tax (a 1031 exchange can defer both). Figures are a year-1 estimate at your 24.0% rate — not tax advice; consult a CPA.
Schools (NCES district)
- District
- Salem City School District
- NCES district ID
- 3414550
- Math proficiency
- 6% ▼ -1.00%
- Reading proficiency
- 24% ▲ 2.00%
- Median HH income
- $27,118
- Composite
- 11.51/100
- National rank
- #9702
- State rank
- #464 of 472 in NJ
Livability — Salem
- Score
- 61/100
- State rank
- #462
- US rank
- #17533
Category grades
Schools grade is shown separately in the Schools card above.
Census & demographics
- Census place
- Salem, NJ
- County
- Salem County · 24,175 people
- City population
- 10,762
- Metro
- Philadelphia-Camden-Wilmington, PA-NJ-DE-MD
- Population (ZIP)
- 10,762
- Household income
- $54,641
- Rent vs Own
- Severe rent burden
- 663.0
Population outlook (Salem County) Hauer SSP2
- Today (2025)
- 59,905 people
- By 2030
- 57,351 · -4.3%
- By 2040
- 51,837 · -13.5%
- By 2050
- 46,356 · -22.6%
- By 2075
- 36,452 · -39.2%
- By 2100
- 28,907 · -51.7%
Race, ethnicity, and origin ACS 2023
- Neighborhood character
- Diverse neighborhood (Simpson 0.55)
- Race & ethnicity
- White 59% Black 31% Hispanic / Latino 6% Two or more races 5% Asian 1%
- Hispanic origin (detail)
- Puerto Rican 5%
- Common ancestry
- Romanian 3% Lithuanian 2% Italian 1%
- Foreign-born
- 2% · Canada
- Languages at home
- 94% English-only · Spanish 4% Tagalog/Filipino 1%
Political lean MEDSL · Salem
- 2024 margin
- R (+19.2) · D 39.6% · R 58.8% · Other 1.6%
- 2008→2024 swing
- -23.1pp toward R · 2008: 3.9pp · 2024: -19.2pp
- All cycles
- 2024: R+19.2 2020: R+12.8 2016: R+15.4 2012: D+0.8 2008: D+3.9
Not yet ingested
- Civics
- —
Market trends
- HPI YoY
- ▼ -0.38%
- Current HPI
- 258.0047
- Rent YoY
- —
- Metro
- Philadelphia-Camden-Wilmington, PA-NJ-DE-MD
- State GDP YoY
- ▲ 2.05%
- F500 in state
- 34
Industry mix (Fortune 500 HQ in NJ)
| Industry | F500 HQs | Revenue |
|---|---|---|
| Consumer Goods | 3 | $31B |
|
||
| Pharmaceuticals | 2 | $153B |
|
||
| Technology | 2 | $21B |
|
||
| Insurance | 2 | $20B |
|
||
| Healthcare | 2 | $19B |
|
||
| Financial Services | 1 | $70B |
|
||
Price history
+251.4% since first listed18 events — show timeline
- 2026-04-11 Listed $130,000 BRIGHT MLS
- 2021-09-17 Sold (MLS) $32,500 BRIGHT MLS
- 2021-08-31 Pending — BRIGHT MLS
- 2021-07-20 Listed $60,000 BRIGHT MLS
- 2018-03-30 Sold (MLS) $8,000 BRIGHT MLS
- 2018-03-30 Sold (MLS) $8,000 TREND
- 2018-02-21 Pending — TREND
- 2018-02-21 Listing Removed — BRIGHT MLS
- 2018-02-05 Listed $9,999 BRIGHT MLS
- 2018-02-05 Listed $9,999 TREND
- 2018-02-03 Sold (MLS) $9,999 TREND
- 2018-02-03 Sold (MLS) $9,999 BRIGHT MLS
- 2018-01-08 Pending — TREND
- 2017-12-27 Listed $9,999 TREND
- 2017-12-27 Listed $9,999 BRIGHT MLS
- 2007-03-28 Sold (MLS) $37,000 BRIGHT MLS
- 2007-03-08 Listing Removed — BRIGHT MLS
- 2006-10-19 Listed $37,000 BRIGHT MLS
Property tax history
+0.6%/yrLatest (2025): $4,072 · +4.9% YoY. Source: county tax records.
Cash-flow waterfall
monthlySold comps — $/sqft
last 12 mo · ≤1 miLoading sold comps…