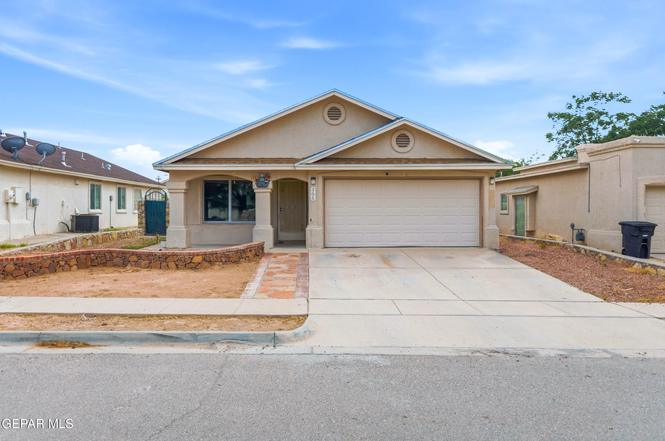
305 De Stefano Ln · Horizon City, TX
Flood risk 1/10 · Minimal
- FEMA flood zone
- X
- Chance of flooding over 30 yrs
- 0.0%
- Est. flood insurance / yr
- $507 – $1,088
Fire risk 3/10 · Minor
- Est. fire insurance / yr
- $1,222 – $2,270
Heat risk 6/10 · Moderate
- Hot days now (above 100°F)
- 7 days/yr
- Hot days in 30 yrs
- 25 days/yr
Wind risk 1/10 · Minimal
- Chance of severe wind over 30 yrs
- —
Air-quality risk 3/10 · Minor
- Unhealthy air days now
- 2 days/yr
- Unhealthy air days in 30 yrs
- 2 days/yr
Risk factors via First Street. Map © Google.
Why this score? — see what drove the F grade
The composite is a weighted blend of 9 inputs, each scored 0–100. Each bar is that input's sub-score; the figure is the points it added to the 100-point composite (weight × sub-score).
- Cash flow +7.7/30.0
- ARV discount +7.5/15.0
- 1% rule +4.1/10.0
- Livability +3.3/5.0
- Rent growth +3.2/5.0
- Condition / age +2.5/5.0
- DSCR +1.8/10.0
- Schools +1.5/10.0
- Appreciation +0.0/10.0
$205,000
🖨 Deal sheet (PDF) 📄 Offer letter ✓ Due diligence
Listing remarks
Welcome to this beautifully maintained 4-bedroom, 2-bath residence offering comfort, functionality, and thoughtful updates throughout. Featuring tile flooring in every room, a refrigerated air system installed in 2024, and a roof replaced in 2021, this home is move-in ready and designed for easy living. The spacious primary suite is a private retreat, complete with dual vanities, a walk-in shower, jetted soaking tub, and an oversized walk-in closet. The functional floor plan provides comfortable living spaces ideal for both everyday life and entertaining. Step outside to enjoy a low-maintenance backyard featuring a gazebo-covered patio, generous outdoor living space, and a raised privacy wa
Key facts
- Dual vanities
- Primary suite
- Tile flooring
Tags
Property features AI
Finance
- Other: No additional finance details provided
- Financial info: Tax information available but excluded per instructions
- HOA & community: No HOA fees
Exterior
- Parking: Parking details not provided
- Security: No security features listed
- Utilities: Utility details not provided
- Home design: Single family residence
- Construction: Stucco exterior; Shingle, pitched roof; Built area approximately 1478 total
- Exterior features: Walled backyard; Back yard access; Open patio
Interior
- Kitchen: Appliances listed in remarks
- Bedrooms: Bedroom count not provided
- Flooring: Tile flooring
- Bathrooms: 2 full bathrooms
- Heating & cooling: Central heating; Refrigerated cooling; Central air; Ceiling fans
- Interior features: Cable TV ready; Ceiling fans; Pantry; Double-pane windows
- Laundry & utility: No laundry details provided
Neighborhood map
What this means for you Summary
Snapshot
- This is a 4-bed/2.0-bath single-family listed at $205k.
Deal economics
- At list price, monthly cash flow is $-238 ($-3k/yr) — negative.
- To cash-flow at today's rent, offer at most $163k (20.5% below list).
- To meet the 1% rule (rent ≥ 1% of price), the offer needs to be $186k (9.2% below list).
- Recommended offer: $163k (20.5% below list) — sets the bar for cash-flow.
Location & tenants
- Location reads 66/100 on livability (#619 in TX) — a middle-class / working-renter tenant base. Strengths: crime A+, cost of living A+, housing A+; Watch: employment D, amenities F, commute F.
- Clint ISD (suburban): math 14% / reading 22% proficiency, ranked #792 of 826 in TX (top 96%) — low school quality limits family demand, transient renter base, plan for 1-2y turnover.
- Zoned schools: Desert Hills El (math 23% / reading 24%, grade F, #3,247 of 4,322 statewide, top 76%, 907 students, 78% FRL); Horizon Middle (math 16% / reading 20%, grade F, #1,491 of 1,662 statewide, top 91%, 670 students, 84% FRL); Horizon H S (math 14% / reading 26%, grade F, #1,397 of 1,632 statewide, top 87%, 1,677 students, 85% FRL) — zoned schools average 82% FRL vs 59% district-wide (23 pts higher); higher-poverty schools than district average — tighter screening recommended.
- Market conditions: Rents rising (+2.9%/yr); 2098 active listings in the ZIP; 17 comparable units currently listed for rent nearby; rentals at typical pace (median 16d on market — plan ~3-4 weeks tenant-placement turnaround); solid renter incomes; 2,196 units permitted in El Paso County in 2024 (143 in 5+ unit buildings).
Forward outlook
- Local home prices are declining (-3.0%/yr); year-one equity from $1k of loan paydown is wiped out by about $6k of value loss. Plan a longer hold.
- El Paso County population projected at +10% by 2050 — modest demand growth; plan on rents tracking national, not racing it.
Negotiation context
- Only 2 days on market — expect competitive offers; lowballing is unlikely to land.
- 7 sale attempts since 18y ago with the ask held roughly flat each time — persistent listings suggest the price (not the market) is what's stuck; bring a comps-based counter.
Risks & watch-outs
- Watch-outs: property tax is 3.2% of price.
- Climate carrying-cost: extreme-heat days projected 7→25/yr by 2055 (HVAC capex compounding) — expect insurance premiums to compound above CPI over the hold.
Questions for the listing agent
- What do current leases actually rent for vs. the listed asking? Can we see a recent rent roll and the last 12 months of T-12 income?
- Property tax is high relative to price — has the assessment been appealed recently, and will the sale trigger a re-assessment?
- Is there a deadline driving the sale (1031 exchange, divorce, estate, relocation)? That informs how much negotiation room exists.
- Schools are D-rated, which usually means shorter tenancies and higher turnover. Who's the typical renter profile here, and what's been the actual vacancy rate?
- The area grade is low — what's the realistic commute time and amenity access for the typical tenant pool here? Any planned neighborhood developments (good or bad) we should know about?
- What's the average days-on-market for RENTAL listings here right now (not sales)? A rising rental-DOM trend means longer vacancies and softer asking-rent achievability than the comps imply.
- What's the recent tenant-quality profile in this submarket — average credit score on applications, eviction rate, late-payment / NSF rate, and stable-employment percentage? A property-management company in the area should have these aggregated.
- How much new for-sale + rental construction is in the pipeline within 1–3 miles? Heavy new supply typically softens prices + rents 12–24 months out; constrained supply supports both.
Investment metrics
- 1% rule
- 0.91% ✗
- Cap rate
- 4.90%
- Cash-on-cash
- -4.97%
- DSCR
- 0.78
- GRM
- 9.2
CMA / ARV
No comps found within radius.
Projected returns pro-forma
-3.0% appreciation · 2.93% rent growth · sell at horizon
- IRR
- -24.7%
- Equity multiple
- 0.16×
- Total profit
- $-48,295
- Equity at exit
- $30,566
- IRR
- -20.2%
- Equity multiple
- -0.07×
- Total profit
- $-61,260
- Equity at exit
- $17,725
Cash invested: $57,400 (down + closing). Projections, not guarantees.
Landlord ↔ Tenant lean methodology
- Overall (STATE)
- 87 Strongly Landlord-Friendly
- State Texas
- 87 Strongly Landlord-Friendly · R+5
- County
- — inherits STATE
- City
- — inherits STATE
ZIP-level market 79928
- Home prices YoY
- -16.9%
- Rents YoY
- 2.9%
- Active inventory
- 2098
- Price-to-rent
- 9.2×
Monthly cashflow live
- Estimated rent
- $1,861 high interval (Pro) →
- Mortgage (P&I)
- −$1,075
- Tax from tax record
- −$548 /mo · $6,574/yr
- Insurance
- −$85
- HOA
- −$0
- Vacancy / Maint / Mgmt
- −$391
- Net cashflow
- $-238
Break-even live
Sensitivity live
| Price | -10% $-122 | -5% $-180 | +0% $-238 | +5% $-296 | +10% $-354 |
|---|---|---|---|---|---|
| Rent | -10% $-385 | -5% $-311 | +0% $-238 | +5% $-164 | +10% $-91 |
| Rate | -1.0pp $-135 | -0.5pp $-186 | base $-238 | +0.5pp $-291 | +1.0pp $-345 |
UW: 25.0% down · 7.5% · 30yr · 1.5% tax · 5.0% vac · 8.0% maint · 8.0% mgmt
Financing live
Cash to close
- Down payment
- $51,250
- Closing costs
- $6,150
- Reserves months
- —
- Total cash needed
- —
Loan-product check · same deal, 3 products live
Conventional
25% down · 7.5% · 30yr
- Down + closing
- —
- Monthly P&I
- —
- Monthly cashflow
- —
- DSCR
- —
- Eligible?
- —
Personal DTI + credit; lowest rate.
DSCR
20% down · 8.5% · 30yr
- Down + closing
- —
- Monthly P&I
- —
- Monthly cashflow
- —
- DSCR
- —
- Eligible?
- —
No personal income docs; deal must DSCR.
Hard money
10% down · 12.0% · 12mo
- Down + closing
- —
- Monthly P&I
- —
- Monthly cashflow
- —
- DSCR
- —
- Eligible?
- —
Short-term bridge; refi at stabilization.
Rent comps 17 comps
| Address | Beds | Baths | Sqft | Rent | $/sqft | DOM | Units | Dist |
|---|---|---|---|---|---|---|---|---|
| 14044 Peter Noyes Dr El Paso, TX | 4.0 | 2.0 | 1594 | $1,650 | $1.04 | 5d | 1 | 0.10mi |
| 304 Jim Hofher Pl El Paso, TX | 4.0 | 2.0 | 1466 | $1,600 | $1.09 | 5d | 1 | 0.10mi |
| 305 De Palma Pl El Paso, TX | 4.0 | 2.0 | 1467 | $1,635 | $1.11 | 45d | 1 | 0.12mi |
| 424 Cutler Pl Horizon City, TX | 3.0 | 2.0 | 1874 | $1,895 | $1.01 | 4d | 1 | 0.51mi |
| 14321 Bill Lazor Pkwy El Paso, TX | 3.0 | 2.0 | 1164 | $1,925 | $1.65 | 45d | 1 | 0.60mi |
| 15006 Nunda Dr Unit B Horizon City, TX | 3.0 | 2.0 | 1120 | $1,250 | $1.12 | 25d | 1 | 0.69mi |
| 14364 Nick Drahos Ln El Paso, TX | 3.0 | 2.0 | 1066 | $1,700 | $1.59 | 13d | 1 | 0.73mi |
| 14324 Desert Shadow Dr Horizon City, TX | 3.0 | 2.0 | 1250 | $1,600 | $1.28 | 16d | 1 | 0.92mi |
| 13745 Lago Vista Ave El Paso, TX | 4.0 | 3.0 | 1687 | $1,850 | $1.10 | 4d | 1 | 1.03mi |
| 732 Desert Sage Dr Horizon City, TX | 4.0 | 2.0 | 1420 | $1,635 | $1.15 | 12d | 1 | 1.08mi |
| 732 Desert Sage Dr Horizon City, TX | 4.0 | 2.0 | 1420 | $1,635 | $1.15 | 4d | 1 | 1.08mi |
| 14496 Cabana Dr Horizon City, TX | 3.0 | 2.0 | 1120 | $1,475 | $1.32 | 45d | 1 | 1.09mi |
| 456 Von Bargen Dr Horizon City, TX | 3.0 | 2.0 | 1120 | $1,300 | $1.16 | 16d | 1 | 1.16mi |
| 644 Paseo Dulce Ave El Paso, TX | 4.0 | 2.0 | 1509 | $2,200 | $1.46 | 45d | 1 | 1.16mi |
| 544 Cedarwood Ave El Paso, TX | 3.0 | 2.0 | 1523 | $1,795 | $1.18 | 45d | 1 | 1.18mi |
| 656 Orchid Dr Horizon City, TX | 3.0 | 2.0 | 1092 | $1,350 | $1.24 | 25d | 1 | 1.49mi |
| 840 Paseo Dulce Ave El Paso, TX | 4.0 | 2.0 | 1600 | $1,800 | $1.12 | 45d | 1 | 1.49mi |
Listing history 2 events
-
2026-06-22remarks 699-char remark
-
2026-06-22$205,000 Active 2 DOM
ⓘ Source: listings_history table (triggers on properties + properties_extension) + one-shot
backfill from property_details.listing_events for pre-trigger history.
Tax reassessment forecast TX · Resets to sale price
- Current annual tax
- $6,574 · $548/mo
- Projected year-2 tax
- $6,574 · $548/mo
- Expected delta
- $0/yr ($0/mo · 0.0%)
ⓘ Screening estimate from a state-policy table — verify with the county assessor before closing.
Climate risk First Street
- Flood 1/10 Low FEMA zone X · 0% chance over 30 yrs
- Wildfire 3/10 Moderate
- Heat 6/10 Major 7 d/yr ≥100°F today · 25 d/yr by 30 yrs out
- Wind 1/10 Low
- Air quality 3/10 Moderate 2 unhealthy d/yr today · 2 by 30 yrs out
Nearby sold comps map
Loading sold comps map…
Walkable amenities ~0.75 mi
Loading nearby amenities…
Taxation est. · year 1
- Rental income
- $22,335
- − Mortgage interest
- −$11,483
- − Property taxes
- −$6,574
- − Insurance
- −$1,025
- − Repairs & maintenance
- −$1,787
- − Management
- −$1,787
- − Depreciation
- −$5,964
- Taxable loss
- −$6,284
- Est. tax savings @ 24.0%
- +$1,508
- After-tax cash flow
- $-1,347/yr
For passive investors: Depreciation is non-cash, so a rental often shows a tax loss while cash-flowing — sheltering income. Rental losses are passive: they offset passive income freely, and up to $25,000/yr can offset ordinary (W-2) income if you actively participate and your MAGI is under $100k (phasing out to $0 by $150k); unused losses carry forward. On sale, claimed depreciation is recaptured at up to 25%, and gains may owe capital-gains tax (a 1031 exchange can defer both). Figures are a year-1 estimate at your 24.0% rate — not tax advice; consult a CPA.
Schools (NCES district)
- District
- Clint ISD
- NCES district ID
- 4814430
- Math proficiency
- 14% ▼ -32.00%
- Reading proficiency
- 22% ▼ -15.00%
- Median HH income
- $37,490
- Composite
- 15.03/100
- National rank
- #9356
- State rank
- #792 of 826 in TX
Livability — Horizon City
- Score
- 66/100
- State rank
- #619
- US rank
- #11815
Category grades
Schools grade is shown separately in the Schools card above.
Census & demographics
- Census place
- Horizon City, TX
- County
- El Paso County · 761,266 people
- City population
- 86,599
- Metro
- El Paso, TX
- Population (ZIP)
- 86,599
- Household income
- $76,643
- Rent vs Own
- Severe rent burden
- 838.0
Population outlook (El Paso County) Hauer SSP2
- Today (2025)
- 897,899 people
- By 2030
- 922,694 · +2.8%
- By 2040
- 960,492 · +7.0%
- By 2050
- 982,919 · +9.5%
- By 2075
- 997,266 · +11.1%
- By 2100
- 900,630 · +0.3%
Race, ethnicity, and origin ACS 2023
- Neighborhood character
- Predominantly Hispanic (89%)
- Race & ethnicity
- Hispanic / Latino 89% Two or more races 39% White 7% Black 2% Native American 2%
- Hispanic origin (detail)
- Mexican 84%
- Foreign-born
- 23% · Canada
- Languages at home
- 25% English-only · Spanish 74% Other Asian/Pacific 1%
Political lean MEDSL · El Paso
- 2024 margin
- D (+15.1) · D 57.0% · R 41.8% · Other 1.2%
- 2008→2024 swing
- -17.4pp toward R · 2008: 32.5pp · 2024: 15.1pp
- All cycles
- 2024: D+15.1 2020: D+35.1 2016: D+43.2 2012: D+32.6 2008: D+32.5
Not yet ingested
- Civics
- —
Market trends
- HPI YoY
- ▼ -40.72%
- Current HPI
- 200.6454
- Rent YoY
- ▲ 2.93%
- Metro
- El Paso, TX
- State GDP YoY
- ▲ 3.95%
- F500 in state
- 110
Industry mix (Fortune 500 HQ in TX)
| Industry | F500 HQs | Revenue |
|---|---|---|
| Energy | 16 | $1,198B |
|
||
| Technology | 5 | $198B |
|
||
| Engineering / Construction | 4 | $72B |
|
||
| Energy Services | 3 | $60B |
|
||
| Utilities | 3 | $41B |
|
||
| Healthcare | 2 | $330B |
|
||
Price history
+81.4% since first listed14 events — show timeline
- 2026-06-19 Listed $205,000 GEPARMLS
- 2024-11-04 Listing Removed — GEPARMLS
- 2024-10-22 Price Changed $196,999 GEPARMLS
- 2024-09-26 Listed $199,999 GEPARMLS
- 2021-08-06 Pending — GEPARMLS
- 2021-07-22 Relisted — GEPARMLS
- 2021-06-14 Pending — GEPARMLS
- 2021-06-02 Listed $154,950 GEPARMLS
- 2018-12-07 Listing Removed — GEPARMLS
- 2018-12-06 Listing Removed — GEPARMLS
- 2009-08-24 Sold (Public Records) — Public Records
- 2009-08-04 Listed $107,500 GEPARMLS
- 2009-06-16 Listed $109,900 GEPARMLS
- 2008-10-30 Listed $113,000 GEPARMLS
Property tax history
+7.5%/yrLatest (2025): $6,574 · -2.6% YoY. Source: county tax records.
Cash-flow waterfall
monthlySold comps — $/sqft
last 12 mo · ≤1 miLoading sold comps…