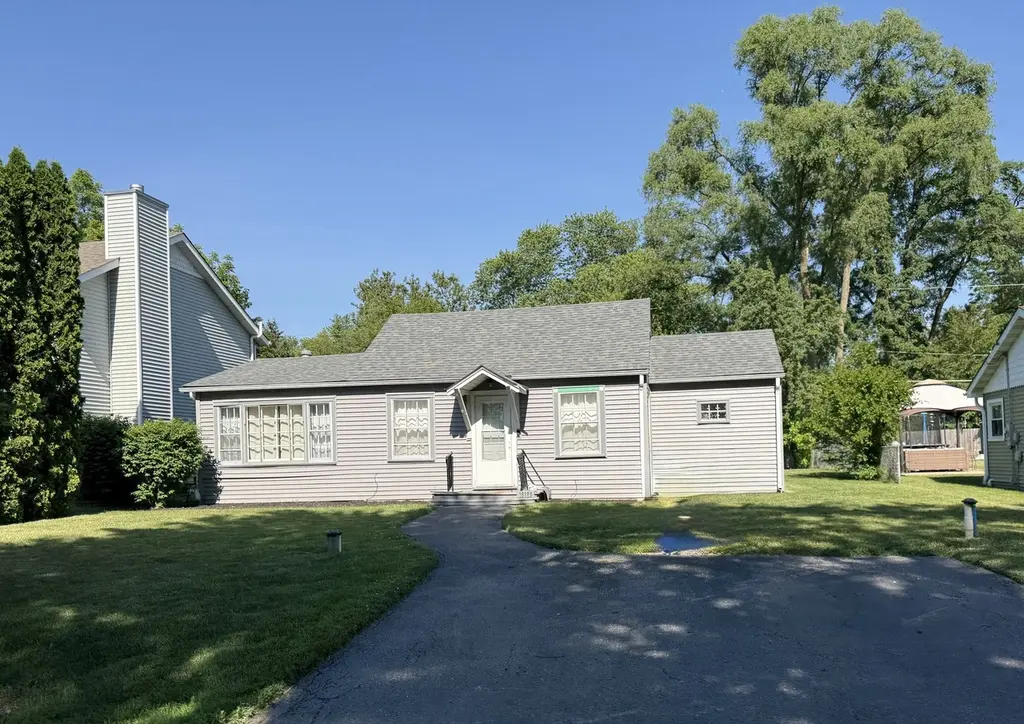
36889 N Oakwood Dr · Venetian Village, IL
Flood risk No data
- FEMA flood zone
- —
- Chance of flooding over 30 yrs
- —
- Est. flood insurance / yr
- —
Fire risk No data
- Est. fire insurance / yr
- —
Heat risk No data
- Hot days now (above threshold)
- —
- Hot days in 30 yrs
- —
Wind risk No data
- Chance of severe wind over 30 yrs
- —
Air-quality risk No data
- Unhealthy air days now
- —
- Unhealthy air days in 30 yrs
- —
Risk factors via First Street. Map © Google.
Why this score? — see what drove the C+ grade
The composite is a weighted blend of 9 inputs, each scored 0–100. Each bar is that input's sub-score; the figure is the points it added to the 100-point composite (weight × sub-score).
- Cash flow +23.1/30.0
- ARV discount +12.1/15.0
- DSCR +7.4/10.0
- 1% rule +6.0/10.0
- Schools +3.9/10.0
- Livability +3.7/5.0
- Rent growth +2.5/5.0
- Condition / age +2.5/5.0
- Appreciation +0.0/10.0
$225,000
🖨 Deal sheet (PDF) 📄 Offer letter ✓ Due diligence
Listing remarks
Adorable 2 bedroom, 1 bath ranch home in Venetian Village. This house offers a large backyard just a few blocks from the lake! The cozy kitchen has stainless steel appliances and opens up to the dining room. New siding and newer roof. Easy living on this private tree lined street! Conveniently located near Walmart, Meijer and many restaurants, shopping will be a breeze. Grayslake North High School
Key facts
- 8,097 sq ft lot
- 2 parking spots
- Built 1945
Property features AI
Finance
- Other: Property not currently leased; Possession at closing
- Financial info: Special service area: No; Homeowner tax exemption indicated
- HOA & community: No master association fee required
Exterior
- Parking: Two parking spaces; Asphalt parking surface; Other parking features
- Security: CO detectors
- Utilities: Well water; Septic tank sewer
- Home design: Detached single-family home; One-story model; Fee simple ownership; Built before 1978 (property age ~81–90 years)
- Construction: Aluminum siding; Asphalt roof; Built ~81–90 years ago
- Exterior features: Lot dimensions approximately 60 x 135; Less than 0.25 acre lot; Water rights (community feature)
Interior
- Kitchen: Range; Refrigerator
- Bedrooms: Master bedroom on main level (15 x 10); Second bedroom on main level (14 x 12); Additional bedrooms listed (types noted)
- Flooring: Laminate flooring throughout (rooms noted with wood laminate); Carpet in living room and bedrooms
- Bathrooms: One full bathroom
- Heating & cooling: Natural gas forced-air heating; Ceiling fan(s)
- Interior features: First-floor full bath; Screens on windows; Unfinished attic; Crawl space basement; 6 total rooms
- Laundry & utility: Laundry on main level (7 x 5)
Neighborhood map
What this means for you Summary
Snapshot
- This is a 3-bed/1.0-bath single-family listed at $225k.
Deal economics
- At list price, monthly cash flow is $405 ($5k/yr) — positive.
- The deal already cash-flows at list — no discount required.
- Meets the 1% rule at list price ($2k rent vs $225k).
Location & tenants
- Location reads 73/100 on livability (#292 in IL) — a middle-class / working-renter tenant base. Strengths: crime A+, cost of living A+, housing A+; Watch: schools D, amenities F, commute F.
- Grayslake Chsd 127 (suburban): math 40% / reading 44% proficiency, ranked #95 of 620 in IL (top 15%) — families likely to look elsewhere, expect single-tenant / working-renter base with shorter leases.
- Market conditions: 85 active listings in the ZIP; 1 comparable units currently listed for rent nearby; high-income renter base; 948 units permitted in Lake County in 2024 (424 in 5+ unit buildings).
Forward outlook
- Local home prices are declining (-3.0%/yr); year-one equity from $2k of loan paydown is wiped out by about $7k of value loss. Plan a longer hold.
- Lake County population projected to shrink 8% by 2050 — rents likely to lag national; underwrite the cash flow, not the appreciation.
Negotiation context
- Only 4 days on market — expect competitive offers; lowballing is unlikely to land.
Risks & watch-outs
- Watch-outs: built in 1945 — expect roof / HVAC / electrical / plumbing capex.
Questions for the listing agent
- Built in 1945 — when were the roof, HVAC, electrical panel, plumbing, and water heater last replaced?
- Is there a deadline driving the sale (1031 exchange, divorce, estate, relocation)? That informs how much negotiation room exists.
- Schools are D-rated, which usually means shorter tenancies and higher turnover. Who's the typical renter profile here, and what's been the actual vacancy rate?
- What's the average days-on-market for RENTAL listings here right now (not sales)? A rising rental-DOM trend means longer vacancies and softer asking-rent achievability than the comps imply.
- What's the recent tenant-quality profile in this submarket — average credit score on applications, eviction rate, late-payment / NSF rate, and stable-employment percentage? A property-management company in the area should have these aggregated.
- How much new for-sale + rental construction is in the pipeline within 1–3 miles? Heavy new supply typically softens prices + rents 12–24 months out; constrained supply supports both.
Investment metrics
- 1% rule
- 1.10% ✓
- Cap rate
- 8.45%
- Cash-on-cash
- 7.71%
- DSCR
- 1.34
- GRM
- 7.6
CMA / ARV
- ARV (on-the-fly)
- $250,472
- Comps found
- 12
Show comp detail 12 sales within ~0.75 mi
| Address | Dist | Beds/Ba | Sqft | Sold | Price | $/sf | Match |
|---|---|---|---|---|---|---|---|
| 21437 W Engle Dr | 0.21mi | 3/1.0 | 1,056 (+1%) | 1mo | $307,000 | $291 | 88 |
| 36866 N Nathan Hale Dr | 0.11mi | 3/1.0 | 1,196 (+14%) | 7mo | $233,000 | $195 | 66 |
| 20862 W Genoa Ave | 0.40mi | 3/1.5 | 1,124 (+7%) | 6mo | $253,000 | $225 | 63 |
| 36912 N Lawrence Dr | 0.59mi | 3/1.0 | 962 (-8%) | 0mo | $230,000 | $239 | 59 |
| 36753 N Corona Dr | 0.56mi | 3/1.5 | 1,004 (-4%) | 9mo | $210,000 | $209 | 57 |
| 21535 W Sarah Dr | 0.33mi | 2/1.0 (-1) | 910 (-13%) | 1mo | $245,000 | $269 | 57 |
| 36911 N Helen Dr | 0.62mi | 3/1.5 | 1,152 (+10%) | 4mo | $360,000 | $313 | 49 |
| 36665 N Mary Dr | 0.72mi | 3/1.0 | 1,000 (-5%) | 13mo | $250,000 | $250 | 48 |
| 36675 N Helen Dr | 0.66mi | 2/1.0 (-1) | 1,088 (+4%) | 14mo | $141,000 | $130 | 46 |
| 36943 N Mary Dr | 0.68mi | 3/1.0 | 976 (-7%) | 14mo | $218,000 | $223 | 45 |
| 36563 N Helen Dr | 0.70mi | 3/2.0 | 1,120 (+7%) | 9mo | $285,000 | $254 | 45 |
| 37416 N Loretto Ave | 0.60mi | 2/1.0 (-1) | 950 (-9%) | 13mo | $95,000 | $100 | 40 |
Match score weights: distance 35% · size 25% · config 20% · recency 20%. Top-matched comps best support the ARV.
Projected returns pro-forma
-3.0% appreciation · 3.0% rent growth · sell at horizon
- IRR
- -4.5%
- Equity multiple
- 0.83×
- Total profit
- $-10,658
- Equity at exit
- $33,548
- IRR
- 5.2%
- Equity multiple
- 1.38×
- Total profit
- $24,047
- Equity at exit
- $19,454
Cash invested: $63,000 (down + closing). Projections, not guarantees.
Landlord ↔ Tenant lean methodology
- Overall (STATE)
- 43 Moderately Tenant-Leaning
- State Illinois
- 43 Moderately Tenant-Leaning · D+7
- County
- — inherits STATE
- City
- — inherits STATE
ZIP-level market 60046
- Active inventory
- 85
- Price-to-rent
- 7.6×
Monthly cashflow live
- Estimated rent
- $2,480 medium interval (Pro) →
- Mortgage (P&I)
- −$1,180
- Tax est. 1.5%
- −$281 /mo · $3,375/yr
- Insurance
- −$94
- HOA
- −$0
- Vacancy / Maint / Mgmt
- −$521
- Net cashflow
- $405
Break-even live
Sensitivity live
| Price | -10% $560 | -5% $482 | +0% $405 | +5% $327 | +10% $249 |
|---|---|---|---|---|---|
| Rent | -10% $209 | -5% $307 | +0% $405 | +5% $502 | +10% $600 |
| Rate | -1.0pp $518 | -0.5pp $462 | base $405 | +0.5pp $346 | +1.0pp $287 |
UW: 25.0% down · 7.5% · 30yr · 1.5% tax · 5.0% vac · 8.0% maint · 8.0% mgmt
Financing live
Cash to close
- Down payment
- $56,250
- Closing costs
- $6,750
- Reserves months
- —
- Total cash needed
- —
Loan-product check · same deal, 3 products live
Conventional
25% down · 7.5% · 30yr
- Down + closing
- —
- Monthly P&I
- —
- Monthly cashflow
- —
- DSCR
- —
- Eligible?
- —
Personal DTI + credit; lowest rate.
DSCR
20% down · 8.5% · 30yr
- Down + closing
- —
- Monthly P&I
- —
- Monthly cashflow
- —
- DSCR
- —
- Eligible?
- —
No personal income docs; deal must DSCR.
Hard money
10% down · 12.0% · 12mo
- Down + closing
- —
- Monthly P&I
- —
- Monthly cashflow
- —
- DSCR
- —
- Eligible?
- —
Short-term bridge; refi at stabilization.
Rent comps 1 comps
| Address | Beds | Baths | Sqft | Rent | $/sqft | DOM | Units | Dist |
|---|---|---|---|---|---|---|---|---|
| 851 Sanctuary Dr Lake Villa, IL | 2.0 | 1.0–2.0 | 1218 | $2,010 | $1.65 | 0d | 4 | 1.20mi |
Listing history 12 events
-
2026-06-21days on market $225,000 Active 4 DOM
-
2026-06-17remarks 400-char remark
-
2026-06-17statusdays on market $225,000 Active 1 DOM
-
2026-06-17days on market $225,000 Coming Soon 13 DOM
-
2026-06-16days on market $225,000 Coming Soon 12 DOM
-
2026-06-15days on market $225,000 Coming Soon 11 DOM
-
2026-06-13days on market $225,000 Coming Soon 9 DOM
-
2026-06-13days on market $225,000 Coming Soon 8 DOM
-
2026-06-09days on market $225,000 Coming Soon 5 DOM
-
2026-06-08days on market $225,000 Coming Soon 4 DOM
-
2026-06-07remarks 62-char remark
-
2026-06-07$225,000 Coming Soon 3 DOM
ⓘ Source: listings_history table (triggers on properties + properties_extension) + one-shot
backfill from property_details.listing_events for pre-trigger history.
Nearby sold comps map
Loading sold comps map…
Walkable amenities ~0.75 mi
Loading nearby amenities…
Taxation est. · year 1
- Rental income
- $29,764
- − Mortgage interest
- −$12,603
- − Property taxes
- −$3,375
- − Insurance
- −$1,125
- − Repairs & maintenance
- −$2,381
- − Management
- −$2,381
- − Depreciation
- −$6,545
- Taxable income
- $1,353
- Est. tax owed @ 24.0%
- −$325
- After-tax cash flow
- $4,530/yr
For passive investors: Depreciation is non-cash, so a rental often shows a tax loss while cash-flowing — sheltering income. Rental losses are passive: they offset passive income freely, and up to $25,000/yr can offset ordinary (W-2) income if you actively participate and your MAGI is under $100k (phasing out to $0 by $150k); unused losses carry forward. On sale, claimed depreciation is recaptured at up to 25%, and gains may owe capital-gains tax (a 1031 exchange can defer both). Figures are a year-1 estimate at your 24.0% rate — not tax advice; consult a CPA.
Schools (NCES district)
- District
- Grayslake Chsd 127
- NCES district ID
- 1717550
- Math proficiency
- 40% ▼ -7.00%
- Reading proficiency
- 44% ▼ -9.00%
- Median HH income
- $84,295
- Composite
- 39.42/100
- National rank
- #3963
- State rank
- #95 of 620 in IL
Livability — Venetian Village
- Score
- 73/100
- State rank
- #292
- US rank
- #5569
Category grades
Schools grade is shown separately in the Schools card above.
Census & demographics
- Census place
- Venetian Village, IL
- County
- Lake County · 591,991 people
- Metro
- Chicago-Naperville-Elgin, IL-IN-WI
- Population (ZIP)
- 34,613
- Household income
- $126,042
- Rent vs Own
- Severe rent burden
- 282.0
Population outlook (Lake County) Hauer SSP2
- Today (2025)
- 700,217 people
- By 2030
- 693,290 · -1.0%
- By 2040
- 673,588 · -3.8%
- By 2050
- 643,556 · -8.1%
- By 2075
- 562,792 · -19.6%
- By 2100
- 457,715 · -34.6%
Race, ethnicity, and origin ACS 2023
- Neighborhood character
- Predominantly White (70%)
- Race & ethnicity
- White 70% Hispanic / Latino 17% Two or more races 9% Asian 6% Black 4%
- Hispanic origin (detail)
- Mexican 12% Puerto Rican 2%
- Common ancestry
- Romanian 13% Portuguese 2% Lithuanian 2%
- Foreign-born
- 13% · Canada, South Korea, Vietnam
- Languages at home
- 80% English-only · Spanish 11% Russian/Polish/Slavic 3% Other Asian/Pacific 1%
Political lean MEDSL · Lake
- 2024 margin
- Strong D (+20.8) · D 59.7% · R 38.9% · Other 1.4%
- 2008→2024 swing
- +1.1pp toward D · 2008: 19.6pp · 2024: 20.8pp
- All cycles
- 2024: D+20.8 2020: D+24.1 2016: D+20.3 2012: D+8.1 2008: D+19.6
Not yet ingested
- Civics
- —
Market trends
- HPI YoY
- ▼ -137.45%
- Current HPI
- 202.1374
- Rent YoY
- —
- Metro
- Chicago-Naperville-Elgin, IL-IN-WI
- State GDP YoY
- ▲ 1.59%
- F500 in state
- 60
Industry mix (Fortune 500 HQ in IL)
| Industry | F500 HQs | Revenue |
|---|---|---|
| Insurance | 4 | $201B |
|
||
| Consumer Goods | 4 | $87B |
|
||
| Industrial Machinery | 3 | $64B |
|
||
| Healthcare | 2 | $55B |
|
||
| Retail / Pharmacy | 1 | $148B |
|
||
| Agriculture / Food | 1 | $86B |
|
||
Cash-flow waterfall
monthlySold comps — $/sqft
last 12 mo · ≤1 miLoading sold comps…