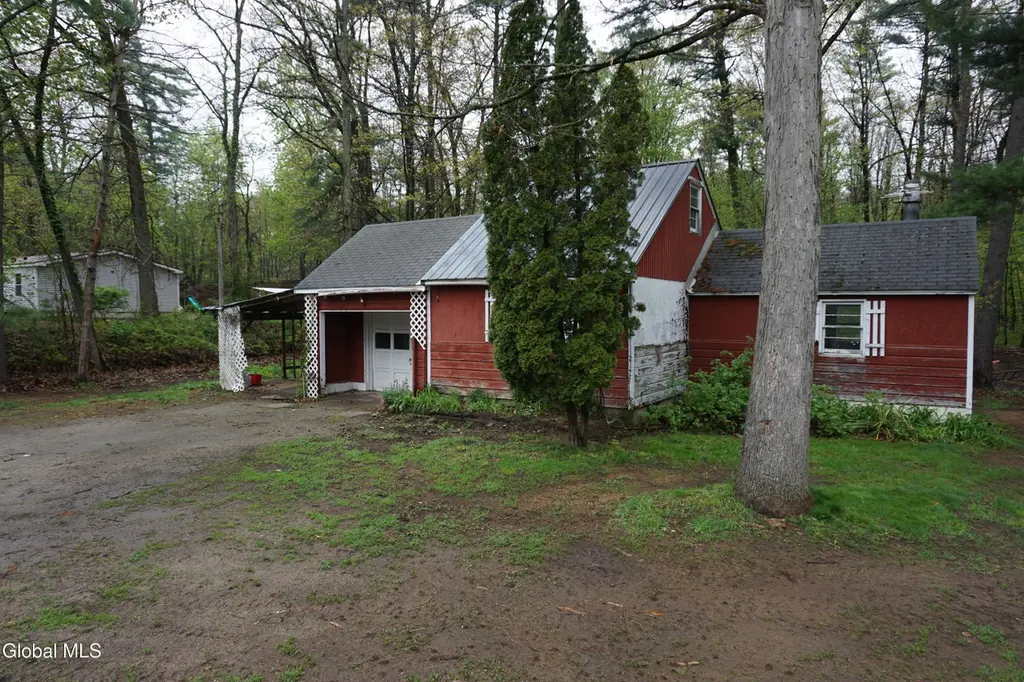
8 Scout Rd · Saratoga Springs, NY
Flood risk 1/10 · Minimal
- FEMA flood zone
- —
- Chance of flooding over 30 yrs
- 0.0%
- Est. flood insurance / yr
- —
Fire risk 5/10 · Moderate
- Est. fire insurance / yr
- $691 – $1,283
Heat risk 3/10 · Minor
- Hot days now (above 97°F)
- 7 days/yr
- Hot days in 30 yrs
- 16 days/yr
Wind risk 2/10 · Minimal
- Chance of severe wind over 30 yrs
- 4.0%
Air-quality risk 1/10 · Minimal
- Unhealthy air days now
- 0 days/yr
- Unhealthy air days in 30 yrs
- 0 days/yr
Risk factors via First Street. Map © Google.
Why this score? — see what drove the B grade
The composite is a weighted blend of 9 inputs, each scored 0–100. Each bar is that input's sub-score; the figure is the points it added to the 100-point composite (weight × sub-score).
- Cash flow +30.0/30.0
- 1% rule +10.0/10.0
- DSCR +10.0/10.0
- ARV discount +7.5/15.0
- Schools +5.4/10.0
- Livability +4.1/5.0
- Rent growth +2.5/5.0
- Condition / age +2.5/5.0
- Appreciation +0.0/10.0
$89,000
🖨 Deal sheet (PDF) 📄 Offer letter ✓ Due diligence
Listing remarks
Great Location! Bring your hammer and saw. Complete rehab needed or tear down and build new. This cottage offers an affordable living option. Beautiful wooded lot with mature trees. Easy access to exit 16 and Saratoga Springs. Well and septic info are unknown. As is sale.
Key facts
- Wooded lot
- Saratoga springs
- Mature trees
Tags
Property features AI
Finance
- Other: Lot approximately 0.52 acre (dimensions ~152 x 148 x 151 x 150)
- Financial info: Tax annual amount: $1,700
Exterior
- Parking: Has a garage with 1 garage space; Total of 4 parking spaces; Off-street parking and driveway
- Utilities: 100 Amp electric service; Cable available; Sewer: unknown
- Home design: Single family residence; Fixer condition; Combination foundation
- Construction: Wood siding construction; Metal and asphalt roofing
- Exterior features: Level, private and wooded lot; Yard includes shed(s)
Interior
- Kitchen: Kitchen on the first level
- Bedrooms: Bedroom located on second level; Loft on second level (flex space/loft)
- Flooring: Vinyl flooring; Wood flooring
- Bathrooms: One full bathroom on the first level
- Heating & cooling: Radiant heat; Wood-burning heat source
- Interior features: Six total rooms; Crawl space basement
Neighborhood map
What this means for you Summary
Snapshot
- This is a 2-bed/1.0-bath single-family listed at $89k.
Deal economics
- At list price, monthly cash flow is $1k ($13k/yr) — positive.
- The deal already cash-flows at list — no discount required.
- Meets the 1% rule at list price ($2k rent vs $89k).
- Recommended offer: $88k (1.5% below list) — sets the bar for market timing.
- Cap rate 20.4% vs local median 2.0% in Saratoga Springs — top-decile yield for the area; either an underpriced asset or a hidden risk that comps aren't pricing in. Stress-test before assuming the spread holds.
Location & tenants
- Location reads 82/100 on livability (#83 in NY, #1,284 nationally) — a professional / high-income tenant draw. Strengths: employment A+, housing A+, health & safety A; Watch: amenities D+, cost of living F.
- Schuylerville Central School District (rural): math 58% / reading 64% proficiency, ranked #201 of 590 in NY (top 34%) — acceptable for families but not a draw, mixed tenant base, ~2y average lease; only 19% free/reduced lunch — higher-income household profile.
- Zoned schools: Schuylerville Elementary School (math 60% / reading 66%, grade B, #669 of 2,108 statewide, top 32%, 597 students, 36% FRL); Schuylerville High School (math 92% / reading 70%, grade A, #495 of 1,100 statewide, top 46%, 482 students, 29% FRL).
- Market conditions: 113 active listings in the ZIP; solid renter incomes; 1,132 units permitted in Saratoga County in 2024 (378 in 5+ unit buildings).
Forward outlook
- Local home prices are declining (-3.0%/yr); year-one equity from $615 of loan paydown is wiped out by about $3k of value loss. Plan a longer hold.
- Saratoga County population projected at +4% by 2050 — modest demand growth; plan on rents tracking national, not racing it.
- At projected returns (-3.0% appreciation + 3.0% rent growth), your $25k cash investment doubles in ~3 years — after that, you're playing with house money.
Negotiation context
- It's been on market 19 days — a 2% lower offer ($88k) is reasonable based on typical stale-listing flexibility.
- Current owner paid $70k; 27% above their basis — modest negotiation headroom, anchor on the comps not their cost.
Risks & watch-outs
- Watch-outs: built in 1945 — expect roof / HVAC / electrical / plumbing capex.
- Climate carrying-cost: moderate wildfire risk — expect insurance premiums to compound above CPI over the hold.
Questions for the listing agent
- Built in 1945 — when were the roof, HVAC, electrical panel, plumbing, and water heater last replaced?
- Is there a deadline driving the sale (1031 exchange, divorce, estate, relocation)? That informs how much negotiation room exists.
- Schools are A-rated — typically a magnet for longer-tenancy family renters. What's the average tenant stay here, and is there a school-zone premium baked into asking?
- What's the average days-on-market for RENTAL listings here right now (not sales)? A rising rental-DOM trend means longer vacancies and softer asking-rent achievability than the comps imply.
- What's the recent tenant-quality profile in this submarket — average credit score on applications, eviction rate, late-payment / NSF rate, and stable-employment percentage? A property-management company in the area should have these aggregated.
- How much new for-sale + rental construction is in the pipeline within 1–3 miles? Heavy new supply typically softens prices + rents 12–24 months out; constrained supply supports both.
Investment metrics
- 1% rule
- 2.41% ✓
- Cap rate
- 20.43%
- Cash-on-cash
- 50.49%
- DSCR
- 3.25
- GRM
- 3.5
CMA / ARV
No comps found within radius.
Projected returns pro-forma
-3.0% appreciation · 3.0% rent growth · sell at horizon
- IRR
- 48.3%
- Equity multiple
- 3.10×
- Total profit
- $52,403
- Equity at exit
- $13,270
- IRR
- 53.9%
- Equity multiple
- 6.29×
- Total profit
- $131,822
- Equity at exit
- $7,695
Cash invested: $24,920 (down + closing). Projections, not guarantees.
Landlord ↔ Tenant lean methodology
- Overall (STATE)
- 15 Strongly Tenant-Friendly
- State New York
- 15 Strongly Tenant-Friendly · D+10
- County
- — inherits STATE
- City
- — inherits STATE
ZIP-level market 12831
- Home prices YoY
- -12.8%
- Active inventory
- 113
- Price-to-rent
- 3.5×
Monthly cashflow live
- Estimated rent
- $2,145 medium interval (Pro) →
- Mortgage (P&I)
- −$467
- Tax from tax record
- −$142 /mo · $1,704/yr
- Insurance
- −$37
- HOA
- −$0
- Vacancy / Maint / Mgmt
- −$450
- Net cashflow
- $1,048
Break-even live
Sensitivity live
| Price | -10% $1,099 | -5% $1,074 | +0% $1,048 | +5% $1,023 | +10% $998 |
|---|---|---|---|---|---|
| Rent | -10% $879 | -5% $964 | +0% $1,048 | +5% $1,133 | +10% $1,218 |
| Rate | -1.0pp $1,093 | -0.5pp $1,071 | base $1,048 | +0.5pp $1,025 | +1.0pp $1,002 |
UW: 25.0% down · 7.5% · 30yr · 1.5% tax · 5.0% vac · 8.0% maint · 8.0% mgmt
Financing live
Cash to close
- Down payment
- $22,250
- Closing costs
- $2,670
- Reserves months
- —
- Total cash needed
- —
Loan-product check · same deal, 3 products live
Conventional
25% down · 7.5% · 30yr
- Down + closing
- —
- Monthly P&I
- —
- Monthly cashflow
- —
- DSCR
- —
- Eligible?
- —
Personal DTI + credit; lowest rate.
DSCR
20% down · 8.5% · 30yr
- Down + closing
- —
- Monthly P&I
- —
- Monthly cashflow
- —
- DSCR
- —
- Eligible?
- —
No personal income docs; deal must DSCR.
Hard money
10% down · 12.0% · 12mo
- Down + closing
- —
- Monthly P&I
- —
- Monthly cashflow
- —
- DSCR
- —
- Eligible?
- —
Short-term bridge; refi at stabilization.
Listing history 12 events
-
2026-06-18days on market $89,000 Active 19 DOM
-
2026-06-17days on market $89,000 Active 18 DOM
-
2026-06-16days on market $89,000 Active 17 DOM
-
2026-06-15days on market $89,000 Active 16 DOM
-
2026-06-14days on market $89,000 Active 14 DOM
-
2026-06-10days on market $89,000 Active 11 DOM
-
2026-06-09days on market $89,000 Active 10 DOM
-
2026-06-08days on market $89,000 Active 9 DOM
-
2026-06-07days on market $89,000 Active 8 DOM
-
2026-06-05status $89,000 Active 5 DOM
-
2026-05-18$89,000 Active
-
2017-05-03soldstatus $70,000
ⓘ Source: listings_history table (triggers on properties + properties_extension) + one-shot
backfill from property_details.listing_events for pre-trigger history.
Tax reassessment forecast NY · Partial reset (capped growth)
- Current annual tax
- $1,704 · $142/mo
- Projected year-2 tax
- $1,704 · $142/mo
- Expected delta
- $0/yr ($0/mo · 0.0%)
ⓘ Screening estimate from a state-policy table — verify with the county assessor before closing.
Climate risk First Street
- Flood 1/10 Low 0% chance over 30 yrs
- Wildfire 5/10 Major
- Heat 3/10 Moderate 7 d/yr ≥97°F today · 16 d/yr by 30 yrs out
- Wind 2/10 Low 4% chance of damaging wind over 30 yrs
- Air quality 1/10 Low 0 unhealthy d/yr today · 0 by 30 yrs out
Nearby sold comps map
Loading sold comps map…
Walkable amenities ~0.75 mi
Loading nearby amenities…
Taxation est. · year 1
- Rental income
- $25,735
- − Mortgage interest
- −$4,985
- − Property taxes
- −$1,704
- − Insurance
- −$445
- − Repairs & maintenance
- −$2,059
- − Management
- −$2,059
- − Depreciation
- −$2,589
- Taxable income
- $11,894
- Est. tax owed @ 24.0%
- −$2,855
- After-tax cash flow
- $9,726/yr
For passive investors: Depreciation is non-cash, so a rental often shows a tax loss while cash-flowing — sheltering income. Rental losses are passive: they offset passive income freely, and up to $25,000/yr can offset ordinary (W-2) income if you actively participate and your MAGI is under $100k (phasing out to $0 by $150k); unused losses carry forward. On sale, claimed depreciation is recaptured at up to 25%, and gains may owe capital-gains tax (a 1031 exchange can defer both). Figures are a year-1 estimate at your 24.0% rate — not tax advice; consult a CPA.
Schools (NCES district)
- District
- Schuylerville Central School District
- NCES district ID
- 3626160
- Math proficiency
- 58% ▼ -8.00%
- Reading proficiency
- 64% ▲ 6.00%
- Median HH income
- $69,011
- Composite
- 53.71/100
- National rank
- #1423
- State rank
- #201 of 590 in NY
Livability — Saratoga Springs
- Score
- 82/100
- State rank
- #83
- US rank
- #1284
Category grades
Schools grade is shown separately in the Schools card above.
Census & demographics
- County
- Saratoga County · 166,192 people
- City population
- 40,057
- Metro
- Albany-Schenectady-Troy, NY
- Population (ZIP)
- 18,025
- Household income
- $100,024
- Rent vs Own
- Severe rent burden
- 497.0
Population outlook (Saratoga County) Hauer SSP2
- Today (2025)
- 238,889 people
- By 2030
- 243,681 · +2.0%
- By 2040
- 249,118 · +4.3%
- By 2050
- 248,638 · +4.1%
- By 2075
- 241,675 · +1.2%
- By 2100
- 213,150 · -10.8%
Race, ethnicity, and origin ACS 2023
- Neighborhood character
- Predominantly White (92%)
- Race & ethnicity
- White 92% Hispanic / Latino 3% Two or more races 3% Asian 1%
- Common ancestry
- Lithuanian 11% Romanian 4% Iranian 2%
- Foreign-born
- 3% · Canada
- Languages at home
- 95% English-only · Spanish 2% Russian/Polish/Slavic 1% Other Indo-European 1%
Political lean MEDSL · Saratoga
- 2024 margin
- Toss-up / Even · D 50.9% · R 49.1%
- 2008→2024 swing
- -1.6pp toward R · 2008: 3.4pp · 2024: 1.8pp
- All cycles
- 2024: D+1.8 2020: D+5.4 2016: R+4.4 2012: D+2.1 2008: D+3.4
Not yet ingested
- Civics
- —
Market trends
- HPI YoY
- ▼ -51.79%
- Current HPI
- 351.6972
- Rent YoY
- —
- Metro
- Albany-Schenectady-Troy, NY
- State GDP YoY
- ▲ 2.60%
- F500 in state
- 92
Industry mix (Fortune 500 HQ in NY)
| Industry | F500 HQs | Revenue |
|---|---|---|
| Financial Services | 10 | $950B |
|
||
| Consumer Goods | 9 | $162B |
|
||
| Insurance | 4 | $225B |
|
||
| Telecommunications | 2 | $144B |
|
||
| Pharmaceuticals | 2 | $112B |
|
||
| Media / Entertainment | 2 | $69B |
|
||
Price history
+27.1% since first listed2 events — show timeline
- 2026-05-18 Listed $89,000 Global MLS
- 2017-05-03 Sold (Public Records) $70,000 Public Records
Property tax history
+11.2%/yrLatest (2025): $1,704 · +1.4% YoY. Source: county tax records.
Cash-flow waterfall
monthlySold comps — $/sqft
last 12 mo · ≤1 miLoading sold comps…