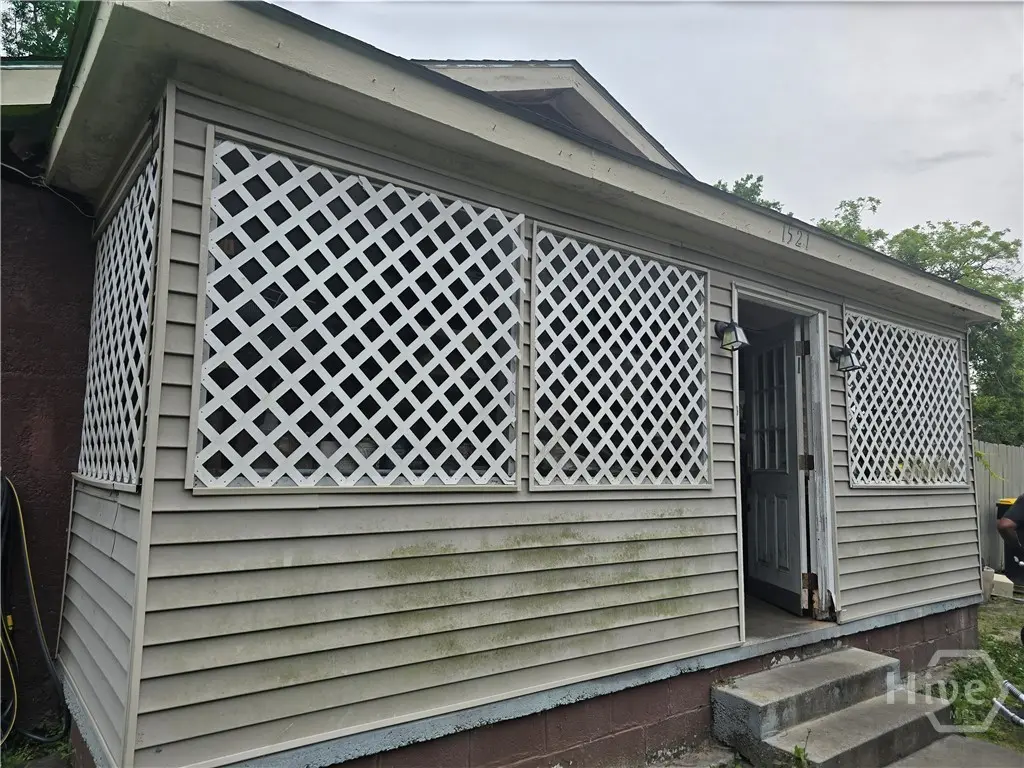
1521 New Castle St · Savannah, GA
Flood risk 3/10 · Minor
- FEMA flood zone
- X (unshaded)
- Chance of flooding over 30 yrs
- 0.2%
- Est. flood insurance / yr
- $507 – $1,088
Fire risk 3/10 · Minor
- Est. fire insurance / yr
- $963 – $1,789
Heat risk 9/10 · Severe
- Hot days now (above 109°F)
- 7 days/yr
- Hot days in 30 yrs
- 18 days/yr
Wind risk 9/10 · Severe
- Chance of severe wind over 30 yrs
- 99.0%
Air-quality risk 5/10 · Moderate
- Unhealthy air days now
- 7 days/yr
- Unhealthy air days in 30 yrs
- 8 days/yr
Risk factors via First Street. Map © Google.
Why this score? — see what drove the B- grade
The composite is a weighted blend of 9 inputs, each scored 0–100. Each bar is that input's sub-score; the figure is the points it added to the 100-point composite (weight × sub-score).
- Cash flow +30.0/30.0
- 1% rule +10.0/10.0
- DSCR +10.0/10.0
- ARV discount +7.5/15.0
- Livability +4.3/5.0
- Rent growth +2.5/5.0
- Condition / age +2.5/5.0
- Schools +2.0/10.0
- Appreciation +0.0/10.0
$60,000
🖨 Deal sheet 📄 Offer letter ✓ Due diligence
Listing remarks
Serious investors and savvy buyers, this is the opportunity you've been waiting for. This 3-bedroom, 1-bath home sits just minutes from the Georgia Ports Authority, the vibrant energy of Downtown Savannah, and the iconic charm of River Street one of the most desirable corridors in the city. The enclosed screen porch is perfect for enjoying Savannah's beautiful seasons, while the fully fenced yard offers privacy, space, and endless possibilities. The home needs work and is priced accordingly, making it a fantastic chance to flip, rent, or renovate into your dream home — the bones are here and the location is unbeatable. Whether you're looking to build instant equity or plant roots in o
Key facts
- 2,831 sq ft lot
- Built 1947
Neighborhood map
What this means for you Summary
Snapshot
- This is a 3-bed/1.0-bath single-family listed at $60k.
Deal economics
- At list price, monthly cash flow is $970 ($12k/yr) — positive.
- The deal already cash-flows at list — no discount required.
- Meets the 1% rule at list price ($2k rent vs $60k).
- Cap rate 25.7% vs local median 4.0% in Savannah — top-decile yield for the area; either an underpriced asset or a hidden risk that comps aren't pricing in. Stress-test before assuming the spread holds.
Location & tenants
- Location reads 86/100 on livability (#1 in GA, #397 nationally) — a professional / high-income tenant draw. Strengths: crime A+, amenities A+, commute A+; Watch: employment D, schools F.
- Savannah-Chatham County (urban): math 20% / reading 26% proficiency, ranked #134 of 174 in GA (top 77%) — low school quality limits family demand, transient renter base, plan for 1-2y turnover.
- Market conditions: 76 active listings in the ZIP; 25 comparable units currently listed for rent nearby; rentals at typical pace (median 24d on market — plan ~3-4 weeks tenant-placement turnaround); 40% of comp listings sitting > 30 days — soft ceiling on asking rent; lower-income renter base — watch delinquency; 2,694 units permitted in Chatham County in 2024 (973 in 5+ unit buildings).
- At $1,717/mo this rent would consume 56% of the median local household income ($37k/yr) (locally 613% of renters already pay >50% of income on rent) — very limited rent-growth headroom before tenants either downsize or default.
Forward outlook
- Local home prices are declining (-3.0%/yr); year-one equity from $415 of loan paydown is wiped out by about $2k of value loss. Plan a longer hold.
- Chatham County population projected at +33% by 2050 — long-run rental-demand tailwind backs the buy-and-hold thesis.
- At projected returns (-3.0% appreciation + 3.0% rent growth), your $17k cash investment doubles in ~2 years — after that, you're playing with house money.
Negotiation context
- Only 0 days on market — expect competitive offers; lowballing is unlikely to land.
Risks & watch-outs
- Watch-outs: built in 1947 — expect roof / HVAC / electrical / plumbing capex.
- Climate carrying-cost: severe wind risk, 99% chance of damaging wind over 30y; extreme-heat days projected 7→18/yr by 2055 (HVAC capex compounding) — expect insurance premiums to compound above CPI over the hold.
Questions for the listing agent
- Built in 1947 — when were the roof, HVAC, electrical panel, plumbing, and water heater last replaced?
- Is there a deadline driving the sale (1031 exchange, divorce, estate, relocation)? That informs how much negotiation room exists.
- Schools are F-rated, which usually means shorter tenancies and higher turnover. Who's the typical renter profile here, and what's been the actual vacancy rate?
- What's the average days-on-market for RENTAL listings here right now (not sales)? A rising rental-DOM trend means longer vacancies and softer asking-rent achievability than the comps imply.
- What's the recent tenant-quality profile in this submarket — average credit score on applications, eviction rate, late-payment / NSF rate, and stable-employment percentage? A property-management company in the area should have these aggregated.
- How much new for-sale + rental construction is in the pipeline within 1–3 miles? Heavy new supply typically softens prices + rents 12–24 months out; constrained supply supports both.
Investment metrics
- 1% rule
- 2.86% ✓
- Cap rate
- 25.70%
- Cash-on-cash
- 69.32%
- DSCR
- 4.08
- GRM
- 2.9
CMA / ARV
- ARV (on-the-fly)
- $239,800
- Comps found
- 12
Show comp detail 12 sales within ~0.75 mi
| Address | Dist | Beds/Ba | Sqft | Sold | Price | $/sf | Match |
|---|---|---|---|---|---|---|---|
| 1725 Dunn St | 0.29mi | 3/2.0 | 1,180 (+7%) | 2mo | $260,000 | $220 | 69 |
| 275 Scarborough St | 0.46mi | 3/2.0 | 1,120 (+2%) | 4mo | $244,500 | $218 | 68 |
| 207 Cleland Ave | 0.48mi | 3/2.0 | 1,118 (+2%) | 4mo | $140,000 | $125 | 68 |
| 2016 Eppinger St | 0.29mi | 2/2.0 (-1) | 1,018 (-8%) | 1mo | $210,000 | $206 | 64 |
| 8 Newell St | 0.59mi | 3/2.5 | 1,114 (+1%) | 3mo | $265,000 | $238 | 62 |
| 2102 Patch St | 0.32mi | 3/1.0 | 960 (-13%) | 4mo | $115,000 | $120 | 61 |
| 2011 Gugel St | 0.30mi | 2/1.0 (-1) | 960 (-13%) | 4mo | $220,000 | $229 | 57 |
| 17 Nelson St | 0.65mi | 3/2.0 | 1,122 (+2%) | 11mo | $220,000 | $196 | 54 |
| 227 Glass St | 0.53mi | 2/1.0 (-1) | 1,000 (-9%) | 5mo | $299,000 | $299 | 51 |
| 1600 Damon St | 0.56mi | 3/1.0 | 1,224 (+11%) | 6mo | $165,000 | $135 | 50 |
| 2108 Krenson St | 0.65mi | 3/1.0 | 1,224 (+11%) | 9mo | $82,500 | $67 | 43 |
| 4 Bardwell Way | 0.73mi | 3/2.0 | 1,256 (+14%) | 3mo | $289,190 | $230 | 36 |
Match score weights: distance 35% · size 25% · config 20% · recency 20%. Top-matched comps best support the ARV.
Projected returns pro-forma
-3.0% appreciation · 3.0% rent growth · sell at horizon
- IRR
- 68.8%
- Equity multiple
- 4.10×
- Total profit
- $52,093
- Equity at exit
- $8,946
- IRR
- 72.9%
- Equity multiple
- 8.44×
- Total profit
- $124,982
- Equity at exit
- $5,188
Cash invested: $16,800 (down + closing). Projections, not guarantees.
Landlord ↔ Tenant lean methodology
- Overall (STATE)
- 90 Strongly Landlord-Friendly
- State Georgia
- 90 Strongly Landlord-Friendly · R+3
- County
- — inherits STATE
- City
- — inherits STATE
ZIP-level market 31415
- Home prices YoY
- -21.4%
- Active inventory
- 76
- Price-to-rent
- 2.9×
Monthly cashflow live
- Estimated rent
- $1,717 high interval (Pro) →
- Mortgage (P&I)
- −$315
- Tax from tax record
- −$46 /mo · $556/yr
- Insurance
- −$25
- HOA
- −$0
- Vacancy / Maint / Mgmt
- −$361
- Net cashflow
- $970
Break-even live
UW: 25.0% down · 7.5% · 30yr · 1.5% tax · 5.0% vac · 8.0% maint · 8.0% mgmt
Financing live
Cash to close
- Down payment
- $15,000
- Closing costs
- $1,800
- Reserves months
- —
- Total cash needed
- —
Loan-product check · same deal, 3 products live
Conventional
25% down · 7.5% · 30yr
- Down + closing
- —
- Monthly P&I
- —
- Monthly cashflow
- —
- DSCR
- —
- Eligible?
- —
Personal DTI + credit; lowest rate.
DSCR
20% down · 8.5% · 30yr
- Down + closing
- —
- Monthly P&I
- —
- Monthly cashflow
- —
- DSCR
- —
- Eligible?
- —
No personal income docs; deal must DSCR.
Hard money
10% down · 12.0% · 12mo
- Down + closing
- —
- Monthly P&I
- —
- Monthly cashflow
- —
- DSCR
- —
- Eligible?
- —
Short-term bridge; refi at stabilization.
Rent comps 25 comps
| Address | Beds | Baths | Sqft | Rent | $/sqft | DOM | Units | Dist |
|---|---|---|---|---|---|---|---|---|
| 1416 Chester St Savannah, GA | 3.0 | 1.0 | 960 | $1,600 | $1.67 | 23d | 1 | 0.16mi |
| 1402 New Castle St Savannah, GA | 2.0 | 1.0 | 928 | $1,500 | $1.62 | 43d | 1 | 0.17mi |
| 226 Fell St Savannah, GA | 3.0 | 1.0 | 1025 | $1,695 | $1.65 | 21d | 1 | 0.22mi |
| 2009 Eppinger St Savannah, GA | 3.0 | 2.0 | 1144 | $1,500 | $1.31 | 23d | 1 | 0.28mi |
| 2023 Gugel St Savannah, GA | 3.0 | 2.0 | 1008 | $1,900 | $1.88 | 43d | 1 | 0.34mi |
| 120 Jenks St Savannah, GA | 3.0 | 1.0 | 1042 | $1,600 | $1.54 | 43d | 1 | 0.35mi |
| 2014 Lewden St Savannah, GA | 3.0 | 1.0 | 1164 | $1,600 | $1.37 | 23d | 1 | 0.39mi |
| 40 Eagle St Savannah, GA | 1.0–2.0 | 1.0 | 841 | $1,331 | $1.58 | 23d | 6 | 0.41mi |
| 206 Ferrill St Savannah, GA | 3.0 | 1.0 | 936 | $1,450 | $1.55 | 14d | 1 | 0.48mi |
| 1325 Exley St Savannah, GA | 3.0 | 2.0 | 1327 | $1,156 | $0.87 | 43d | 2 | 0.48mi |
| 1325 Exley St Savannah, GA | 2.0–3.0 | 1.0–2.5 | 1193 | $1,432 | $1.20 | 21d | 6 | 0.48mi |
| 17 Dutton St Savannah, GA | 3.0 | 1.0 | 990 | $1,650 | $1.67 | 14d | 1 | 0.53mi |
| 808 Wexler St Savannah, GA | 3.0 | 1.0 | 1204 | $1,500 | $1.25 | 43d | 1 | 0.62mi |
| 911 Crosby St Savannah, GA | 3.0 | 2.0 | 1116 | $2,000 | $1.79 | 43d | 1 | 0.84mi |
| 1013 Carroll St Savannah, GA | 2.0 | 1.5 | 768 | $1,400 | $1.82 | 43d | 1 | 0.87mi |
| 905 Elliott Ave Savannah, GA | 2.0 | 2.0 | 1032 | $1,800 | $1.74 | 43d | 1 | 0.89mi |
| 1520 Audubon Dr Savannah, GA | 3.0 | 2.0 | 1325 | $2,000 | $1.51 | 23d | 1 | 1.10mi |
| 1437 Audubon Dr Savannah, GA | 3.0 | 1.0 | 925 | $1,575 | $1.70 | 43d | 1 | 1.16mi |
| 646 W Bay St Savannah, GA | 2.0–4.0 | 2.0–4.0 | 1341 | $1,684 | $1.26 | 13d | 11 | 1.28mi |
| 601 Indian St Savannah, GA | 2.0 | 1.0–2.0 | 816 | $3,521 | $4.31 | 13d | 19 | 1.38mi |
| 630 Indian St Savannah, GA | 2.0 | 1.0–2.0 | 824 | $3,125 | $3.79 | 13d | 17 | 1.39mi |
| 540 Selma St Savannah, GA | 2.0–5.0 | 2.0–5.0 | 790 | $1,112 | $1.41 | 23d | 1 | 1.40mi |
| 3508 Haslam Ave Savannah, GA | 2.0 | 1.0 | 988 | $1,395 | $1.41 | 23d | 1 | 1.43mi |
| 555 Berrien St Unit N Savannah, GA | 2.0 | 2.5 | 1487 | $3,300 | $2.22 | 43d | 1 | 1.44mi |
| 528 Selma St Unit B Savannah, GA | 2.0 | 2.0 | 974 | $2,625 | $2.70 | 14d | 1 | 1.46mi |
Listing history 2 events
-
2026-06-13remarks 693-char remark
-
2026-06-13$60,000 Pending
ⓘ Source: listings_history table (triggers on properties + properties_extension) + one-shot
backfill from property_details.listing_events for pre-trigger history.
Tax reassessment forecast GA · Resets to sale price
- Current annual tax
- $556 · $46/mo
- Projected year-2 tax
- $556 · $46/mo
- Expected delta
- $0/yr ($0/mo · 0.0%)
ⓘ Screening estimate from a state-policy table — verify with the county assessor before closing.
Climate risk First Street
- Flood 3/10 Moderate FEMA zone X (unshaded) · 20% chance over 30 yrs
- Wildfire 3/10 Moderate
- Heat 9/10 Extreme 7 d/yr ≥109°F today · 18 d/yr by 30 yrs out
- Wind 9/10 Extreme 99% chance of damaging wind over 30 yrs
- Air quality 5/10 Major 7 unhealthy d/yr today · 8 by 30 yrs out
Nearby sold comps map
Loading sold comps map…
Walkable amenities ~0.75 mi
Loading nearby amenities…
Taxation est. · year 1
- Rental income
- $20,604
- − Mortgage interest
- −$3,361
- − Property taxes
- −$556
- − Insurance
- −$300
- − Repairs & maintenance
- −$1,648
- − Management
- −$1,648
- − Depreciation
- −$1,745
- Taxable income
- $11,345
- Est. tax owed @ 24.0%
- −$2,723
- After-tax cash flow
- $8,922/yr
For passive investors: Depreciation is non-cash, so a rental often shows a tax loss while cash-flowing — sheltering income. Rental losses are passive: they offset passive income freely, and up to $25,000/yr can offset ordinary (W-2) income if you actively participate and your MAGI is under $100k (phasing out to $0 by $150k); unused losses carry forward. On sale, claimed depreciation is recaptured at up to 25%, and gains may owe capital-gains tax (a 1031 exchange can defer both). Figures are a year-1 estimate at your 24.0% rate — not tax advice; consult a CPA.
Schools (NCES district)
- District
- Savannah-Chatham County
- NCES district ID
- 1301020
- Math proficiency
- 20% ▼ -11.00%
- Reading proficiency
- 26% ▼ -5.00%
- Median HH income
- $47,443
- Composite
- 20.14/100
- National rank
- #8639
- State rank
- #134 of 174 in GA
Livability — Savannah
- Score
- 86/100
- State rank
- #1
- US rank
- #397
Category grades
Schools grade is shown separately in the Schools card above.
Census & demographics
- Census place
- Savannah, GA
- County
- Chatham County · 271,602 people
- City population
- 216,564
- Metro
- Savannah, GA
- Population (ZIP)
- 11,082
- Household income
- $37,109
- Rent vs Own
- Severe rent burden
- 613.0
Population outlook (Chatham County) Hauer SSP2
- Today (2025)
- 332,584 people
- By 2030
- 355,508 · +6.9%
- By 2040
- 400,030 · +20.3%
- By 2050
- 443,019 · +33.2%
- By 2075
- 534,579 · +60.7%
- By 2100
- 583,863 · +75.6%
Race, ethnicity, and origin ACS 2023
- Neighborhood character
- Predominantly Black (89%)
- Race & ethnicity
- Black 89% White 5% Hispanic / Latino 5% Two or more races 3%
- Foreign-born
- 2% · Canada
- Languages at home
- 95% English-only · Spanish 4%
Political lean MEDSL · Chatham
- 2024 margin
- D (+18.0) · D 58.6% · R 40.6%
- 2008→2024 swing
- +3.6pp toward D · 2008: 14.4pp · 2024: 18.0pp
- All cycles
- 2024: D+18.0 2020: D+18.8 2016: D+14.5 2012: D+12.0 2008: D+14.4
Not yet ingested
- Civics
- —
Market trends
- HPI YoY
- ▼ -55.36%
- Current HPI
- 203.0696
- Rent YoY
- —
- Metro
- Savannah, GA
- State GDP YoY
- ▲ 2.66%
- F500 in state
- 28
Industry mix (Fortune 500 HQ in GA)
| Industry | F500 HQs | Revenue |
|---|---|---|
| Paper / Packaging | 2 | $29B |
|
||
| Retail | 1 | $160B |
|
||
| Transportation / Logistics | 1 | $91B |
|
||
| Airlines | 1 | $62B |
|
||
| Consumer Goods | 1 | $47B |
|
||
| Utilities | 1 | $25B |
|
||
Property tax history
+2.1%/yrLatest (2025): $556 · +28.6% YoY. Source: county tax records.
Cash-flow waterfall
monthlySold comps — $/sqft
last 12 mo · ≤1 miLoading sold comps…