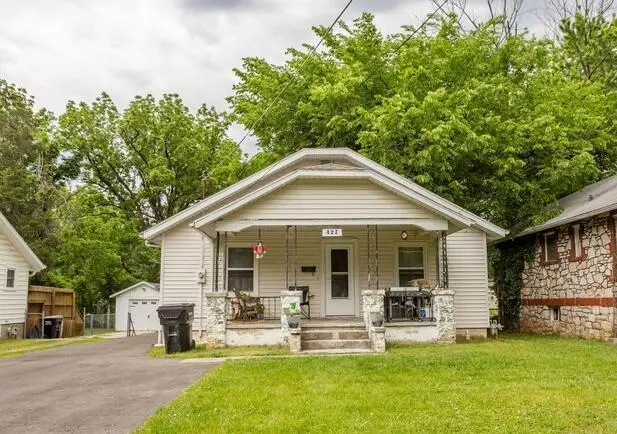
427 W Minota St · Springfield, MO
Flood risk 1/10 · Minimal
- FEMA flood zone
- X (unshaded)
- Chance of flooding over 30 yrs
- 0.0%
- Est. flood insurance / yr
- $473 – $860
Fire risk 1/10 · Minimal
- Est. fire insurance / yr
- $1,054 – $1,958
Heat risk 5/10 · Moderate
- Hot days now (above 105°F)
- 7 days/yr
- Hot days in 30 yrs
- 18 days/yr
Wind risk 2/10 · Minimal
- Chance of severe wind over 30 yrs
- —
Air-quality risk 2/10 · Minimal
- Unhealthy air days now
- 1 days/yr
- Unhealthy air days in 30 yrs
- 2 days/yr
Risk factors via First Street. Map © Google.
Why this score? — see what drove the C grade
The composite is a weighted blend of 9 inputs, each scored 0–100. Each bar is that input's sub-score; the figure is the points it added to the 100-point composite (weight × sub-score).
- Cash flow +21.0/30.0
- ARV discount +15.0/15.0
- DSCR +6.7/10.0
- 1% rule +4.6/10.0
- Livability +3.8/5.0
- Rent growth +3.2/5.0
- Schools +3.2/10.0
- Condition / age +2.5/5.0
- Appreciation +0.0/10.0
$115,000
🖨 Deal sheet 📄 Offer letter ✓ Due diligence
Listing remarks
If you are a real estate investor looking for another rental or your next flip you need to take a look at 427 W Minota. Home is located in a very convenient neighborhood just off Campbell and not far from Sunshine. With a little bit of work this one could be a wonderful home.
Key facts
- 7,405 sq ft lot
- Garage
- Built 1937
Property features AI
Exterior
- Parking: Detached garage with 1 garage space; Driveway (paved)
- Utilities: Public water; Public sewer
- Home design: Single family residence; One story
- Construction: Composition roof
- Exterior features: Covered patio; Shed(s); City street frontage on an asphalt, public-maintained road
Interior
- Kitchen: Electric oven; Free-standing electric oven; Refrigerator
- Flooring: Carpet; Linoleum; Hardwood
- Bathrooms: 1 full bathroom
- Heating & cooling: Natural gas heating with forced air and central system; Central air conditioning
- Interior features: Electric oven; Free-standing electric oven; Refrigerator; Gas water heater; Unfinished partial basement with walk-up access, sump pump and storage space
- Laundry & utility: Laundry in basement
Neighborhood map
What this means for you Summary
Snapshot
- This is a 2-bed/1.0-bath single-family listed at $115k.
Deal economics
- At list price, monthly cash flow is $163 ($2k/yr) — positive.
- The deal already cash-flows at list — no discount required.
- To meet the 1% rule (rent ≥ 1% of price), the offer needs to be $110k (4.3% below list).
- Recommended offer: $110k (4.3% below list) — sets the bar for 1% rule.
- Cap rate 8.0% vs local median 4.6% in Springfield — top-decile yield for the area; either an underpriced asset or a hidden risk that comps aren't pricing in. Stress-test before assuming the spread holds.
Location & tenants
- Location reads 75/100 on livability (#57 in MO, #4,121 nationally) — a middle-class / working-renter tenant base. Strengths: commute A+, cost of living A+, housing A+; Watch: crime F, employment F.
- Springfield R-XII (urban): math 32% / reading 46% proficiency, ranked #174 of 324 in MO (top 54%) — families likely to look elsewhere, expect single-tenant / working-renter base with shorter leases.
- Zoned schools: Sunshine Elem. (math 22% / reading 32%, grade F, #850 of 1,115 statewide, top 78%, 351 students, 75% FRL); Jarrett Middle (math 19% / reading 40%, grade F, #291 of 391 statewide, top 76%, 445 students, 70% FRL); Parkview High (math 11% / reading 40%, grade F, #433 of 521 statewide, top 83%, 1,234 students, 62% FRL) — zoned schools average 69% FRL vs 46% district-wide (23 pts higher); higher-poverty schools than district average — tighter screening recommended.
- Market conditions: Rents rising (+2.6%/yr); 249 active listings in the ZIP; 40 comparable units currently listed for rent nearby; rentals at typical pace (median 24d on market — plan ~3-4 weeks tenant-placement turnaround); 42% of comp listings sitting > 30 days — soft ceiling on asking rent; 1,302 units permitted in Greene County in 2024 (250 in 5+ unit buildings).
Forward outlook
- Local home prices are declining (-3.0%/yr); year-one equity from $795 of loan paydown is wiped out by about $3k of value loss. Plan a longer hold.
- Greene County population projected at +25% by 2050 — long-run rental-demand tailwind backs the buy-and-hold thesis.
Negotiation context
- Only 1 days on market — expect competitive offers; lowballing is unlikely to land.
Risks & watch-outs
- Watch-outs: built in 1937 — expect roof / HVAC / electrical / plumbing capex.
- Climate carrying-cost: extreme-heat days projected 7→18/yr by 2055 (HVAC capex compounding) — expect insurance premiums to compound above CPI over the hold.
Questions for the listing agent
- Built in 1937 — when were the roof, HVAC, electrical panel, plumbing, and water heater last replaced?
- Is there a deadline driving the sale (1031 exchange, divorce, estate, relocation)? That informs how much negotiation room exists.
- Crime grade is F in this area — have there been break-ins, vandalism, or insurance claims at this property in the last 3 years? What carrier currently insures it and at what premium?
- What's the average days-on-market for RENTAL listings here right now (not sales)? A rising rental-DOM trend means longer vacancies and softer asking-rent achievability than the comps imply.
- What's the recent tenant-quality profile in this submarket — average credit score on applications, eviction rate, late-payment / NSF rate, and stable-employment percentage? A property-management company in the area should have these aggregated.
- How much new for-sale + rental construction is in the pipeline within 1–3 miles? Heavy new supply typically softens prices + rents 12–24 months out; constrained supply supports both.
Investment metrics
- 1% rule
- 0.96% ✗
- Cap rate
- 7.99%
- Cash-on-cash
- 6.06%
- DSCR
- 1.27
- GRM
- 8.7
CMA / ARV
- ARV (on-the-fly)
- $159,432
- Comps found
- 12
Show comp detail 12 sales within ~0.75 mi
| Address | Dist | Beds/Ba | Sqft | Sold | Price | $/sf | Match |
|---|---|---|---|---|---|---|---|
| 437 W Minota St | 0.02mi | 3/1.0 (+1) | 932 (-2%) | 1mo | $154,900 | $166 | 90 |
| 1342 S Kimbrough Ave | 0.54mi | 2/1.0 | 950 (+0%) | 1mo | $184,900 | $195 | 74 |
| 424 E Meadowmere St | 0.47mi | 2/2.0 | 1,008 (+6%) | 1mo | $200,000 | $198 | 63 |
| 1733 South Ave | 0.31mi | 2/1.0 | 1,080 (+14%) | 2mo | $149,000 | $138 | 61 |
| 627 E University St | 0.59mi | 2/1.0 | 1,024 (+8%) | 4mo | $295,000 | $288 | 56 |
| 1836 S Kimbrough Ave | 0.63mi | 3/1.0 (+1) | 1,011 (+6%) | 4mo | $169,900 | $168 | 52 |
| 206 E Cherokee St | 0.62mi | 2/1.0 | 840 (-12%) | 1mo | $155,000 | $185 | 51 |
| 942 S Market Ave | 0.71mi | 2/1.0 | 884 (-7%) | 6mo | $139,000 | $157 | 50 |
| 307 W Mcgee St | 0.63mi | 2/1.0 | 1,062 (+12%) | 2mo | $117,500 | $111 | 49 |
| 1259 S Ferguson Ave | 0.72mi | 1/1.0 (-1) | 864 (-9%) | 4mo | $140,000 | $162 | 43 |
| 1068 S Broadway Ave | 0.69mi | 2/1.0 | 821 (-14%) | 7mo | $139,900 | $170 | 40 |
| 1352 S Fort Ave | 0.72mi | 3/1.0 (+1) | 824 (-13%) | 6mo | $110,000 | $133 | 35 |
Match score weights: distance 35% · size 25% · config 20% · recency 20%. Top-matched comps best support the ARV.
Projected returns pro-forma
-3.0% appreciation · 2.6% rent growth · sell at horizon
- IRR
- -7.4%
- Equity multiple
- 0.73×
- Total profit
- $-8,750
- Equity at exit
- $17,147
- IRR
- 1.7%
- Equity multiple
- 1.12×
- Total profit
- $3,777
- Equity at exit
- $9,943
Cash invested: $32,200 (down + closing). Projections, not guarantees.
Landlord ↔ Tenant lean methodology
- Overall (STATE)
- 81 Strongly Landlord-Friendly
- State Missouri
- 81 Strongly Landlord-Friendly · R+10
- County
- — inherits STATE
- City
- — inherits STATE
ZIP-level market 65807
- Rents YoY
- 2.6%
- Active inventory
- 249
- Price-to-rent
- 8.7×
Monthly cashflow live
- Estimated rent
- $1,100 high interval (Pro) →
- Mortgage (P&I)
- −$603
- Tax from tax record
- −$55 /mo · $666/yr
- Insurance
- −$48
- HOA
- −$0
- Vacancy / Maint / Mgmt
- −$231
- Net cashflow
- $163
Break-even live
UW: 25.0% down · 7.5% · 30yr · 1.5% tax · 5.0% vac · 8.0% maint · 8.0% mgmt
Financing live
Cash to close
- Down payment
- $28,750
- Closing costs
- $3,450
- Reserves months
- —
- Total cash needed
- —
Loan-product check · same deal, 3 products live
Conventional
25% down · 7.5% · 30yr
- Down + closing
- —
- Monthly P&I
- —
- Monthly cashflow
- —
- DSCR
- —
- Eligible?
- —
Personal DTI + credit; lowest rate.
DSCR
20% down · 8.5% · 30yr
- Down + closing
- —
- Monthly P&I
- —
- Monthly cashflow
- —
- DSCR
- —
- Eligible?
- —
No personal income docs; deal must DSCR.
Hard money
10% down · 12.0% · 12mo
- Down + closing
- —
- Monthly P&I
- —
- Monthly cashflow
- —
- DSCR
- —
- Eligible?
- —
Short-term bridge; refi at stabilization.
Rent comps 40 comps
| Address | Beds | Baths | Sqft | Rent | $/sqft | DOM | Units | Dist |
|---|---|---|---|---|---|---|---|---|
| 1112 S Grant Ave Springfield, MO | 1.0 | 1.0 | 800 | $1,095 | $1.37 | 43d | 1 | 0.52mi |
| 810 W Catalpa St Apt 316 Springfield, MO | 1.0 | 1.0 | 581 | $551 | $0.95 | 23d | 1 | 0.57mi |
| 810 W Catalpa St Apt 302 Springfield, MO | 2.0 | 1.0 | 806 | $664 | $0.82 | 23d | 1 | 0.57mi |
| 1044 S Main Ave Springfield, MO | 2.0 | 1.0 | 1089 | $1,050 | $0.96 | 43d | 1 | 0.60mi |
| 1017 W Washita St Unit 2 Springfield, MO | 1.0 | 1.0 | 585 | $825 | $1.41 | 13d | 1 | 0.62mi |
| 505 W Grand St Springfield, MO | 1.0–2.0 | 1.0–2.0 | 996 | $1,395 | $1.40 | 13d | 1 | 0.71mi |
| 433 W Grand St Unit C Springfield, MO | 2.0 | 1.0 | 1023 | $1,295 | $1.27 | 43d | 1 | 0.71mi |
| 901 South Ave Springfield, MO | 2.0–3.0 | 1.0–2.0 | 695 | $825 | $1.19 | 43d | 1 | 0.79mi |
| 847 S Grant Ave Springfield, MO | 2.0 | 1.0 | 1080 | $815 | $0.75 | 43d | 1 | 0.86mi |
| 806 South Ave Springfield, MO | 1.0 | 1.0 | 670 | $1,085 | $1.62 | 13d | 3 | 0.91mi |
| 755 South Ave Unit 2 Springfield, MO | 1.0 | 1.0 | 600 | $850 | $1.42 | 23d | 1 | 0.97mi |
| 741 South Ave Unit 5 Springfield, MO | 1.0 | 1.0 | 950 | $750 | $0.79 | 43d | 1 | 0.98mi |
| 301 W State St Unit D Springfield, MO | 1.0 | 1.0 | 570 | $875 | $1.54 | 23d | 1 | 1.08mi |
| 1036 W Monroe Ter Springfield, MO | 2.0 | 1.0 | 812 | $795 | $0.98 | 23d | 1 | 1.09mi |
| 1562 S National Ave Springfield, MO | 3.0 | 1.0 | 1064 | $1,225 | $1.15 | 43d | 1 | 1.10mi |
| 533 Bear Blvd Unit 111 Springfield, MO | 1.0 | 1.0 | 1100 | $649 | $0.59 | 43d | 1 | 1.12mi |
| 1735 W Bennett St Springfield, MO | 1.0 | 1.0 | 800 | $1,124 | $1.41 | 13d | 2 | 1.13mi |
| 627 Bear Blvd Springfield, MO | 2.0 | 2.0 | 943 | $1,400 | $1.48 | 43d | 2 | 1.16mi |
| 930 W Harrison St Springfield, MO | 3.0 | 2.0 | 1046 | $1,150 | $1.10 | 13d | 1 | 1.18mi |
| 2035 S Florence Ave Springfield, MO | 2.0 | 1.0 | 850 | $1,195 | $1.41 | 13d | 1 | 1.19mi |
| 511 E Cherry St Unit 2 Springfield, MO | 1.0 | 1.0 | 700 | $850 | $1.21 | 43d | 1 | 1.28mi |
| 1634 S Marion Ave Springfield, MO | 3.0 | 1.0–2.0 | 845 | $1,404 | $1.66 | 13d | 23 | 1.28mi |
| 625 W Edgewood St Springfield, MO | 2.0 | 1.5 | 1100 | $1,050 | $0.95 | 43d | 1 | 1.29mi |
| 627 S Fort Ave Springfield, MO | 2.0 | 1.0 | 880 | $895 | $1.02 | 23d | 1 | 1.32mi |
| 513 S Broadway Ave Springfield, MO | 2.0 | 1.0 | 800 | $855 | $1.07 | 43d | 1 | 1.33mi |
| 2561 South Pl Unit B Springfield, MO | 2.0 | 1.0 | 884 | $850 | $0.96 | 23d | 1 | 1.34mi |
| 430 W Pershing St Springfield, MO | 2.0 | 2.0 | 765 | $1,195 | $1.56 | 13d | 1 | 1.35mi |
| 1228 E Belmont St Springfield, MO | 1.0–2.0 | 1.0 | 802 | $930 | $1.16 | 43d | 1 | 1.36mi |
| 865 S Douglas Ave Springfield, MO | 2.0 | 2.0 | 850 | $895 | $1.05 | 13d | 4 | 1.36mi |
| 2521 S Holland Ave Springfield, MO | 1.0–2.0 | 1.0–2.0 | 1034 | $1,695 | $1.64 | 43d | 1 | 1.37mi |
| 2621 S Jefferson Ave Unit 323 Springfield, MO | 1.0 | 1.0 | 642 | $1,295 | $2.02 | 13d | 1 | 1.38mi |
| 611 W Sunset St Springfield, MO | 2.0–3.0 | 2.0 | 1104 | $1,663 | $1.51 | 13d | 5 | 1.39mi |
| 1625 S Marion Ave Springfield, MO | 1.0–2.0 | 1.0–2.0 | 900 | $1,321 | $1.47 | 13d | 5 | 1.41mi |
| 535 W Walnut St Springfield, MO | 2.0 | 2.0 | 1096 | $1,495 | $1.36 | 43d | 1 | 1.42mi |
| 1426 E University St Springfield, MO | 2.0 | 1.0 | 1000 | $1,400 | $1.40 | 43d | 1 | 1.44mi |
| 305 S Campbell Ave Unit 208 Springfield, MO | 1.0 | 1.0 | 649 | $975 | $1.50 | 13d | 1 | 1.45mi |
| 1006 W Edgewood St Unit A Springfield, MO | 2.0 | 1.0 | 864 | $995 | $1.15 | 23d | 1 | 1.47mi |
| 309 S Jefferson Ave Unit 211 Springfield, MO | 2.0 | 2.0 | 762 | $767 | $1.01 | 43d | 1 | 1.47mi |
| 211 S Market Ave Springfield, MO | 2.0–4.0 | 1.0–2.0 | 1442 | $1,425 | $0.99 | 23d | 5 | 1.47mi |
| 211 S Market Ave Springfield, MO | 2.0–4.0 | 1.0–2.0 | 1442 | $1,425 | $0.99 | 21d | 5 | 1.47mi |
Listing history 2 events
-
2026-05-18status Pending
-
2026-05-18$115,000 Active
ⓘ Source: listings_history table (triggers on properties + properties_extension) + one-shot
backfill from property_details.listing_events for pre-trigger history.
Tax reassessment forecast MO · Resets to sale price
- Current annual tax
- $666 · $55/mo
- Projected year-2 tax
- $1,116 · $93/mo
- Expected delta
- +$450/yr (+$37/mo · 67.6%)
ⓘ Screening estimate from a state-policy table — verify with the county assessor before closing.
Climate risk First Street
- Flood 1/10 Low FEMA zone X (unshaded) · 0% chance over 30 yrs
- Wildfire 1/10 Low
- Heat 5/10 Major 7 d/yr ≥105°F today · 18 d/yr by 30 yrs out
- Wind 2/10 Low
- Air quality 2/10 Low 1 unhealthy d/yr today · 2 by 30 yrs out
Nearby sold comps map
Loading sold comps map…
Walkable amenities ~0.75 mi
Loading nearby amenities…
Taxation est. · year 1
- Rental income
- $13,203
- − Mortgage interest
- −$6,442
- − Property taxes
- −$666
- − Insurance
- −$575
- − Repairs & maintenance
- −$1,056
- − Management
- −$1,056
- − Depreciation
- −$3,345
- Taxable income
- $62
- Est. tax owed @ 24.0%
- −$15
- After-tax cash flow
- $1,938/yr
For passive investors: Depreciation is non-cash, so a rental often shows a tax loss while cash-flowing — sheltering income. Rental losses are passive: they offset passive income freely, and up to $25,000/yr can offset ordinary (W-2) income if you actively participate and your MAGI is under $100k (phasing out to $0 by $150k); unused losses carry forward. On sale, claimed depreciation is recaptured at up to 25%, and gains may owe capital-gains tax (a 1031 exchange can defer both). Figures are a year-1 estimate at your 24.0% rate — not tax advice; consult a CPA.
Schools (NCES district)
- District
- Springfield R-XII
- NCES district ID
- 2928860
- Math proficiency
- 32% ▼ -2.00%
- Reading proficiency
- 46% ▼ -3.00%
- Median HH income
- $37,886
- Composite
- 32.45/100
- National rank
- #5717
- State rank
- #174 of 324 in MO
Livability — Springfield
- Score
- 75/100
- State rank
- #57
- US rank
- #4121
Category grades
Schools grade is shown separately in the Schools card above.
Census & demographics
- Census place
- Springfield, MO
- County
- Greene County · 244,327 people
- City population
- 223,044
- Metro
- Springfield, MO
- Population (ZIP)
- 56,659
- Household income
- $53,870
- Rent vs Own
- Severe rent burden
- 3420.0
Population outlook (Greene County) Hauer SSP2
- Today (2025)
- 319,054 people
- By 2030
- 335,135 · +5.0%
- By 2040
- 366,186 · +14.8%
- By 2050
- 397,431 · +24.6%
- By 2075
- 477,035 · +49.5%
- By 2100
- 520,828 · +63.2%
Race, ethnicity, and origin ACS 2023
- Neighborhood character
- Predominantly White (81%)
- Race & ethnicity
- White 81% Two or more races 8% Hispanic / Latino 7% Black 4% Asian 3%
- Hispanic origin (detail)
- Mexican 4%
- Common ancestry
- Italian 3% Lithuanian 2% Slovak 2%
- Foreign-born
- 4% · Canada, South Korea
- Languages at home
- 94% English-only · Spanish 2% Other Asian/Pacific 1% Arabic 1%
Political lean MEDSL · Greene
- 2024 margin
- Strong R (+20.8) · D 38.9% · R 59.7% · Other 1.4%
- 2008→2024 swing
- -5.0pp toward R · 2008: -15.8pp · 2024: -20.8pp
- All cycles
- 2024: R+20.8 2020: R+20.1 2016: R+27.4 2012: R+24.4 2008: R+15.8
Not yet ingested
- Civics
- —
Market trends
- HPI YoY
- ▼ -205.97%
- Current HPI
- 210.4358
- Rent YoY
- ▲ 2.60%
- Metro
- Springfield, MO
- State GDP YoY
- ▲ 1.84%
- F500 in state
- 20
Industry mix (Fortune 500 HQ in MO)
| Industry | F500 HQs | Revenue |
|---|---|---|
| Healthcare | 1 | $163B |
|
||
| Insurance | 1 | $21B |
|
||
| Industrial Technology | 1 | $17B |
|
||
| Retail | 1 | $16B |
|
||
| Industrial Distribution | 1 | $10B |
|
||
| Utilities | 1 | $9B |
|
||
Price history
2 events — show timeline
- 2026-05-18 Pending — SOMO
- 2026-05-18 Listed $115,000 SOMO
Property tax history
+3.1%/yrLatest (2025): $666 · +13.2% YoY. Source: county tax records.
Cash-flow waterfall
monthlySold comps — $/sqft
last 12 mo · ≤1 miLoading sold comps…