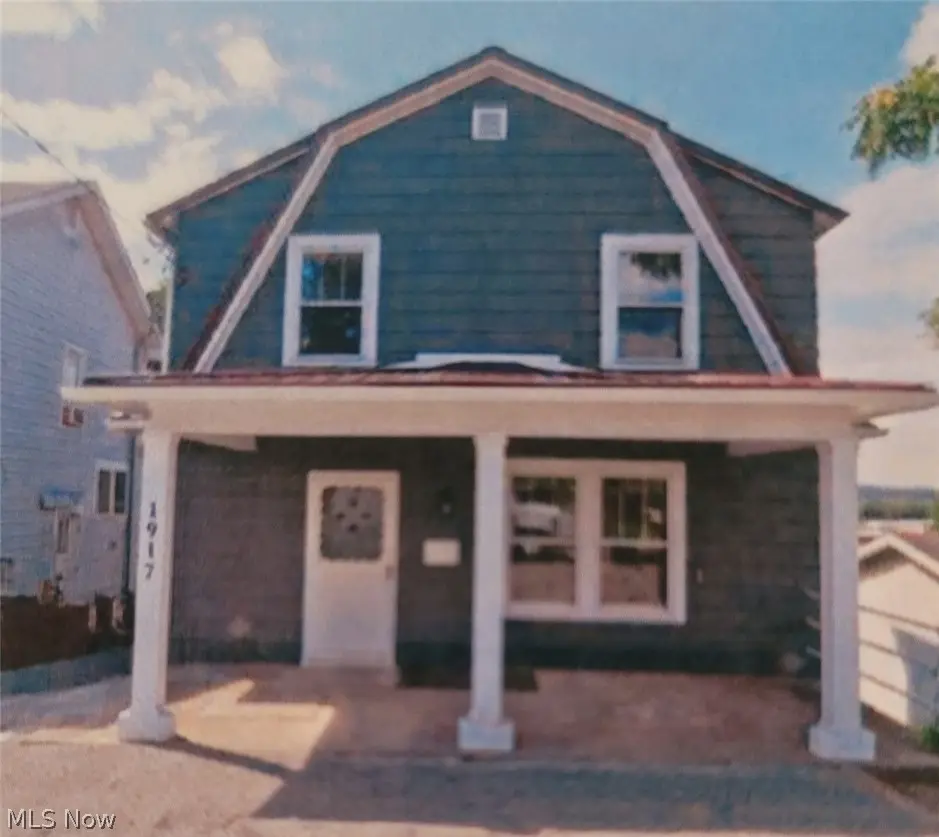
1917 Market St · Parkersburg, WV
Flood risk 1/10 · Minimal
- FEMA flood zone
- X (unshaded)
- Chance of flooding over 30 yrs
- 0.0%
- Est. flood insurance / yr
- $473 – $860
Fire risk 1/10 · Minimal
- Est. fire insurance / yr
- $787 – $1,461
Heat risk 5/10 · Moderate
- Hot days now (above 101°F)
- 7 days/yr
- Hot days in 30 yrs
- 19 days/yr
Wind risk 2/10 · Minimal
- Chance of severe wind over 30 yrs
- 1.0%
Air-quality risk 1/10 · Minimal
- Unhealthy air days now
- 0 days/yr
- Unhealthy air days in 30 yrs
- 0 days/yr
Risk factors via First Street. Map © Google.
Why this score? — see what drove the C+ grade
The composite is a weighted blend of 9 inputs, each scored 0–100. Each bar is that input's sub-score; the figure is the points it added to the 100-point composite (weight × sub-score).
- Cash flow +21.9/30.0
- ARV discount +15.0/15.0
- DSCR +7.0/10.0
- 1% rule +5.7/10.0
- Schools +3.6/10.0
- Livability +3.6/5.0
- Rent growth +2.5/5.0
- Condition / age +2.5/5.0
- Appreciation +0.0/10.0
$105,000
🖨 Deal sheet (PDF) 📄 Offer letter ✓ Due diligence
Listing remarks
This 3 bedroom 1 bath home is located on a dead end street near Dudley school, hospital, restaurants and activities. Freshly painted. Great price!
Key facts
- Near hospital
- Near restaurants
- Dead end street
Tags
Property features AI
Exterior
- Parking: Off-street parking
- Security: Smoke detectors
- Utilities: Public water; Public sewer
- Home design: 2-story; Frame construction; Metal roof
- Construction: Frame construction; Metal roof; Built year per assessor
- Exterior features: Front porch; Located on a dead-end street
Interior
- Kitchen: Range; Refrigerator
- Bathrooms: 1 full bathroom
- Heating & cooling: Central air conditioning; Forced air heating (gas)
- Interior features: Updated/remodeled condition; Basement (other)
- Laundry & utility: Laundry in basement
Neighborhood map
What this means for you Summary
Snapshot
- This is a 3-bed/1.0-bath single-family listed at $105k.
Deal economics
- At list price, monthly cash flow is $166 ($2k/yr) — positive.
- The deal already cash-flows at list — no discount required.
- Meets the 1% rule at list price ($1k rent vs $105k).
- Recommended offer: $103k (1.5% below list) — sets the bar for market timing.
- Cap rate 8.2% vs local median 5.6% in Parkersburg — top-decile yield for the area; either an underpriced asset or a hidden risk that comps aren't pricing in. Stress-test before assuming the spread holds.
Location & tenants
- Location reads 72/100 on livability (#46 in WV) — a middle-class / working-renter tenant base. Strengths: cost of living A+, housing A+, health & safety A+; Watch: crime D+, schools F, commute F.
- Wood County Schools (urban): math 38% / reading 48% proficiency, ranked #3 of 55 in WV (top 6%) — families likely to look elsewhere, expect single-tenant / working-renter base with shorter leases.
- Market conditions: 148 active listings in the ZIP; 124 units permitted in Wood County in 2024 (33 in 5+ unit buildings).
Forward outlook
- Local home prices are declining (-3.0%/yr); year-one equity from $726 of loan paydown is wiped out by about $3k of value loss. Plan a longer hold.
- Wood County population projected at -13% by 2050 — secular population decline; favor cash flow + early exit over multi-decade hold.
Negotiation context
- It's been on market 29 days — a 2% lower offer ($103k) is reasonable based on typical stale-listing flexibility.
- 4 sale attempts since 3y ago with the ask held roughly flat each time — persistent listings suggest the price (not the market) is what's stuck; bring a comps-based counter.
- Current owner paid $85k; 24% above their basis — modest negotiation headroom, anchor on the comps not their cost.
Risks & watch-outs
- Watch-outs: built in 1930 — expect roof / HVAC / electrical / plumbing capex.
- Climate carrying-cost: extreme-heat days projected 7→19/yr by 2055 (HVAC capex compounding) — expect insurance premiums to compound above CPI over the hold.
Questions for the listing agent
- Built in 1930 — when were the roof, HVAC, electrical panel, plumbing, and water heater last replaced?
- Is there a deadline driving the sale (1031 exchange, divorce, estate, relocation)? That informs how much negotiation room exists.
- Schools are F-rated, which usually means shorter tenancies and higher turnover. Who's the typical renter profile here, and what's been the actual vacancy rate?
- Crime grade is D in this area — have there been break-ins, vandalism, or insurance claims at this property in the last 3 years? What carrier currently insures it and at what premium?
- What's the average days-on-market for RENTAL listings here right now (not sales)? A rising rental-DOM trend means longer vacancies and softer asking-rent achievability than the comps imply.
- What's the recent tenant-quality profile in this submarket — average credit score on applications, eviction rate, late-payment / NSF rate, and stable-employment percentage? A property-management company in the area should have these aggregated.
- How much new for-sale + rental construction is in the pipeline within 1–3 miles? Heavy new supply typically softens prices + rents 12–24 months out; constrained supply supports both.
Investment metrics
- 1% rule
- 1.07% ✓
- Cap rate
- 8.19%
- Cash-on-cash
- 6.78%
- DSCR
- 1.30
- GRM
- 7.8
CMA / ARV
- ARV (on-the-fly)
- $147,804
- Comps found
- 12
Show comp detail 12 sales within ~0.75 mi
| Address | Dist | Beds/Ba | Sqft | Sold | Price | $/sf | Match |
|---|---|---|---|---|---|---|---|
| 1720 Spring St | 0.21mi | 3/1.0 | 1,352 (+3%) | 10mo | $35,000 | $26 | 77 |
| 607 Hillcrest Ter | 0.62mi | 3/1.0 | 1,309 (+0%) | 2mo | $169,900 | $130 | 70 |
| 1006 Jackson Ave | 0.72mi | 3/1.0 | 1,301 (-0%) | 6mo | $134,900 | $104 | 60 |
| 1007 25th St | 0.28mi | 3/1.0 | 1,150 (-12%) | 9mo | $129,500 | $113 | 59 |
| 1808 Covert St | 0.20mi | 3/1.5 | 1,500 (+15%) | 6mo | $75,000 | $50 | 59 |
| 730 29th St | 0.62mi | 3/1.5 | 1,324 (+1%) | 10mo | $135,000 | $102 | 58 |
| 1426 23rd St | 0.56mi | 3/1.5 | 1,400 (+7%) | 4mo | $166,500 | $119 | 57 |
| 1009 Bidwell St | 0.25mi | 3/1.0 | 1,117 (-15%) | 9mo | $93,000 | $83 | 56 |
| 1027 32nd St | 0.52mi | 3/1.5 | 1,452 (+11%) | 0mo | $200,500 | $138 | 55 |
| 1528 20th St | 0.66mi | 2/1.0 (-1) | 1,241 (-5%) | 11mo | $114,900 | $93 | 47 |
| 2208 Oak St | 0.59mi | 3/2.0 | 1,442 (+10%) | 9mo | $187,000 | $130 | 43 |
| 1524 20th St | 0.64mi | 3/1.0 | 1,128 (-14%) | 8mo | $144,000 | $128 | 41 |
Match score weights: distance 35% · size 25% · config 20% · recency 20%. Top-matched comps best support the ARV.
Projected returns pro-forma
-3.0% appreciation · 3.0% rent growth · sell at horizon
- IRR
- -5.9%
- Equity multiple
- 0.78×
- Total profit
- $-6,422
- Equity at exit
- $15,656
- IRR
- 3.8%
- Equity multiple
- 1.28×
- Total profit
- $8,088
- Equity at exit
- $9,078
Cash invested: $29,400 (down + closing). Projections, not guarantees.
Landlord ↔ Tenant lean methodology
- Overall (STATE)
- 83 Strongly Landlord-Friendly
- State West Virginia
- 83 Strongly Landlord-Friendly · R+22
- County
- — inherits STATE
- City
- — inherits STATE
ZIP-level market 26101
- Home prices YoY
- -27.3%
- Active inventory
- 148
- Price-to-rent
- 7.8×
Monthly cashflow live
- Estimated rent
- $1,124 medium interval (Pro) →
- Mortgage (P&I)
- −$551
- Tax from tax record
- −$128 /mo · $1,531/yr
- Insurance
- −$44
- HOA
- −$0
- Vacancy / Maint / Mgmt
- −$236
- Net cashflow
- $166
Break-even live
Sensitivity live
| Price | -10% $226 | -5% $196 | +0% $166 | +5% $136 | +10% $107 |
|---|---|---|---|---|---|
| Rent | -10% $77 | -5% $122 | +0% $166 | +5% $210 | +10% $255 |
| Rate | -1.0pp $219 | -0.5pp $193 | base $166 | +0.5pp $139 | +1.0pp $111 |
UW: 25.0% down · 7.5% · 30yr · 1.5% tax · 5.0% vac · 8.0% maint · 8.0% mgmt
Financing live
Cash to close
- Down payment
- $26,250
- Closing costs
- $3,150
- Reserves months
- —
- Total cash needed
- —
Loan-product check · same deal, 3 products live
Conventional
25% down · 7.5% · 30yr
- Down + closing
- —
- Monthly P&I
- —
- Monthly cashflow
- —
- DSCR
- —
- Eligible?
- —
Personal DTI + credit; lowest rate.
DSCR
20% down · 8.5% · 30yr
- Down + closing
- —
- Monthly P&I
- —
- Monthly cashflow
- —
- DSCR
- —
- Eligible?
- —
No personal income docs; deal must DSCR.
Hard money
10% down · 12.0% · 12mo
- Down + closing
- —
- Monthly P&I
- —
- Monthly cashflow
- —
- DSCR
- —
- Eligible?
- —
Short-term bridge; refi at stabilization.
Listing history 31 events
-
2026-06-21days on market $105,000 Active 29 DOM
-
2026-06-19days on market $105,000 Active 27 DOM
-
2026-06-18days on market $105,000 Active 26 DOM
-
2026-06-17days on market $105,000 Active 25 DOM
-
2026-06-16days on market $105,000 Active 24 DOM
-
2026-06-15days on market $105,000 Active 23 DOM
-
2026-06-14days on market $105,000 Active 21 DOM
-
2026-06-12days on market $105,000 Active 20 DOM
-
2026-06-09days on market $105,000 Active 17 DOM
-
2026-06-08days on market $105,000 Active 16 DOM
-
2026-06-07days on market $105,000 Active 15 DOM
-
2026-06-05days on market $105,000 Active 12 DOM
-
2026-06-03days on market $105,000 Active 11 DOM
-
2026-06-02days on market $105,000 Active 10 DOM
-
2026-06-01days on market $105,000 Active 9 DOM
-
2026-05-31days on market $105,000 Active 8 DOM
-
2026-05-30days on market $105,000 Active 7 DOM
-
2026-05-22$105,000 Active
-
2026-04-17historical $1,295
-
2026-04-10$1,295
-
2024-06-21historical $1,000
-
2024-05-22price $1,000
-
2024-04-16$1,100
-
2024-01-12historical $1,100
-
2023-11-29price $1,100
-
2023-11-23price $1,300
-
2023-11-18price $1,100
-
2023-10-21$1,300
-
2023-09-27soldstatus $85,000
-
2002-12-20soldstatus $20,000
-
1997-10-31soldstatus $10,000
ⓘ Source: listings_history table (triggers on properties + properties_extension) + one-shot
backfill from property_details.listing_events for pre-trigger history.
Tax reassessment forecast WV · Resets to sale price
- Current annual tax
- $1,531 · $128/mo
- Projected year-2 tax
- $1,531 · $128/mo
- Expected delta
- $0/yr ($0/mo · 0.0%)
ⓘ Screening estimate from a state-policy table — verify with the county assessor before closing.
Climate risk First Street
- Flood 1/10 Low FEMA zone X (unshaded) · 0% chance over 30 yrs
- Wildfire 1/10 Low
- Heat 5/10 Major 7 d/yr ≥101°F today · 19 d/yr by 30 yrs out
- Wind 2/10 Low 100% chance of damaging wind over 30 yrs
- Air quality 1/10 Low 0 unhealthy d/yr today · 0 by 30 yrs out
Nearby sold comps map
Loading sold comps map…
Walkable amenities ~0.75 mi
Loading nearby amenities…
Taxation est. · year 1
- Rental income
- $13,489
- − Mortgage interest
- −$5,882
- − Property taxes
- −$1,531
- − Insurance
- −$525
- − Repairs & maintenance
- −$1,079
- − Management
- −$1,079
- − Depreciation
- −$3,055
- Taxable income
- $339
- Est. tax owed @ 24.0%
- −$81
- After-tax cash flow
- $1,912/yr
For passive investors: Depreciation is non-cash, so a rental often shows a tax loss while cash-flowing — sheltering income. Rental losses are passive: they offset passive income freely, and up to $25,000/yr can offset ordinary (W-2) income if you actively participate and your MAGI is under $100k (phasing out to $0 by $150k); unused losses carry forward. On sale, claimed depreciation is recaptured at up to 25%, and gains may owe capital-gains tax (a 1031 exchange can defer both). Figures are a year-1 estimate at your 24.0% rate — not tax advice; consult a CPA.
Schools (NCES district)
- District
- Wood County Schools
- NCES district ID
- 5401620
- Math proficiency
- 38% ▼ -10.00%
- Reading proficiency
- 48% ▼ -4.00%
- Median HH income
- $42,363
- Composite
- 36.22/100
- National rank
- #4728
- State rank
- #3 of 55 in WV
Livability — Parkersburg
- Score
- 72/100
- State rank
- #46
- US rank
- #5841
Category grades
Schools grade is shown separately in the Schools card above.
Census & demographics
- Census place
- Parkersburg, WV
- County
- Wood County · 44,810 people
- City population
- 44,810
- Metro
- Parkersburg-Vienna, WV
- Population (ZIP)
- 28,005
- Household income
- $48,710
- Rent vs Own
- Severe rent burden
- 723.0
Population outlook (Wood County) Hauer SSP2
- Today (2025)
- 84,304 people
- By 2030
- 82,420 · -2.2%
- By 2040
- 78,133 · -7.3%
- By 2050
- 73,639 · -12.7%
- By 2075
- 63,093 · -25.2%
- By 2100
- 50,461 · -40.1%
Race, ethnicity, and origin ACS 2023
- Neighborhood character
- Predominantly White (93%)
- Race & ethnicity
- White 93% Two or more races 3% Hispanic / Latino 2% Black 1%
- Common ancestry
- Serbian 2% Slovak 2% Lithuanian 1%
- Foreign-born
- 1%
Political lean MEDSL · Wood
- 2024 margin
- Solid R (+43.0) · D 27.6% · R 70.7% · Other 1.6%
- 2008→2024 swing
- -14.4pp toward R · 2008: -28.7pp · 2024: -43.0pp
- All cycles
- 2024: R+43.0 2020: R+42.0 2016: R+47.8 2012: R+32.5 2008: R+28.7
Not yet ingested
- Civics
- —
Market trends
- HPI YoY
- ▼ -76.52%
- Current HPI
- 203.4508
- Rent YoY
- —
- Metro
- Parkersburg-Vienna, WV
- State GDP YoY
- —
- F500 in state
- 0
Price history
+950.0% since first listed14 events — show timeline
- 2026-05-22 Listed $105,000 MLSNOW
- 2026-04-17 Rental Removed $1,295 APPFOLIO
- 2026-04-10 Listed for Rent $1,295 APPFOLIO
- 2024-06-21 Rental Removed $1,000 APPFOLIO
- 2024-05-22 Price Changed $1,000 APPFOLIO
- 2024-04-16 Listed for Rent $1,100 APPFOLIO
- 2024-01-12 Rental Removed $1,100 APPFOLIO
- 2023-11-29 Price Changed $1,100 APPFOLIO
- 2023-11-23 Price Changed $1,300 APPFOLIO
- 2023-11-18 Price Changed $1,100 APPFOLIO
- 2023-10-21 Listed for Rent $1,300 APPFOLIO
- 2023-09-27 Sold (Public Records) $85,000 Public Records
- 2002-12-20 Sold (Public Records) $20,000 Public Records
- 1997-10-31 Sold (Public Records) $10,000 Public Records
Property tax history
+22.4%/yrLatest (2025): $1,531 · +191.2% YoY. Source: county tax records.
Cash-flow waterfall
monthlySold comps — $/sqft
last 12 mo · ≤1 miLoading sold comps…