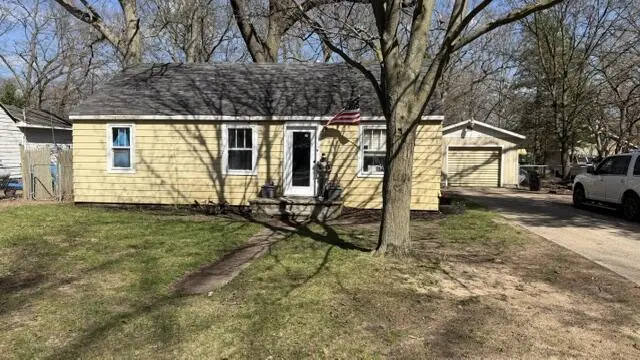
2970 Valley St · Norton Shores, MI
Flood risk 1/10 · Minimal
- FEMA flood zone
- X (unshaded)
- Chance of flooding over 30 yrs
- 0.0%
- Est. flood insurance / yr
- $507 – $1,088
Fire risk 1/10 · Minimal
- Est. fire insurance / yr
- $784 – $1,456
Heat risk 2/10 · Minimal
- Hot days now (above 93°F)
- 7 days/yr
- Hot days in 30 yrs
- 15 days/yr
Wind risk 1/10 · Minimal
- Chance of severe wind over 30 yrs
- —
Air-quality risk 4/10 · Minor
- Unhealthy air days now
- 4 days/yr
- Unhealthy air days in 30 yrs
- 6 days/yr
Risk factors via First Street. Map © Google.
Why this score? — see what drove the D+ grade
The composite is a weighted blend of 9 inputs, each scored 0–100. Each bar is that input's sub-score; the figure is the points it added to the 100-point composite (weight × sub-score).
- Cash flow +16.8/30.0
- ARV discount +9.5/15.0
- DSCR +5.2/10.0
- 1% rule +4.9/10.0
- Livability +3.5/5.0
- Rent growth +2.5/5.0
- Condition / age +2.5/5.0
- Schools +0.6/10.0
- Appreciation +0.0/10.0
$127,900
🖨 Deal sheet (PDF) 📄 Offer letter ✓ Due diligence
Listing remarks MLS
3 bedroom in Norton Shores! Just minutes away from the highway, this home is currently priced under market value. Nice fenced in back yard and detached garage. Located across the street from the Getty Drive-In movie theatre. Home is in need of some TLC but is a great value for the location.
Key facts
- Fenced in back yard
- Detached garage
- 0.26 acre lot
Tags
Property features AI
Exterior
- Parking: Detached garage; 1-car garage
- Utilities: Public water; Natural gas available and connected; Electricity available; Natural gas water heater
- Home design: Ranch-style single-family home; Single-story
- Construction: Built in 1942; Aluminum siding; Composition roof; Crawl space foundation
- Exterior features: Wooded lot; Paved road access
Interior
- Kitchen: Kitchen (11 x 11)
- Bedrooms: Bedroom (10 x 8)
- Bathrooms: 1 full bathroom; Additional bathroom (10 x 10); Additional bathroom (9 x 9)
- Heating & cooling: Forced air heating; Home has heating
- Interior features: Accessible kitchen; Main-floor accessible bedroom; Storm windows and replacement windows; Window treatments; 5 total rooms; Crawl space basement
Neighborhood map
What this means for you Summary
Snapshot
- This is a 3-bed/1.0-bath single-family listed at $128k.
Deal economics
- At list price, monthly cash flow is $82 ($979/yr) — positive.
- The deal already cash-flows at list — no discount required.
- To meet the 1% rule (rent ≥ 1% of price), the offer needs to be $126k (1.2% below list).
- Recommended offer: $126k (1.5% below list) — sets the bar for market timing.
- Cap rate 7.1% vs local median 3.3% in Norton Shores — top-decile yield for the area; either an underpriced asset or a hidden risk that comps aren't pricing in. Stress-test before assuming the spread holds.
Location & tenants
- Location reads 70/100 on livability (#310 in MI) — a middle-class / working-renter tenant base. Strengths: cost of living A+, housing A+, crime B; Watch: amenities F, commute F, health & safety F.
- Muskegon Public Schools Of The City Of (urban): math 4% / reading 12% proficiency, ranked #534 of 540 in MI (top 99%) — low school quality limits family demand, transient renter base, plan for 1-2y turnover; 81% free/reduced lunch — lower-income household profile, screen leases tightly.
- Zoned schools: Muskegon Middle School (math 4% / reading 13%, grade F, #480 of 493 statewide, top 97%, 755 students, 87% FRL); Muskegon High School (math 8% / reading 27%, grade F, #632 of 713 statewide, top 89%, 1,039 students, 84% FRL) — zoned schools at 85% FRL track the district average.
- Market conditions: 239 active listings in the ZIP; 2 comparable units currently listed for rent nearby; 438 units permitted in Muskegon County in 2024 (115 in 5+ unit buildings).
Forward outlook
- Local home prices are declining (-3.0%/yr); year-one equity from $884 of loan paydown is wiped out by about $4k of value loss. Plan a longer hold.
- Muskegon County population projected to shrink 8% by 2050 — rents likely to lag national; underwrite the cash flow, not the appreciation.
Negotiation context
- It's been on market 23 days — a 2% lower offer ($126k) is reasonable based on typical stale-listing flexibility.
- 8 sale attempts since 6y ago with the ask held roughly flat each time — persistent listings suggest the price (not the market) is what's stuck; bring a comps-based counter.
- Current owner paid $89k; 44% above their basis — modest negotiation headroom, anchor on the comps not their cost.
Risks & watch-outs
- Watch-outs: built in 1942 — expect roof / HVAC / electrical / plumbing capex.
Questions for the listing agent
- Built in 1942 — when were the roof, HVAC, electrical panel, plumbing, and water heater last replaced?
- Is there a deadline driving the sale (1031 exchange, divorce, estate, relocation)? That informs how much negotiation room exists.
- Schools are B-rated — typically a magnet for longer-tenancy family renters. What's the average tenant stay here, and is there a school-zone premium baked into asking?
- The area grade is low — what's the realistic commute time and amenity access for the typical tenant pool here? Any planned neighborhood developments (good or bad) we should know about?
- What's the average days-on-market for RENTAL listings here right now (not sales)? A rising rental-DOM trend means longer vacancies and softer asking-rent achievability than the comps imply.
- What's the recent tenant-quality profile in this submarket — average credit score on applications, eviction rate, late-payment / NSF rate, and stable-employment percentage? A property-management company in the area should have these aggregated.
- How much new for-sale + rental construction is in the pipeline within 1–3 miles? Heavy new supply typically softens prices + rents 12–24 months out; constrained supply supports both.
Investment metrics
- 1% rule
- 0.99% ✗
- Cap rate
- 7.06%
- Cash-on-cash
- 2.73%
- DSCR
- 1.12
- GRM
- 8.4
CMA / ARV
- ARV (on-the-fly)
- $133,848
- Comps found
- 12
Show comp detail 12 sales within ~0.75 mi
| Address | Dist | Beds/Ba | Sqft | Sold | Price | $/sf | Match |
|---|---|---|---|---|---|---|---|
| 2720 Worden St | 0.61mi | 2/1.0 (-1) | 804 (+2%) | 2mo | $105,250 | $131 | 63 |
| 1312 E Broadway Ave | 0.50mi | 2/1.0 (-1) | 834 (+5%) | 6mo | $156,000 | $187 | 58 |
| 2847 Mc Dermott St | 0.38mi | 2/1.0 (-1) | 874 (+10%) | 3mo | $148,000 | $169 | 57 |
| 2754 Huizenga St | 0.28mi | 3/1.0 | 900 (+14%) | 9mo | $115,000 | $128 | 56 |
| 2921 Continental St | 0.17mi | 2/1.0 (-1) | 902 (+14%) | 13mo | $97,900 | $109 | 53 |
| 3142 Bailey St | 0.36mi | 2/1.0 (-1) | 832 (+5%) | 20mo | $175,000 | $210 | 53 |
| 2748 Valk St | 0.52mi | 2/1.0 (-1) | 690 (-13%) | 4mo | $110,000 | $159 | 46 |
| 2731 Valk St | 0.50mi | 2/1.0 (-1) | 680 (-14%) | 4mo | $152,900 | $225 | 45 |
| 2698 Roberts St | 0.50mi | 2/1.0 (-1) | 700 (-12%) | 12mo | $118,500 | $169 | 42 |
| 3157 Woodcliffe Dr | 0.37mi | 3/2.0 | 896 (+13%) | 18mo | $140,000 | $156 | 42 |
| 2694 Worden St | 0.63mi | 2/1.0 (-1) | 836 (+6%) | 20mo | $95,900 | $115 | 40 |
| 1480 E Summit Ave | 0.65mi | 2/1.0 (-1) | 675 (-15%) | 16mo | $116,000 | $172 | 26 |
Match score weights: distance 35% · size 25% · config 20% · recency 20%. Top-matched comps best support the ARV.
Projected returns pro-forma
-3.0% appreciation · 3.0% rent growth · sell at horizon
- IRR
- -11.9%
- Equity multiple
- 0.57×
- Total profit
- $-15,488
- Equity at exit
- $19,070
- IRR
- -2.7%
- Equity multiple
- 0.81×
- Total profit
- $-6,633
- Equity at exit
- $11,058
Cash invested: $35,812 (down + closing). Projections, not guarantees.
Landlord ↔ Tenant lean methodology
- Overall (STATE)
- 62 Landlord-Friendly
- State Michigan
- 62 Landlord-Friendly · EVEN
- County
- — inherits STATE
- City
- — inherits STATE
ZIP-level market 49444
- Active inventory
- 239
- Price-to-rent
- 8.4×
Monthly cashflow live
- Estimated rent
- $1,264 medium interval (Pro) →
- Mortgage (P&I)
- −$671
- Tax from tax record
- −$193 /mo · $2,312/yr
- Insurance
- −$53
- HOA
- −$0
- Vacancy / Maint / Mgmt
- −$265
- Net cashflow
- $82
Break-even live
Sensitivity live
| Price | -10% $154 | -5% $118 | +0% $82 | +5% $45 | +10% $9 |
|---|---|---|---|---|---|
| Rent | -10% $-18 | -5% $32 | +0% $82 | +5% $132 | +10% $181 |
| Rate | -1.0pp $146 | -0.5pp $114 | base $82 | +0.5pp $48 | +1.0pp $15 |
UW: 25.0% down · 7.5% · 30yr · 1.5% tax · 5.0% vac · 8.0% maint · 8.0% mgmt
Financing live
Cash to close
- Down payment
- $31,975
- Closing costs
- $3,837
- Reserves months
- —
- Total cash needed
- —
Loan-product check · same deal, 3 products live
Conventional
25% down · 7.5% · 30yr
- Down + closing
- —
- Monthly P&I
- —
- Monthly cashflow
- —
- DSCR
- —
- Eligible?
- —
Personal DTI + credit; lowest rate.
DSCR
20% down · 8.5% · 30yr
- Down + closing
- —
- Monthly P&I
- —
- Monthly cashflow
- —
- DSCR
- —
- Eligible?
- —
No personal income docs; deal must DSCR.
Hard money
10% down · 12.0% · 12mo
- Down + closing
- —
- Monthly P&I
- —
- Monthly cashflow
- —
- DSCR
- —
- Eligible?
- —
Short-term bridge; refi at stabilization.
Rent comps 2 comps
| Address | Beds | Baths | Sqft | Rent | $/sqft | DOM | Units | Dist |
|---|---|---|---|---|---|---|---|---|
| 3223 Bailey St Norton Shores, MI | 2.0–3.0 | 2.0 | 1096 | $1,319 | $1.20 | 23d | 1 | 0.37mi |
| 232 E Lincoln Ave Muskegon, MI | 2.0 | 1.0 | 1020 | $1,100 | $1.08 | 23d | 1 | 0.90mi |
Listing history 37 events
-
2026-06-21days on market $127,900 Active 23 DOM
-
2026-06-19days on market $127,900 Active 21 DOM
-
2026-06-18days on market $127,900 Active 20 DOM
-
2026-06-17days on market $127,900 Active 19 DOM
-
2026-06-16days on market $127,900 Active 18 DOM
-
2026-06-15days on market $127,900 Active 17 DOM
-
2026-06-14days on market $127,900 Active 15 DOM
-
2026-06-13days on market $127,900 Active 14 DOM
-
2026-06-10days on market $127,900 Active 12 DOM
-
2026-06-09days on market $127,900 Active 11 DOM
-
2026-06-08days on market $127,900 Active 10 DOM
-
2026-06-07days on market $127,900 Active 9 DOM
-
2026-06-05days on market $127,900 Active 6 DOM
-
2026-06-03days on market $127,900 Active 5 DOM
-
2026-06-02days on market $127,900 Active 4 DOM
-
2026-06-01days on market $127,900 Active 3 DOM
-
2026-05-31days on market $127,900 Active 2 DOM
-
2026-05-29$127,900 Active 291-char remark
Show marketing remark (292 chars)
3 bedroom in Norton Shores! Just minutes away from the highway, this home is currently priced under market value. Nice fenced in back yard and detached garage. Located across the street from the Getty Drive-In movie theatre. Home is in need of some TLC but is a great value for the location.
-
2026-05-29$127,900 Active 292-char remark
Show marketing remark (292 chars)
3 bedroom in Norton Shores! Just minutes away from the highway, this home is currently priced under market value. Nice fenced in back yard and detached garage. Located across the street from the Getty Drive-In movie theatre. Home is in need of some TLC but is a great value for the location.
-
2026-05-29$127,900 Active
Show marketing remark (292 chars)
3 bedroom in Norton Shores! Just minutes away from the highway, this home is currently priced under market value. Nice fenced in back yard and detached garage. Located across the street from the Getty Drive-In movie theatre. Home is in need of some TLC but is a great value for the location.
-
2026-05-15historical
-
2026-05-08price $109,900
-
2026-05-08price $109,900
-
2026-05-08price $109,900
-
2026-04-19$119,900 Active
-
2026-04-19$119,900 Active
-
2021-03-18soldstatus $89,000
-
2021-03-15soldstatus $89,000 Sold
-
2021-03-15soldstatus $89,000 Sold
-
2021-01-24status Pending
-
2021-01-24status Pending
-
2021-01-21price $89,500
-
2021-01-21price $89,500
-
2020-12-04$94,500 Active
-
2020-12-04$94,500 Active
-
2020-12-04$89,500
-
1995-03-17soldstatus $29,900
ⓘ Source: listings_history table (triggers on properties + properties_extension) + one-shot
backfill from property_details.listing_events for pre-trigger history.
Tax reassessment forecast MI · Partial reset (capped growth)
- Current annual tax
- $2,312 · $193/mo
- Projected year-2 tax
- $2,312 · $193/mo
- Expected delta
- $0/yr ($0/mo · 0.0%)
ⓘ Screening estimate from a state-policy table — verify with the county assessor before closing.
Climate risk First Street
- Flood 1/10 Low FEMA zone X (unshaded) · 0% chance over 30 yrs
- Wildfire 1/10 Low
- Heat 2/10 Low 7 d/yr ≥93°F today · 15 d/yr by 30 yrs out
- Wind 1/10 Low
- Air quality 4/10 Moderate 4 unhealthy d/yr today · 6 by 30 yrs out
Nearby sold comps map
Loading sold comps map…
Walkable amenities ~0.75 mi
Loading nearby amenities…
Taxation est. · year 1
- Rental income
- $15,165
- − Mortgage interest
- −$7,164
- − Property taxes
- −$2,312
- − Insurance
- −$640
- − Repairs & maintenance
- −$1,213
- − Management
- −$1,213
- − Depreciation
- −$3,721
- Taxable loss
- −$1,099
- Est. tax savings @ 24.0%
- +$264
- After-tax cash flow
- $1,243/yr
For passive investors: Depreciation is non-cash, so a rental often shows a tax loss while cash-flowing — sheltering income. Rental losses are passive: they offset passive income freely, and up to $25,000/yr can offset ordinary (W-2) income if you actively participate and your MAGI is under $100k (phasing out to $0 by $150k); unused losses carry forward. On sale, claimed depreciation is recaptured at up to 25%, and gains may owe capital-gains tax (a 1031 exchange can defer both). Figures are a year-1 estimate at your 24.0% rate — not tax advice; consult a CPA.
Schools (NCES district)
- District
- Muskegon Public Schools Of The City Of
- NCES district ID
- 2624840
- Math proficiency
- 4% ▼ -9.00%
- Reading proficiency
- 12% ▼ -9.00%
- Median HH income
- $27,622
- Composite
- 5.8/100
- National rank
- #10017
- State rank
- #534 of 540 in MI
Livability — Norton Shores
- Score
- 70/100
- State rank
- #310
- US rank
- #7620
Category grades
Schools grade is shown separately in the Schools card above.
Census & demographics
- Census place
- Norton Shores, MI
- County
- Muskegon County · 107,917 people
- City population
- 26,372
- Metro
- Muskegon, MI
- Population (ZIP)
- 26,372
- Household income
- $53,054
- Rent vs Own
- Severe rent burden
- 930.0
Population outlook (Muskegon County) Hauer SSP2
- Today (2025)
- 174,032 people
- By 2030
- 173,365 · -0.4%
- By 2040
- 168,877 · -3.0%
- By 2050
- 160,306 · -7.9%
- By 2075
- 134,426 · -22.8%
- By 2100
- 98,836 · -43.2%
Race, ethnicity, and origin ACS 2023
- Neighborhood character
- Diverse neighborhood (Simpson 0.55)
- Race & ethnicity
- White 59% Black 31% Two or more races 6% Hispanic / Latino 4% Native American 1%
- Common ancestry
- Iranian 6% Romanian 4% Lithuanian 2%
- Foreign-born
- 1% · Canada
- Languages at home
- 97% English-only · Spanish 2%
Political lean MEDSL · Muskegon
- 2024 margin
- Toss-up / Even · D 48.4% · R 50.2% · Other 1.5%
- 2008→2024 swing
- -31.1pp toward R · 2008: 29.3pp · 2024: -1.8pp
- All cycles
- 2024: R+1.8 2020: D+0.6 2016: D+0.9 2012: D+17.8 2008: D+29.3
Not yet ingested
- Civics
- —
Market trends
- HPI YoY
- ▼ -150.02%
- Current HPI
- 209.2698
- Rent YoY
- —
- Metro
- Muskegon, MI
- State GDP YoY
- ▲ 1.37%
- F500 in state
- 28
Industry mix (Fortune 500 HQ in MI)
| Industry | F500 HQs | Revenue |
|---|---|---|
| Automotive Parts | 3 | $48B |
|
||
| Automotive | 2 | $372B |
|
||
| Chemicals | 1 | $45B |
|
||
| Automotive Retail | 1 | $29B |
|
||
| Healthcare / Medical Devices | 1 | $23B |
|
||
| Automotive Technology | 1 | $20B |
|
||
Price history
+327.8% since first listed20 events — show timeline
- 2026-05-29 Listed $127,900 SW Michigan MLS
- 2026-05-29 Listed $127,900 REALCOMP
- 2026-05-29 Listed $127,900 MiRealSource-MiMLS
- 2026-05-15 Listing Removed — MiRealSource-MiMLS
- 2026-05-08 Price Changed $109,900 MiRealSource-MiMLS
- 2026-05-08 Price Changed $109,900 REALCOMP
- 2026-05-08 Price Changed $109,900 SW Michigan MLS
- 2026-04-19 Listed $119,900 REALCOMP
- 2026-04-19 Listed $119,900 MiRealSource-MiMLS
- 2021-03-18 Sold (Public Records) $89,000 Public Records
- 2021-03-15 Sold (MLS) $89,000 SW Michigan MLS
- 2021-03-15 Sold (MLS) $89,000 REALCOMP
- 2021-01-24 Pending — REALCOMP
- 2021-01-24 Pending — SW Michigan MLS
- 2021-01-21 Price Changed $89,500 REALCOMP
- 2021-01-21 Price Changed $89,500 SW Michigan MLS
- 2020-12-04 Listed $89,500 MiRealSource-MiMLS
- 2020-12-04 Listed $94,500 SW Michigan MLS
- 2020-12-04 Listed $94,500 REALCOMP
- 1995-03-17 Sold (Public Records) $29,900 Public Records
Property tax history
+13.5%/yrLatest (2025): $2,312 · +39.9% YoY. Source: county tax records.
Cash-flow waterfall
monthlySold comps — $/sqft
last 12 mo · ≤1 miLoading sold comps…