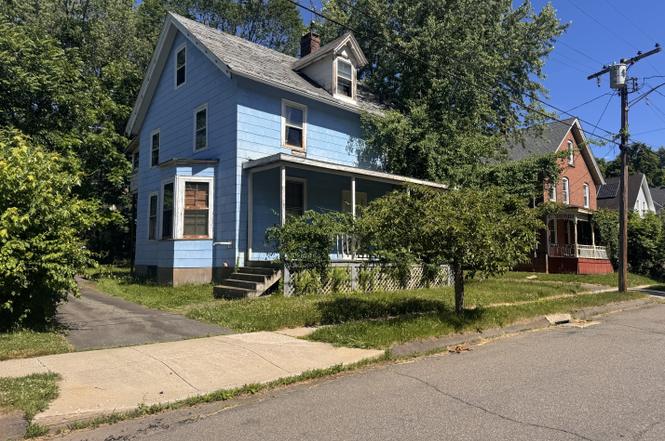
7 Evergreen Ave · Middletown, CT
Flood risk 1/10 · Minimal
- FEMA flood zone
- X (unshaded)
- Chance of flooding over 30 yrs
- 0.0%
- Est. flood insurance / yr
- $473 – $860
Fire risk 1/10 · Minimal
- Est. fire insurance / yr
- $829 – $1,539
Heat risk 6/10 · Moderate
- Hot days now (above 96°F)
- 7 days/yr
- Hot days in 30 yrs
- 16 days/yr
Wind risk 6/10 · Moderate
- Chance of severe wind over 30 yrs
- 27.0%
Air-quality risk 3/10 · Minor
- Unhealthy air days now
- 3 days/yr
- Unhealthy air days in 30 yrs
- 4 days/yr
Risk factors via First Street. Map © Google.
Why this score? — see what drove the B- grade
The composite is a weighted blend of 9 inputs, each scored 0–100. Each bar is that input's sub-score; the figure is the points it added to the 100-point composite (weight × sub-score).
- Cash flow +30.0/30.0
- 1% rule +10.0/10.0
- DSCR +10.0/10.0
- ARV discount +7.5/15.0
- Livability +4.0/5.0
- Schools +3.0/10.0
- Rent growth +2.6/5.0
- Condition / age +2.5/5.0
- Appreciation +0.0/10.0
$149,000
🖨 Deal sheet 📄 Offer letter ✓ Due diligence
Listing remarks
Investor opportunity with great potential on a charming street. This property has been substantially gutted and requires a complete renovation, including plumbing, HVAC, windows, roof, and repairs related to a roof leak. The layout offers excellent possibilities, with an open floorplan- high ceilings on the first floor and area for a full bath or laundry, three to four bedrooms on second floor, and a walk-up attic that may offer additional living space. Ideal for investors, contractors, or experienced renovators looking for their next project. CASH SALE ONLY. Proof of funds required for all offers. Property is being sold strictly as-is with all contents inside. DUE TO THE CONDITION OF THE H
Key facts
- 7,405 sq ft lot
- Built 1900
Property features AI
Exterior
- Utilities: Public water connected; Public sewer connected; Gas in street (heat fuel)
- Home design: Single-family home
- Construction: Frame construction; Asbestos siding; Concrete and masonry foundation; Asphalt shingle roof
- Exterior features: Balcony; Covered deck; Level, cleared lot
Interior
- Bedrooms: 4 bedrooms
- Bathrooms: 1 full bathroom
- Heating & cooling: Baseboard heating; No hot water
- Interior features: Open floor plan; Full unfinished basement with interior access, concrete floor, and full hatchway; Attic is floored with a walk-up
- Laundry & utility: Laundry room on the lower level
Neighborhood map
What this means for you Summary
Snapshot
- This is a 4-bed/1.0-bath single-family listed at $149k.
Deal economics
- At list price, monthly cash flow is $963 ($12k/yr) — positive.
- The deal already cash-flows at list — no discount required.
- Meets the 1% rule at list price ($3k rent vs $149k).
- Cap rate 14.0% vs local median 3.7% in Middletown — top-decile yield for the area; either an underpriced asset or a hidden risk that comps aren't pricing in. Stress-test before assuming the spread holds.
Location & tenants
- Location reads 81/100 on livability (#17 in CT, #1,390 nationally) — a professional / high-income tenant draw. Strengths: crime A+, amenities A+, health & safety A+; Watch: commute F.
- Middletown School District (urban): math 24% / reading 44% proficiency, ranked #113 of 153 in CT (top 74%) — families likely to look elsewhere, expect single-tenant / working-renter base with shorter leases.
- Market conditions: Rents flat; 143 active listings in the ZIP; 9 comparable units currently listed for rent nearby; rentals at typical pace (median 24d on market — plan ~3-4 weeks tenant-placement turnaround); solid renter incomes; 278 units permitted in Lower Connecticut River Valley Planning Region in 2024 (89 in 5+ unit buildings).
- This rent runs 39% of the median local income ($79k/yr) — at the standard rent-burdened threshold; future hikes will face affordability resistance.
Forward outlook
- Local home prices are declining (-3.0%/yr); year-one equity from $1k of loan paydown is wiped out by about $4k of value loss. Plan a longer hold.
- At projected returns (-3.0% appreciation + 0.2% rent growth), your $42k cash investment doubles in ~5 years — after that, you're playing with house money.
Negotiation context
- Only 1 days on market — expect competitive offers; lowballing is unlikely to land.
- 2 sale attempts with the ask held roughly flat each time — persistent listings suggest the price (not the market) is what's stuck; bring a comps-based counter.
- Current owner paid $35k; list at $149k implies a 326% gain — meaningful room to come down on a strong offer.
Risks & watch-outs
- Watch-outs: built in 1900 — expect roof / HVAC / electrical / plumbing capex.
- Climate carrying-cost: major wind risk, 27% chance of damaging wind over 30y; extreme-heat days projected 7→16/yr by 2055 (HVAC capex compounding) — expect insurance premiums to compound above CPI over the hold.
Questions for the listing agent
- Built in 1900 — when were the roof, HVAC, electrical panel, plumbing, and water heater last replaced?
- Is there a deadline driving the sale (1031 exchange, divorce, estate, relocation)? That informs how much negotiation room exists.
- What's the average days-on-market for RENTAL listings here right now (not sales)? A rising rental-DOM trend means longer vacancies and softer asking-rent achievability than the comps imply.
- What's the recent tenant-quality profile in this submarket — average credit score on applications, eviction rate, late-payment / NSF rate, and stable-employment percentage? A property-management company in the area should have these aggregated.
- How much new for-sale + rental construction is in the pipeline within 1–3 miles? Heavy new supply typically softens prices + rents 12–24 months out; constrained supply supports both.
Investment metrics
- 1% rule
- 1.72% ✓
- Cap rate
- 14.05%
- Cash-on-cash
- 27.70%
- DSCR
- 2.23
- GRM
- 4.8
CMA / ARV
- ARV (on-the-fly)
- $358,295
- Comps found
- 12
Show comp detail 12 sales within ~0.75 mi
| Address | Dist | Beds/Ba | Sqft | Sold | Price | $/sf | Match |
|---|---|---|---|---|---|---|---|
| 43 Silver St | 0.09mi | 3/3.0 (-1) | 1,654 (-6%) | 6mo | $370,000 | $224 | 67 |
| 47 Silver St | 0.08mi | 4/2.0 | 1,995 (+13%) | 4mo | $400,000 | $201 | 67 |
| 30 Denison Rd | 0.26mi | 4/2.0 | 1,600 (-9%) | 6mo | $415,000 | $259 | 63 |
| 8 Macdonough Pl | 0.60mi | 3/1.5 (-1) | 1,740 (-1%) | 1mo | $384,000 | $221 | 62 |
| 32 Burr Ave | 0.61mi | 4/2.0 | 1,854 (+5%) | 1mo | $377,000 | $203 | 59 |
| 171 Eastern Dr | 0.27mi | 3/1.5 (-1) | 1,624 (-8%) | 16mo | $341,000 | $210 | 54 |
| 109 Warner Ave #109 | 0.47mi | 3/2.5 (-1) | 1,807 (+2%) | 17mo | $340,000 | $188 | 49 |
| 217 Ridge Rd | 0.72mi | 3/1.5 (-1) | 1,887 (+7%) | 2mo | $350,000 | $185 | 46 |
| 4 Glynn Ave | 0.73mi | 3/1.5 (-1) | 1,944 (+10%) | 10mo | $314,000 | $162 | 34 |
| 49 Andrew St | 0.60mi | 3/2.0 (-1) | 1,526 (-14%) | 14mo | $382,000 | $250 | 29 |
| 100 Russell St | 0.67mi | 3/2.0 (-1) | 1,607 (-9%) | 19mo | $320,000 | $199 | 29 |
| 187 Ridge Rd | 0.65mi | 3/2.0 (-1) | 1,956 (+11%) | 19mo | $350,000 | $179 | 27 |
Match score weights: distance 35% · size 25% · config 20% · recency 20%. Top-matched comps best support the ARV.
Projected returns pro-forma
-3.0% appreciation · 0.22% rent growth · sell at horizon
- IRR
- 18.6%
- Equity multiple
- 1.73×
- Total profit
- $30,256
- Equity at exit
- $22,216
- IRR
- 24.9%
- Equity multiple
- 2.88×
- Total profit
- $78,432
- Equity at exit
- $12,883
Cash invested: $41,720 (down + closing). Projections, not guarantees.
Landlord ↔ Tenant lean methodology
- Overall (STATE)
- 27 Tenant-Leaning
- State Connecticut
- 27 Tenant-Leaning · D+7
- County
- — inherits STATE
- City
- — inherits STATE
ZIP-level market 06457
- Rents YoY
- 0.2%
- Active inventory
- 143
- Price-to-rent
- 4.8×
Monthly cashflow live
- Estimated rent
- $2,569 high interval (Pro) →
- Mortgage (P&I)
- −$781
- Tax from tax record
- −$223 /mo · $2,676/yr
- Insurance
- −$62
- HOA
- −$0
- Vacancy / Maint / Mgmt
- −$539
- Net cashflow
- $963
Break-even live
UW: 25.0% down · 7.5% · 30yr · 1.5% tax · 5.0% vac · 8.0% maint · 8.0% mgmt
Financing live
Cash to close
- Down payment
- $37,250
- Closing costs
- $4,470
- Reserves months
- —
- Total cash needed
- —
Loan-product check · same deal, 3 products live
Conventional
25% down · 7.5% · 30yr
- Down + closing
- —
- Monthly P&I
- —
- Monthly cashflow
- —
- DSCR
- —
- Eligible?
- —
Personal DTI + credit; lowest rate.
DSCR
20% down · 8.5% · 30yr
- Down + closing
- —
- Monthly P&I
- —
- Monthly cashflow
- —
- DSCR
- —
- Eligible?
- —
No personal income docs; deal must DSCR.
Hard money
10% down · 12.0% · 12mo
- Down + closing
- —
- Monthly P&I
- —
- Monthly cashflow
- —
- DSCR
- —
- Eligible?
- —
Short-term bridge; refi at stabilization.
Rent comps 9 comps
| Address | Beds | Baths | Sqft | Rent | $/sqft | DOM | Units | Dist |
|---|---|---|---|---|---|---|---|---|
| 32 Wall St Unit 2 Middletown, CT | 3.0 | 1.0 | 2081 | $2,400 | $1.15 | 43d | 1 | 0.14mi |
| 73 Silver St Middletown, CT | 4.0 | 2.0 | 1322 | $2,500 | $1.89 | 23d | 1 | 0.23mi |
| 27 Woodside Cir Unit 37 Middletown, CT | 3.0 | 2.0 | 1600 | $2,300 | $1.44 | 43d | 1 | 0.66mi |
| 177 Russell St Unit 2 Middletown, CT | 3.0 | 3.0 | 2000 | $2,200 | $1.10 | 23d | 1 | 0.79mi |
| 505 Main St Middletown, CT | 3.0 | 2.0 | 1263 | $2,000 | $1.58 | 1d | 1 | 1.10mi |
| 57 Ferry St Unit 1 Middletown, CT | 3.0 | 1.5 | 1500 | $2,000 | $1.33 | 10d | 1 | 1.11mi |
| 200 Main St Unit 1 Portland, CT | 3.0 | 2.0 | 1300 | $2,227 | $1.71 | 1d | 1 | 1.50mi |
| 200 Main St Unit 1 Portland, CT | 3.0 | 2.0 | 1300 | $2,227 | $1.71 | 10d | 1 | 1.50mi |
| 103 Spring St Middletown, CT | 4.0 | 1.0 | 1602 | $2,500 | $1.56 | 43d | 1 | 1.50mi |
Listing history 2 events
-
2026-06-19remarks 699-char remark
-
2026-06-19$149,000 Active 1 DOM
ⓘ Source: listings_history table (triggers on properties + properties_extension) + one-shot
backfill from property_details.listing_events for pre-trigger history.
Tax reassessment forecast CT · Partial reset (capped growth)
- Current annual tax
- $2,676 · $223/mo
- Projected year-2 tax
- $2,932 · $244/mo
- Expected delta
- +$256/yr (+$21/mo · 9.6%)
ⓘ Screening estimate from a state-policy table — verify with the county assessor before closing.
Climate risk First Street
- Flood 1/10 Low FEMA zone X (unshaded) · 0% chance over 30 yrs
- Wildfire 1/10 Low
- Heat 6/10 Major 7 d/yr ≥96°F today · 16 d/yr by 30 yrs out
- Wind 6/10 Major 27% chance of damaging wind over 30 yrs
- Air quality 3/10 Moderate 3 unhealthy d/yr today · 4 by 30 yrs out
Nearby sold comps map
Loading sold comps map…
Walkable amenities ~0.75 mi
Loading nearby amenities…
Taxation est. · year 1
- Rental income
- $30,826
- − Mortgage interest
- −$8,346
- − Property taxes
- −$2,676
- − Insurance
- −$745
- − Repairs & maintenance
- −$2,466
- − Management
- −$2,466
- − Depreciation
- −$4,335
- Taxable income
- $9,792
- Est. tax owed @ 24.0%
- −$2,350
- After-tax cash flow
- $9,205/yr
For passive investors: Depreciation is non-cash, so a rental often shows a tax loss while cash-flowing — sheltering income. Rental losses are passive: they offset passive income freely, and up to $25,000/yr can offset ordinary (W-2) income if you actively participate and your MAGI is under $100k (phasing out to $0 by $150k); unused losses carry forward. On sale, claimed depreciation is recaptured at up to 25%, and gains may owe capital-gains tax (a 1031 exchange can defer both). Figures are a year-1 estimate at your 24.0% rate — not tax advice; consult a CPA.
Schools (NCES district)
- District
- Middletown School District
- NCES district ID
- 0902490
- Math proficiency
- 24% ▼ -15.00%
- Reading proficiency
- 44% ▼ -8.00%
- Median HH income
- $60,733
- Composite
- 30.47/100
- National rank
- #6224
- State rank
- #113 of 153 in CT
Livability — Middletown
- Score
- 81/100
- State rank
- #17
- US rank
- #1390
Category grades
Schools grade is shown separately in the Schools card above.
Census & demographics
- Census place
- Middletown, CT
- County
- Middlesex County · 63,941 people
- City population
- 46,720
- Metro
- Hartford-East Hartford-Middletown, CT
- Population (ZIP)
- 46,720
- Household income
- $79,463
- Rent vs Own
- Severe rent burden
- 2196.0
Population outlook (Lower Connecticut River Valley County) Hauer SSP2
- By 2040
- 188,651
Race, ethnicity, and origin ACS 2023
- Neighborhood character
- Majority White (65%)
- Race & ethnicity
- White 65% Black 13% Hispanic / Latino 12% Two or more races 9% Asian 5%
- Hispanic origin (detail)
- Mexican 1% Puerto Rican 7%
- Common ancestry
- Romanian 9% Lithuanian 5% Slovak 2%
- Foreign-born
- 12% · Canada, China
- Languages at home
- 82% English-only · Spanish 6% Other Indo-European 4% Russian/Polish/Slavic 2%
Political lean MEDSL · Lower Connecticut River Valley
- 2024 margin
- D (+13.4) · D 55.9% · R 42.4% · Other 1.7%
- All cycles
- 2024: D+13.4
Not yet ingested
- Civics
- —
Market trends
- HPI YoY
- ▼ -470.20%
- Current HPI
- 255.1597
- Rent YoY
- ▲ 0.22%
- Metro
- Hartford-East Hartford-Middletown, CT
- State GDP YoY
- ▲ 1.06%
- F500 in state
- 38
Industry mix (Fortune 500 HQ in CT)
| Industry | F500 HQs | Revenue |
|---|---|---|
| Industrial Machinery | 4 | $38B |
|
||
| Insurance | 3 | $71B |
|
||
| Financial Services | 2 | $25B |
|
||
| Transportation / Logistics | 2 | $18B |
|
||
| Healthcare | 1 | $247B |
|
||
| Telecommunications | 1 | $55B |
|
||
Price history
+325.7% since first listed4 events — show timeline
- 2026-06-17 Listed $149,000 Smart MLS
- 2026-04-22 Listing Removed — Smart MLS
- 2026-03-30 Listed $149,500 Smart MLS
- 2003-01-02 Sold (Public Records) $35,000 Public Records
Property tax history
+0.3%/yrLatest (2022): $2,676 · +0.5% YoY. Source: county tax records.
Cash-flow waterfall
monthlySold comps — $/sqft
last 12 mo · ≤1 miLoading sold comps…