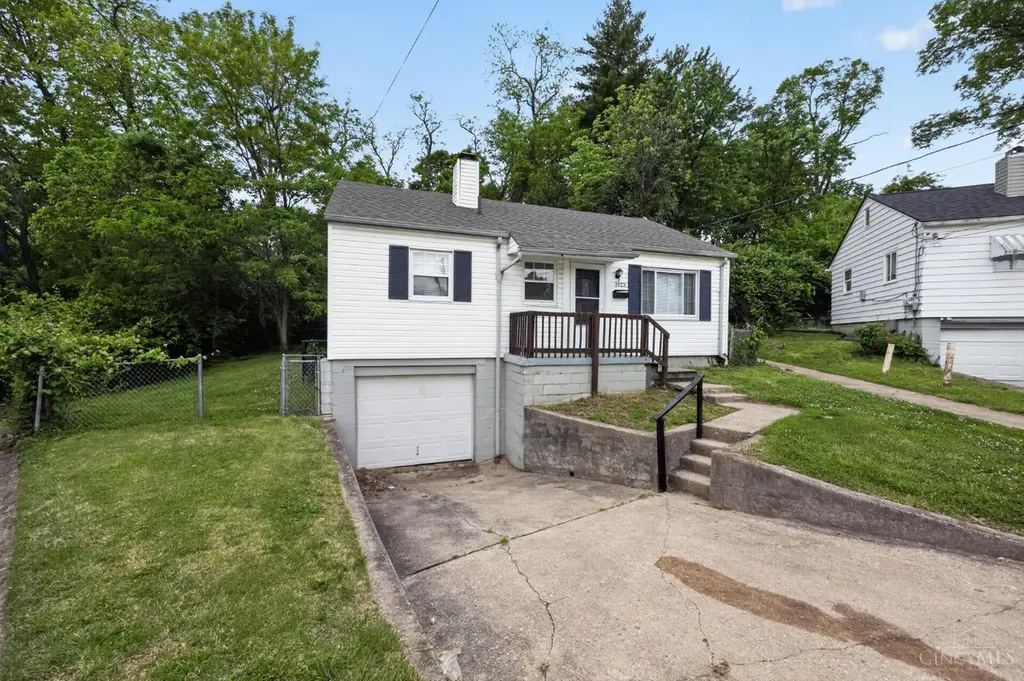
1923 Ashbrook Dr · Cincinnati, OH
Flood risk 1/10 · Minimal
- FEMA flood zone
- X (unshaded)
- Chance of flooding over 30 yrs
- 0.0%
- Est. flood insurance / yr
- $473 – $860
Fire risk 1/10 · Minimal
- Est. fire insurance / yr
- $713 – $1,323
Heat risk 4/10 · Minor
- Hot days now (above 103°F)
- 7 days/yr
- Hot days in 30 yrs
- 19 days/yr
Wind risk 2/10 · Minimal
- Chance of severe wind over 30 yrs
- 1.0%
Air-quality risk 3/10 · Minor
- Unhealthy air days now
- 3 days/yr
- Unhealthy air days in 30 yrs
- 5 days/yr
Risk factors via First Street. Map © Google.
Why this score? — see what drove the C grade
The composite is a weighted blend of 9 inputs, each scored 0–100. Each bar is that input's sub-score; the figure is the points it added to the 100-point composite (weight × sub-score).
- Cash flow +19.1/30.0
- ARV discount +15.0/15.0
- DSCR +6.0/10.0
- 1% rule +5.1/10.0
- Livability +4.0/5.0
- Rent growth +3.7/5.0
- Schools +2.5/10.0
- Condition / age +2.5/5.0
- Appreciation +0.0/10.0
$134,900
🖨 Deal sheet (PDF) 📄 Offer letter ✓ Due diligence
Listing remarks MLS
HUD owned case#411-352676 Agents! See info re status at agent remarks.Bid online only/Sold as is/MLS info believed accurate, not guaranteed. Buyer must rely on own inspection. UI-FHA financ not avail try 203k.
Key facts
- Updated ranch
- Gourmet kitchen
- Full basement
Tags
Property features AI
Finance
- HOA & community: No homeowners association
Exterior
- Parking: Built-in front garage with 1 garage space
- Utilities: Public water; Public sewer; Natural gas
- Home design: Traditional single-family home; One level
- Construction: Shingle roof; Block foundation
- Exterior features: Insulated windows; Vinyl siding
Interior
- Kitchen: Laminate flooring in kitchen; Kitchen window treatments; Oven/Range; Refrigerator
- Bedrooms: Three bedrooms on main level (Primary approx. 12 x 12; Bedroom 2 approx. 12 x 9; Bedroom 3 approx. 12 x 8)
- Flooring: Wood floors in living area; Laminate floors in kitchen
- Bathrooms: One full bathroom on main level
- Heating & cooling: Forced air heating (gas); Gas water heating
- Interior features: Window treatments throughout; Unfinished full basement; Five total rooms
- Laundry & utility: Basement utility space (unfinished)
Neighborhood map
What this means for you Summary
Snapshot
- This is a 2-bed/2.0-bath single-family listed at $135k.
Deal economics
- At list price, monthly cash flow is $142 ($2k/yr) — positive.
- The deal already cash-flows at list — no discount required.
- Meets the 1% rule at list price ($1k rent vs $135k).
- Recommended offer: $131k (3.0% below list) — sets the bar for market timing.
- Cap rate 7.6% vs local median 3.9% in Cincinnati — top-decile yield for the area; either an underpriced asset or a hidden risk that comps aren't pricing in. Stress-test before assuming the spread holds.
Location & tenants
- Location reads 80/100 on livability (#130 in OH, #1,856 nationally) — a professional / high-income tenant draw. Strengths: amenities A+, commute A+, cost of living A+; Watch: employment D, crime F.
- Cincinnati Public Schools (urban): math 25% / reading 36% proficiency, ranked #581 of 656 in OH (top 89%) — families likely to look elsewhere, expect single-tenant / working-renter base with shorter leases; 70% free/reduced lunch — lower-income household profile, screen leases tightly.
- Market conditions: Rents rising fast (+4.9%/yr); 78 active listings in the ZIP; 32 comparable units currently listed for rent nearby; rentals at typical pace (median 21d on market — plan ~3-4 weeks tenant-placement turnaround); 801 units permitted in Hamilton County in 2024 (190 in 5+ unit buildings).
Forward outlook
- Local home prices are declining (-3.0%/yr); year-one equity from $933 of loan paydown is wiped out by about $4k of value loss. Plan a longer hold.
Negotiation context
- It's been on market 41 days — a 3% lower offer ($131k) is reasonable based on typical stale-listing flexibility.
- 7 sale attempts since 27y ago; this cycle's ask has dropped $10k (7%) from the opening price — seller is motivated, your offer sets the floor, not the list.
- Current owner paid $90k; 50% above their basis — modest negotiation headroom, anchor on the comps not their cost.
Risks & watch-outs
- Watch-outs: built in 1947 — expect roof / HVAC / electrical / plumbing capex.
Questions for the listing agent
- It's been on market 41 days. Have you received any prior offers? Is the seller open to a 3% concession, seller financing, or rate buy-down credit?
- Built in 1947 — when were the roof, HVAC, electrical panel, plumbing, and water heater last replaced?
- Is there a deadline driving the sale (1031 exchange, divorce, estate, relocation)? That informs how much negotiation room exists.
- Schools are B-rated — typically a magnet for longer-tenancy family renters. What's the average tenant stay here, and is there a school-zone premium baked into asking?
- Crime grade is F in this area — have there been break-ins, vandalism, or insurance claims at this property in the last 3 years? What carrier currently insures it and at what premium?
- What's the average days-on-market for RENTAL listings here right now (not sales)? A rising rental-DOM trend means longer vacancies and softer asking-rent achievability than the comps imply.
- What's the recent tenant-quality profile in this submarket — average credit score on applications, eviction rate, late-payment / NSF rate, and stable-employment percentage? A property-management company in the area should have these aggregated.
- How much new for-sale + rental construction is in the pipeline within 1–3 miles? Heavy new supply typically softens prices + rents 12–24 months out; constrained supply supports both.
Investment metrics
- 1% rule
- 1.01% ✓
- Cap rate
- 7.56%
- Cash-on-cash
- 4.52%
- DSCR
- 1.20
- GRM
- 8.3
CMA / ARV
- ARV (on-the-fly)
- $198,360
- Comps found
- 12
Show comp detail 12 sales within ~0.75 mi
| Address | Dist | Beds/Ba | Sqft | Sold | Price | $/sf | Match |
|---|---|---|---|---|---|---|---|
| 1702 Ashbrook Dr | 0.18mi | 3/1.0 (+1) | 1,369 (+0%) | 2mo | $139,900 | $102 | 81 |
| 1758 Tuxworth Ave | 0.23mi | 3/2.0 (+1) | 1,319 (-4%) | 3mo | $227,000 | $172 | 76 |
| 4925 Shirley Pl | 0.34mi | 3/2.0 (+1) | 1,456 (+6%) | 1mo | $230,000 | $158 | 68 |
| 1772 Tuxworth Ave | 0.25mi | 3/2.0 (+1) | 1,493 (+9%) | 0mo | $155,000 | $104 | 68 |
| 4998 Western Hills Ave | 0.56mi | 2/2.0 | 1,379 (+1%) | 7mo | $192,000 | $139 | 67 |
| 1147 Olivia Ln | 0.61mi | 3/2.0 (+1) | 1,334 (-2%) | 4mo | $194,000 | $145 | 59 |
| 3020 Veazey Ave | 0.58mi | 3/2.0 (+1) | 1,400 (+2%) | 7mo | $297,500 | $213 | 58 |
| 3124 Veazey Ave | 0.74mi | 3/2.0 (+1) | 1,361 (-0%) | 2mo | $210,000 | $154 | 58 |
| 2739 Westbrook Dr | 0.70mi | 3/1.5 (+1) | 1,467 (+7%) | 6mo | $115,000 | $78 | 43 |
| 4934 Relleum Ave | 0.44mi | 3/2.5 (+1) | 1,564 (+14%) | 7mo | $239,900 | $153 | 43 |
| 5052 Casa Loma Blvd | 0.60mi | 3/1.0 (+1) | 1,519 (+11%) | 6mo | $120,000 | $79 | 40 |
| 5252 Relluk Dr | 0.64mi | 3/1.5 (+1) | 1,550 (+13%) | 6mo | $221,000 | $143 | 36 |
Match score weights: distance 35% · size 25% · config 20% · recency 20%. Top-matched comps best support the ARV.
Projected returns pro-forma
-3.0% appreciation · 4.87% rent growth · sell at horizon
- IRR
- -7.2%
- Equity multiple
- 0.73×
- Total profit
- $-10,174
- Equity at exit
- $20,114
- IRR
- 4.7%
- Equity multiple
- 1.37×
- Total profit
- $13,985
- Equity at exit
- $11,664
Cash invested: $37,772 (down + closing). Projections, not guarantees.
Landlord ↔ Tenant lean methodology
- Overall (STATE)
- 73 Landlord-Friendly
- State Ohio
- 73 Landlord-Friendly · R+6
- County
- — inherits STATE
- City
- — inherits STATE
ZIP-level market 45238
- Rents YoY
- 4.9%
- Active inventory
- 78
- Price-to-rent
- 8.3×
Monthly cashflow live
- Estimated rent
- $1,358 high interval (Pro) →
- Mortgage (P&I)
- −$707
- Tax from tax record
- −$167 /mo · $2,001/yr
- Insurance
- −$56
- HOA
- −$0
- Vacancy / Maint / Mgmt
- −$285
- Net cashflow
- $142
Break-even live
Sensitivity live
| Price | -10% $219 | -5% $180 | +0% $142 | +5% $104 | +10% $66 |
|---|---|---|---|---|---|
| Rent | -10% $35 | -5% $89 | +0% $142 | +5% $196 | +10% $250 |
| Rate | -1.0pp $210 | -0.5pp $177 | base $142 | +0.5pp $107 | +1.0pp $72 |
UW: 25.0% down · 7.5% · 30yr · 1.5% tax · 5.0% vac · 8.0% maint · 8.0% mgmt
Financing live
Cash to close
- Down payment
- $33,725
- Closing costs
- $4,047
- Reserves months
- —
- Total cash needed
- —
Loan-product check · same deal, 3 products live
Conventional
25% down · 7.5% · 30yr
- Down + closing
- —
- Monthly P&I
- —
- Monthly cashflow
- —
- DSCR
- —
- Eligible?
- —
Personal DTI + credit; lowest rate.
DSCR
20% down · 8.5% · 30yr
- Down + closing
- —
- Monthly P&I
- —
- Monthly cashflow
- —
- DSCR
- —
- Eligible?
- —
No personal income docs; deal must DSCR.
Hard money
10% down · 12.0% · 12mo
- Down + closing
- —
- Monthly P&I
- —
- Monthly cashflow
- —
- DSCR
- —
- Eligible?
- —
Short-term bridge; refi at stabilization.
Rent comps 32 comps
| Address | Beds | Baths | Sqft | Rent | $/sqft | DOM | Units | Dist |
|---|---|---|---|---|---|---|---|---|
| 1723 Tuxworth Ave Cincinnati, OH | 3.0 | 2.0 | 1587 | $1,800 | $1.13 | 24d | 1 | 0.21mi |
| 2706 E Tower Dr Cincinnati, OH | 1.0–3.0 | 1.0–2.0 | 951 | $1,188 | $1.25 | 2d | 61 | 0.40mi |
| 2621 Gehrum Ln Cincinnati, OH | 3.0 | 1.0 | 1373 | $1,850 | $1.35 | 24d | 1 | 0.52mi |
| 3053 N Hegry Cir #1 Cincinnati, OH | 2.0 | 1.0 | 954 | $1,250 | $1.31 | 5d | 1 | 0.54mi |
| 2511 Ferguson Rd Unit 2537 Cincinnati, OH | 3.0 | 1.5 | 1100 | $1,650 | $1.50 | 24d | 1 | 0.60mi |
| 2969 Four Towers Dr Unit 2 Cincinnati, OH | 2.0 | 1.0 | 960 | $1,150 | $1.20 | 24d | 1 | 0.61mi |
| 2682 Lafeuille Cir Cincinnati, OH | 2.0–3.0 | 1.0–2.0 | 950 | $1,176 | $1.24 | 4d | 16 | 0.65mi |
| 2905 Queen City Ave Cincinnati, OH | 2.0 | 1.0 | 1000 | $1,350 | $1.35 | 5d | 1 | 0.66mi |
| 2905 Queen City Ave Unit 1 Cincinnati, OH | 2.0 | 1.0 | 900 | $1,350 | $1.50 | 24d | 1 | 0.66mi |
| 2598 Ferguson Rd Cincinnati, OH | 2.0 | 1.0 | 950 | $1,145 | $1.21 | 5d | 1 | 0.70mi |
| 5256 Ponce Ln Cincinnati, OH | 3.0 | 2.0 | 1270 | $1,866 | $1.47 | 2d | 1 | 0.73mi |
| 1240 Rosemont Ave Cincinnati, OH | 2.0 | 1.0 | 1280 | $1,100 | $0.86 | 21d | 1 | 0.95mi |
| 1224 Sliker Ave Cincinnati, OH | 1.0 | 1.0 | 950 | $850 | $0.89 | 5d | 1 | 0.96mi |
| 1872 Sunset Ave Cincinnati, OH | 2.0 | 1.0 | 888 | $1,075 | $1.21 | 5d | 7 | 0.96mi |
| 4370 Saint Lawrence Ave #1 Cincinnati, OH | 1.0 | 1.0 | 876 | $1,050 | $1.20 | 17d | 1 | 0.96mi |
| 1233 Dewey Ave Cincinnati, OH | 3.0 | 1.0 | 1411 | $1,375 | $0.97 | 5d | 1 | 0.98mi |
| 1214 Gilsey Ave Cincinnati, OH | 3.0 | 1.0 | 1300 | $1,300 | $1.00 | 21d | 1 | 1.07mi |
| 1214 Gilsey Ave Cincinnati, OH | 3.0 | 1.0 | 1300 | $1,300 | $1.00 | 24d | 1 | 1.07mi |
| 1057 Winfield Ave Unit 2 Cincinnati, OH | 2.0 | 1.0 | 1000 | $1,250 | $1.25 | 24d | 1 | 1.08mi |
| 1740 Minion Ave Cincinnati, OH | 2.0 | 1.0 | 1320 | $1,200 | $0.91 | 24d | 1 | 1.14mi |
| 1607 Minion Ave Cincinnati, OH | 3.0 | 1.5 | 1066 | $1,675 | $1.57 | 24d | 1 | 1.19mi |
| 3772 W Liberty St Cincinnati, OH | 3.0 | 1.0 | 1066 | $1,350 | $1.27 | 5d | 1 | 1.23mi |
| 4227 W 8th St Cincinnati, OH | 3.0 | 2.0 | 1832 | $2,050 | $1.12 | 2d | 1 | 1.25mi |
| 4244 Loubell Ln Cincinnati, OH | 1.0 | 1.0 | 900 | $895 | $0.99 | 24d | 1 | 1.27mi |
| 2747 McKinley Ave Fl 1 Cincinnati, OH | 1.0 | 1.0 | 900 | $895 | $0.99 | 22d | 1 | 1.29mi |
| 2356 Harrison Ave Cincinnati, OH | 2.0 | 1.0 | 900 | $1,000 | $1.11 | 24d | 1 | 1.33mi |
| 2860 Harrison Ave Apt 21 Cincinnati, OH | 2.0 | 1.5 | 950 | $1,000 | $1.05 | 21d | 1 | 1.34mi |
| 2532 Harrison Ave Unit 2217 02 Cincinnati, OH | 2.0 | 1.0 | 1000 | $1,250 | $1.25 | 24d | 1 | 1.34mi |
| 3666 Glenway Ave Cincinnati, OH | 3.0 | 1.0 | 1339 | $1,250 | $0.93 | 24d | 1 | 1.42mi |
| 2854 Shaffer Ave Unit 1 Cincinnati, OH | 2.0 | 1.0 | 1100 | $1,125 | $1.02 | 14d | 1 | 1.42mi |
| 4284 Foley Rd Cincinnati, OH | 3.0 | 2.0 | 1242 | $2,800 | $2.25 | 44d | 1 | 1.49mi |
| 3052 Worthington Ave Cincinnati, OH | 3.0 | 1.0 | 1105 | $1,195 | $1.08 | 5d | 1 | 1.49mi |
Listing history 31 events
-
2026-06-18price $134,900 Active 41 DOM
-
2026-06-18days on market $144,900 Active 41 DOM
-
2026-06-17days on market $144,900 Active 40 DOM
-
2026-06-16days on market $144,900 Active 39 DOM
-
2026-06-15days on market $144,900 Active 38 DOM
-
2026-06-13days on market $144,900 Active 36 DOM
-
2026-06-13days on market $144,900 Active 35 DOM
-
2026-06-09days on market $144,900 Active 32 DOM
-
2026-06-08days on market $144,900 Active 31 DOM
-
2026-06-07days on market $144,900 Active 30 DOM
-
2026-06-03days on market $144,900 Active 26 DOM
-
2026-06-02days on market $144,900 Active 25 DOM
-
2026-06-01days on market $144,900 Active 24 DOM
-
2026-05-31days on market $144,900 Active 23 DOM
-
2026-05-08$144,900 Active
-
2022-01-20soldstatus $90,000
-
2009-02-10soldstatus $20,501 209-char remark
Show marketing remark (209 chars)
HUD owned case#411-352676 Agents! See info re status at agent remarks.Bid online only/Sold as is/MLS info believed accurate, not guaranteed. Buyer must rely on own inspection. UI-FHA financ not avail try 203k.
-
2008-10-31$25,000 209-char remark
Show marketing remark (209 chars)
HUD owned case#411-352676 Agents! See info re status at agent remarks.Bid online only/Sold as is/MLS info believed accurate, not guaranteed. Buyer must rely on own inspection. UI-FHA financ not avail try 203k.
-
2008-05-14historical
-
2007-12-15$44,900
-
2007-12-03historical
-
2007-07-27$89,900
-
2002-12-09soldstatus $89,000
-
2002-11-15soldstatus $89,000
-
2002-09-23$88,500
-
2001-05-15soldstatus $81,500
-
2001-04-27soldstatus $81,500
-
2001-01-13$82,500
-
1999-07-01soldstatus $73,500
-
1999-06-23soldstatus $73,500
-
1999-04-03$74,900
ⓘ Source: listings_history table (triggers on properties + properties_extension) + one-shot
backfill from property_details.listing_events for pre-trigger history.
Tax reassessment forecast OH · Partial reset (capped growth)
- Current annual tax
- $2,001 · $167/mo
- Projected year-2 tax
- $2,053 · $171/mo
- Expected delta
- +$52/yr (+$4/mo · 2.6%)
ⓘ Screening estimate from a state-policy table — verify with the county assessor before closing.
Climate risk First Street
- Flood 1/10 Low FEMA zone X (unshaded) · 0% chance over 30 yrs
- Wildfire 1/10 Low
- Heat 4/10 Moderate 7 d/yr ≥103°F today · 19 d/yr by 30 yrs out
- Wind 2/10 Low 100% chance of damaging wind over 30 yrs
- Air quality 3/10 Moderate 3 unhealthy d/yr today · 5 by 30 yrs out
Nearby sold comps map
Loading sold comps map…
Walkable amenities ~0.75 mi
Loading nearby amenities…
Taxation est. · year 1
- Rental income
- $16,294
- − Mortgage interest
- −$7,556
- − Property taxes
- −$2,001
- − Insurance
- −$674
- − Repairs & maintenance
- −$1,304
- − Management
- −$1,304
- − Depreciation
- −$3,924
- Taxable loss
- −$469
- Est. tax savings @ 24.0%
- +$113
- After-tax cash flow
- $1,820/yr
For passive investors: Depreciation is non-cash, so a rental often shows a tax loss while cash-flowing — sheltering income. Rental losses are passive: they offset passive income freely, and up to $25,000/yr can offset ordinary (W-2) income if you actively participate and your MAGI is under $100k (phasing out to $0 by $150k); unused losses carry forward. On sale, claimed depreciation is recaptured at up to 25%, and gains may owe capital-gains tax (a 1031 exchange can defer both). Figures are a year-1 estimate at your 24.0% rate — not tax advice; consult a CPA.
Schools (NCES district)
- District
- Cincinnati Public Schools
- NCES district ID
- 3904375
- Math proficiency
- 25% ▼ -19.00%
- Reading proficiency
- 36% ▼ -14.00%
- Median HH income
- $35,743
- Composite
- 25.21/100
- National rank
- #7508
- State rank
- #581 of 656 in OH
Livability — Cincinnati
- Score
- 80/100
- State rank
- #130
- US rank
- #1856
Category grades
Schools grade is shown separately in the Schools card above.
Census & demographics
- Census place
- Cincinnati, OH
- County
- Hamilton County · 701,295 people
- City population
- 505,555
- Metro
- Cincinnati, OH-KY-IN
- Population (ZIP)
- 48,351
- Household income
- $66,277
- Rent vs Own
- Severe rent burden
- 2012.0
Population outlook (Hamilton County) Hauer SSP2
- Today (2025)
- 826,054 people
- By 2030
- 830,947 · +0.6%
- By 2040
- 832,319 · +0.8%
- By 2050
- 822,428 · -0.4%
- By 2075
- 788,688 · -4.5%
- By 2100
- 710,674 · -14.0%
Race, ethnicity, and origin ACS 2023
- Neighborhood character
- Majority White (64%)
- Race & ethnicity
- White 64% Black 28% Two or more races 6% Hispanic / Latino 3%
- Common ancestry
- Italian 2% Lithuanian 2% Slovak 1%
- Foreign-born
- 10% · Canada
- Languages at home
- 88% English-only · French/Haitian/Cajun 4% Spanish 2% German/W. Germanic 1%
Political lean MEDSL · Hamilton
- 2024 margin
- D (+14.9) · D 57.0% · R 42.1%
- 2008→2024 swing
- +7.9pp toward D · 2008: 7.0pp · 2024: 14.9pp
- All cycles
- 2024: D+14.9 2020: D+15.9 2016: D+9.5 2012: D+4.9 2008: D+7.0
Not yet ingested
- Civics
- —
Market trends
- HPI YoY
- ▼ -197.57%
- Current HPI
- 213.5097
- Rent YoY
- ▲ 4.87%
- Metro
- Cincinnati, OH-KY-IN
- State GDP YoY
- ▲ 1.98%
- F500 in state
- 48
Industry mix (Fortune 500 HQ in OH)
| Industry | F500 HQs | Revenue |
|---|---|---|
| Insurance | 3 | $145B |
|
||
| Industrial Machinery | 3 | $49B |
|
||
| Financial Services | 3 | $24B |
|
||
| Consumer Goods | 2 | $93B |
|
||
| Aerospace / Defense | 2 | $47B |
|
||
| Utilities | 2 | $33B |
|
||
Price history
+93.5% since first listed17 events — show timeline
- 2026-05-08 Listed $144,900 Cincy MLS
- 2022-01-20 Sold (Public Records) $90,000 Public Records
- 2009-02-10 Sold (MLS) $20,501 Cincy MLS
- 2008-10-31 Listed $25,000 Cincy MLS
- 2008-05-14 Listing Removed — Cincy MLS
- 2007-12-15 Listed $44,900 Cincy MLS
- 2007-12-03 Listing Removed — Cincy MLS
- 2007-07-27 Listed $89,900 Cincy MLS
- 2002-12-09 Sold (Public Records) $89,000 Public Records
- 2002-11-15 Sold (MLS) $89,000 Cincy MLS
- 2002-09-23 Listed $88,500 Cincy MLS
- 2001-05-15 Sold (Public Records) $81,500 Public Records
- 2001-04-27 Sold (MLS) $81,500 Cincy MLS
- 2001-01-13 Listed $82,500 Cincy MLS
- 1999-07-01 Sold (Public Records) $73,500 Public Records
- 1999-06-23 Sold (MLS) $73,500 Cincy MLS
- 1999-04-03 Listed $74,900 Cincy MLS
Property tax history
+15.0%/yrLatest (2025): $2,001 · +0.1% YoY. Source: county tax records.
Cash-flow waterfall
monthlySold comps — $/sqft
last 12 mo · ≤1 miLoading sold comps…