 🏷️ Likely Rental
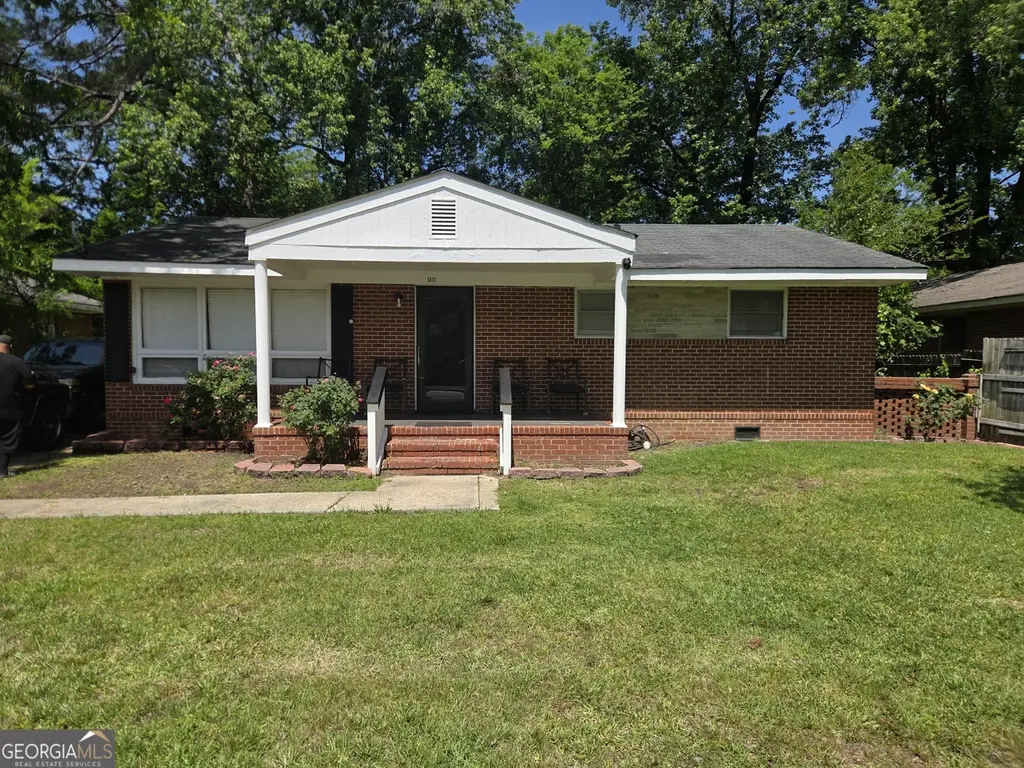
1031 Enoch Dr · Columbus, GA
Flood risk 1/10 · Minimal
- FEMA flood zone
- X (unshaded)
- Chance of flooding over 30 yrs
- 0.0%
- Est. flood insurance / yr
- $507 – $1,088
Fire risk 1/10 · Minimal
- Est. fire insurance / yr
- $963 – $1,789
Heat risk 7/10 · Major
- Hot days now (above 107°F)
- 7 days/yr
- Hot days in 30 yrs
- 19 days/yr
Wind risk 6/10 · Moderate
- Chance of severe wind over 30 yrs
- 76.0%
Air-quality risk 4/10 · Minor
- Unhealthy air days now
- 5 days/yr
- Unhealthy air days in 30 yrs
- 6 days/yr
Risk factors via First Street. Map © Google.
Why this score? — see what drove the B+ grade
The composite is a weighted blend of 9 inputs, each scored 0–100. Each bar is that input's sub-score; the figure is the points it added to the 100-point composite (weight × sub-score).
- Cash flow +30.0/30.0
- ARV discount +15.0/15.0
- DSCR +10.0/10.0
- 1% rule +9.4/10.0
- Rent growth +3.7/5.0
- Livability +3.2/5.0
- Condition / age +2.5/5.0
- Schools +2.2/10.0
- Appreciation +0.0/10.0
$87,000
🖨 Deal sheet 📄 Offer letter ✓ Due diligence
Listing remarks
Investment opportunity or future primary residence! Welcome to 1031 Enoch Drive in Columbus, offered at $87,500. This 4-bedroom, 2-bathroom home features approximately 1,425 square feet of living space and presents a strong opportunity for both investors and owner-occupants. The property is currently tenant-occupied with a long-term tenant of 7 years, providing consistent rental history and immediate income potential. Investors can continue operating as a rental, while future homeowners may have the option to occupy at a later date. Whether you're looking to expand your portfolio or secure an affordable home with upside potential, this property offers flexibility and value. Schedule your sh
Key facts
- 6,969 sq ft lot
- Built 1959
Property features AI
Finance
- Other: Located in the Carver Plaza subdivision; Address: 1031 Enoch Drive, Columbus, GA 31906
- HOA & community: No homeowners association
Exterior
- Parking: Off-street parking
- Utilities: Public water; Public sewer; Electricity available; Natural gas available; Cable available; High-speed internet available
- Home design: Single-family residence; House; Resale property
- Construction: Built in 1959; Brick construction; Composition roof; Above-grade finished area reported
- Exterior features: City lot
Interior
- Kitchen: Refrigerator included
- Bedrooms: 4 bedrooms on the main level
- Flooring: Carpet; Laminate; Tile; Vinyl
- Bathrooms: 2 full bathrooms on the main level
- Heating & cooling: Central heating; Central air conditioning
- Interior features: One-level layout; Den; Crawl space basement; Fireplace (1)
- Laundry & utility: Laundry in hall
Neighborhood map
What this means for you Summary
Snapshot
- This is a 4-bed/2.0-bath single-family listed at $87k.
Deal economics
- At list price, monthly cash flow is $394 ($5k/yr) — positive.
- The deal already cash-flows at list — no discount required.
- Meets the 1% rule at list price ($1k rent vs $87k).
- Cap rate 11.7% vs local median 4.7% in Columbus — top-decile yield for the area; either an underpriced asset or a hidden risk that comps aren't pricing in. Stress-test before assuming the spread holds.
Location & tenants
- Location reads 64/100 on livability (#254 in GA) — a middle-class / working-renter tenant base. Strengths: cost of living A+, housing A+, health & safety B; Watch: amenities D+, crime F, commute F.
- Muscogee County (urban): math 21% / reading 30% proficiency, ranked #120 of 174 in GA (top 69%) — low school quality limits family demand, transient renter base, plan for 1-2y turnover; 61% free/reduced lunch — lower-income household profile, screen leases tightly.
- Zoned schools: Davis Elementary School (math 8% / reading 8%, grade F, #1,125 of 1,228 statewide, top 93%, 321 students, 97% FRL); Richards Middle School (math 45% / reading 59%, grade C+, #60 of 470 statewide, top 13%, 819 students, 97% FRL) — zoned schools average 97% FRL vs 61% district-wide (36 pts higher); higher-poverty schools than district average — tighter screening recommended.
- Market conditions: Rents rising fast (+4.8%/yr); 118 active listings in the ZIP; 25 comparable units currently listed for rent nearby; rentals at typical pace (median 22d on market — plan ~3-4 weeks tenant-placement turnaround); 40% of comp listings sitting > 30 days — soft ceiling on asking rent; lower-income renter base — watch delinquency; 291 units permitted in Muscogee County in 2024 (30 in 5+ unit buildings).
- This rent runs 33% of the median local income ($45k/yr) — at the standard rent-burdened threshold; future hikes will face affordability resistance.
Forward outlook
- Local home prices are declining (-3.0%/yr); year-one equity from $601 of loan paydown is wiped out by about $3k of value loss. Plan a longer hold.
- Muscogee County population projected at +15% by 2050 — modest demand growth; plan on rents tracking national, not racing it.
- At projected returns (-3.0% appreciation + 4.8% rent growth), your $24k cash investment doubles in ~6 years — after that, you're playing with house money.
Negotiation context
- Only 1 days on market — expect competitive offers; lowballing is unlikely to land.
Risks & watch-outs
- Watch-outs: built in 1959 — expect roof / HVAC / electrical / plumbing capex.
- Climate carrying-cost: major wind risk, 76% chance of damaging wind over 30y; extreme-heat days projected 7→19/yr by 2055 (HVAC capex compounding) — expect insurance premiums to compound above CPI over the hold.
Questions for the listing agent
- Built in 1959 — when were the roof, HVAC, electrical panel, plumbing, and water heater last replaced?
- Is there a deadline driving the sale (1031 exchange, divorce, estate, relocation)? That informs how much negotiation room exists.
- Schools are F-rated, which usually means shorter tenancies and higher turnover. Who's the typical renter profile here, and what's been the actual vacancy rate?
- Crime grade is F in this area — have there been break-ins, vandalism, or insurance claims at this property in the last 3 years? What carrier currently insures it and at what premium?
- What's the average days-on-market for RENTAL listings here right now (not sales)? A rising rental-DOM trend means longer vacancies and softer asking-rent achievability than the comps imply.
- What's the recent tenant-quality profile in this submarket — average credit score on applications, eviction rate, late-payment / NSF rate, and stable-employment percentage? A property-management company in the area should have these aggregated.
- How much new for-sale + rental construction is in the pipeline within 1–3 miles? Heavy new supply typically softens prices + rents 12–24 months out; constrained supply supports both.
Investment metrics
- 1% rule
- 1.44% ✓
- Cap rate
- 11.72%
- Cash-on-cash
- 19.39%
- DSCR
- 1.86
- GRM
- 5.8
CMA / ARV
- ARV (on-the-fly)
- $145,350
- Comps found
- 12
Show comp detail 12 sales within ~0.75 mi
| Address | Dist | Beds/Ba | Sqft | Sold | Price | $/sf | Match |
|---|---|---|---|---|---|---|---|
| 1031 Enoch Dr | 0.00mi | 4/2.0 | 1,425 (0%) | 0mo | $73,000 | $51 | 100 |
| 3415 Terminal St | 0.27mi | 3/1.5 (-1) | 1,353 (-5%) | 5mo | $66,200 | $49 | 67 |
| 3122 Glenwood Dr | 0.42mi | 4/2.0 | 1,523 (+7%) | 2mo | $159,900 | $105 | 67 |
| 2911 Thomas St | 0.66mi | 3/2.0 (-1) | 1,400 (-2%) | 4mo | $35,000 | $25 | 58 |
| 4327 Kenesaw Dr | 0.70mi | 3/2.0 (-1) | 1,421 (-0%) | 8mo | $145,000 | $102 | 55 |
| 554 Claradon Ave | 0.73mi | 3/2.0 (-1) | 1,470 (+3%) | 2mo | $110,000 | $75 | 54 |
| 1081 Rigdon Rd | 0.59mi | 3/1.0 (-1) | 1,342 (-6%) | 2mo | $65,000 | $48 | 52 |
| 1232 Alta Vis | 0.61mi | 3/2.0 (-1) | 1,322 (-7%) | 3mo | $205,000 | $155 | 52 |
| 2927 8th St | 0.68mi | 3/2.0 (-1) | 1,525 (+7%) | 2mo | $185,000 | $121 | 50 |
| 3107 Melrose Dr | 0.55mi | 3/2.0 (-1) | 1,524 (+7%) | 10mo | $140,000 | $92 | 49 |
| 1104 Dunbar Ave | 0.43mi | 3/1.0 (-1) | 1,213 (-15%) | 1mo | $125,000 | $103 | 45 |
| 2907 8th St | 0.73mi | 3/2.0 (-1) | 1,236 (-13%) | 11mo | $137,500 | $111 | 30 |
Match score weights: distance 35% · size 25% · config 20% · recency 20%. Top-matched comps best support the ARV.
Projected returns pro-forma
-3.0% appreciation · 4.82% rent growth · sell at horizon
- IRR
- 13.4%
- Equity multiple
- 1.55×
- Total profit
- $13,322
- Equity at exit
- $12,972
- IRR
- 23.6%
- Equity multiple
- 3.21×
- Total profit
- $53,900
- Equity at exit
- $7,522
Cash invested: $24,360 (down + closing). Projections, not guarantees.
Landlord ↔ Tenant lean methodology
- Overall (STATE)
- 90 Strongly Landlord-Friendly
- State Georgia
- 90 Strongly Landlord-Friendly · R+3
- County
- — inherits STATE
- City
- — inherits STATE
ZIP-level market 31906
- Rents YoY
- 4.8%
- Active inventory
- 118
- Price-to-rent
- 5.8×
Monthly cashflow live
- Estimated rent
- $1,254 high interval (Pro) →
- Mortgage (P&I)
- −$456
- Tax from tax record
- −$105 /mo · $1,256/yr
- Insurance
- −$36
- HOA
- −$0
- Vacancy / Maint / Mgmt
- −$263
- Net cashflow
- $394
Break-even live
UW: 25.0% down · 7.5% · 30yr · 1.5% tax · 5.0% vac · 8.0% maint · 8.0% mgmt
Financing live
Cash to close
- Down payment
- $21,750
- Closing costs
- $2,610
- Reserves months
- —
- Total cash needed
- —
Loan-product check · same deal, 3 products live
Conventional
25% down · 7.5% · 30yr
- Down + closing
- —
- Monthly P&I
- —
- Monthly cashflow
- —
- DSCR
- —
- Eligible?
- —
Personal DTI + credit; lowest rate.
DSCR
20% down · 8.5% · 30yr
- Down + closing
- —
- Monthly P&I
- —
- Monthly cashflow
- —
- DSCR
- —
- Eligible?
- —
No personal income docs; deal must DSCR.
Hard money
10% down · 12.0% · 12mo
- Down + closing
- —
- Monthly P&I
- —
- Monthly cashflow
- —
- DSCR
- —
- Eligible?
- —
Short-term bridge; refi at stabilization.
Rent comps 25 comps
| Address | Beds | Baths | Sqft | Rent | $/sqft | DOM | Units | Dist |
|---|---|---|---|---|---|---|---|---|
| 3503 Ruben St Columbus, GA | 4.0 | 1.0 | 1054 | $1,100 | $1.04 | 14d | 1 | 0.08mi |
| 3309 10th St Columbus, GA | 3.0 | 1.0 | 1080 | $950 | $0.88 | 44d | 1 | 0.26mi |
| 3128 Carver St Columbus, GA | 3.0 | 1.0 | 988 | $925 | $0.94 | 21d | 1 | 0.39mi |
| 3128 Carver St Columbus, GA | 3.0 | 1.0 | 988 | $1,000 | $1.01 | 44d | 1 | 0.39mi |
| 3122 Baldwin St Columbus, GA | 5.0 | 2.0 | 1780 | $1,500 | $0.84 | 21d | 1 | 0.48mi |
| 2944 10th St Columbus, GA | 3.0 | 1.0 | 1550 | $925 | $0.60 | 14d | 1 | 0.56mi |
| 1400 Boxwood Blvd Columbus, GA | 2.0–3.0 | 2.0 | 1262 | $1,355 | $1.07 | 14d | 6 | 0.67mi |
| 3775 Steam Mill Rd Columbus, GA | 3.0 | 2.0 | 1613 | $2,100 | $1.30 | 44d | 1 | 0.67mi |
| 3911 Steam Mill Rd Columbus, GA | 1.0–3.0 | 1.0–2.0 | 959 | $1,200 | $1.25 | 14d | 12 | 0.77mi |
| 2728 9th St Columbus, GA | 3.0 | 1.0 | 880 | $865 | $0.98 | 44d | 1 | 0.83mi |
| 2834 Mimosa St Columbus, GA | 3.0 | 1.5 | 1257 | $1,100 | $0.88 | 44d | 1 | 0.83mi |
| 2801 Fern St Columbus, GA | 3.0 | 1.0 | 1100 | $975 | $0.89 | 44d | 1 | 0.84mi |
| 2750 Mimosa St Columbus, GA | 3.0 | 1.5 | 1357 | $1,250 | $0.92 | 14d | 1 | 0.85mi |
| 920 Rosewood Dr Columbus, GA | 4.0 | 1.0 | 1325 | $1,350 | $1.02 | 21d | 1 | 0.95mi |
| 564 Chesterfield Ave Columbus, GA | 3.0 | 2.0 | 1230 | $1,100 | $0.89 | 21d | 1 | 0.98mi |
| 3552 Irwin Way Columbus, GA | 4.0 | 2.0 | 1536 | $1,725 | $1.12 | 14d | 1 | 1.01mi |
| 1111 Henry Ave Columbus, GA | 3.0 | 2.0 | 1407 | $1,200 | $0.85 | 44d | 1 | 1.12mi |
| 2309 Willard St Columbus, GA | 3.0 | 2.0 | 1803 | $1,700 | $0.94 | 14d | 1 | 1.16mi |
| 800 Goodson Dr Columbus, GA | 4.0 | 1.0 | 1012 | $1,225 | $1.21 | 21d | 1 | 1.28mi |
| 1507 Celia Dr Columbus, GA | 3.0 | 1.0 | 1000 | $1,050 | $1.05 | 14d | 1 | 1.29mi |
| 1537 Celia Dr Columbus, GA | 3.0 | 1.0 | 1139 | $975 | $0.86 | 21d | 1 | 1.32mi |
| 441 Braselman Ave Columbus, GA | 3.0 | 1.5 | 1150 | $1,250 | $1.09 | 44d | 1 | 1.44mi |
| 1917 Watkins Dr Columbus, GA | 3.0 | 1.0 | 1323 | $1,200 | $0.91 | 44d | 1 | 1.48mi |
| 527 Englewood Dr Columbus, GA | 3.0 | 2.0 | 1469 | $1,450 | $0.99 | 14d | 1 | 1.49mi |
| 1719 Celia Dr Columbus, GA | 3.0 | 2.0 | 1249 | $1,100 | $0.88 | 44d | 1 | 1.50mi |
Listing history 2 events
-
2026-05-01status Under Contract
-
2026-04-30$87,000 New
ⓘ Source: listings_history table (triggers on properties + properties_extension) + one-shot
backfill from property_details.listing_events for pre-trigger history.
Tax reassessment forecast GA · Resets to sale price
- Current annual tax
- $1,256 · $105/mo
- Projected year-2 tax
- $1,256 · $105/mo
- Expected delta
- $0/yr ($0/mo · 0.0%)
ⓘ Screening estimate from a state-policy table — verify with the county assessor before closing.
Climate risk First Street
- Flood 1/10 Low FEMA zone X (unshaded) · 0% chance over 30 yrs
- Wildfire 1/10 Low
- Heat 7/10 Severe 7 d/yr ≥107°F today · 19 d/yr by 30 yrs out
- Wind 6/10 Major 76% chance of damaging wind over 30 yrs
- Air quality 4/10 Moderate 5 unhealthy d/yr today · 6 by 30 yrs out
Nearby sold comps map
Loading sold comps map…
Walkable amenities ~0.75 mi
Loading nearby amenities…
Taxation est. · year 1
- Rental income
- $15,049
- − Mortgage interest
- −$4,873
- − Property taxes
- −$1,256
- − Insurance
- −$435
- − Repairs & maintenance
- −$1,204
- − Management
- −$1,204
- − Depreciation
- −$2,531
- Taxable income
- $3,546
- Est. tax owed @ 24.0%
- −$851
- After-tax cash flow
- $3,872/yr
For passive investors: Depreciation is non-cash, so a rental often shows a tax loss while cash-flowing — sheltering income. Rental losses are passive: they offset passive income freely, and up to $25,000/yr can offset ordinary (W-2) income if you actively participate and your MAGI is under $100k (phasing out to $0 by $150k); unused losses carry forward. On sale, claimed depreciation is recaptured at up to 25%, and gains may owe capital-gains tax (a 1031 exchange can defer both). Figures are a year-1 estimate at your 24.0% rate — not tax advice; consult a CPA.
Schools (NCES district)
- District
- Muscogee County
- NCES district ID
- 1303870
- Math proficiency
- 21% ▼ -11.00%
- Reading proficiency
- 30% ▼ -7.00%
- Median HH income
- $41,176
- Composite
- 21.6/100
- National rank
- #8297
- State rank
- #120 of 174 in GA
Livability — Columbus
- Score
- 64/100
- State rank
- #254
- US rank
- #14102
Category grades
Schools grade is shown separately in the Schools card above.
Census & demographics
- Census place
- Columbus, GA
- County
- Muscogee County · 180,764 people
- City population
- 180,764
- Metro
- Columbus, GA-AL
- Population (ZIP)
- 20,400
- Household income
- $44,965
- Rent vs Own
- Severe rent burden
- 1003.0
Population outlook (Muscogee County) Hauer SSP2
- Today (2025)
- 216,729 people
- By 2030
- 224,504 · +3.6%
- By 2040
- 238,318 · +10.0%
- By 2050
- 249,027 · +14.9%
- By 2075
- 264,862 · +22.2%
- By 2100
- 254,786 · +17.6%
Race, ethnicity, and origin ACS 2023
- Neighborhood character
- Majority Black (64%)
- Race & ethnicity
- Black 64% White 28% Hispanic / Latino 4% Two or more races 3% Asian 1%
- Common ancestry
- Slovak 1% Lithuanian 1% Hispanic 1%
- Foreign-born
- 3% · Canada
- Languages at home
- 95% English-only · Spanish 3% Other Indo-European 1%
Political lean MEDSL · Muscogee
- 2024 margin
- Strong D (+23.4) · D 61.4% · R 38.0%
- 2008→2024 swing
- +3.7pp toward D · 2008: 19.7pp · 2024: 23.4pp
- All cycles
- 2024: D+23.4 2020: D+24.0 2016: D+18.6 2012: D+21.3 2008: D+19.7
Not yet ingested
- Civics
- —
Market trends
- HPI YoY
- ▼ -122.49%
- Current HPI
- 113.2749
- Rent YoY
- ▲ 4.82%
- Metro
- Columbus, GA-AL
- State GDP YoY
- ▲ 2.66%
- F500 in state
- 28
Industry mix (Fortune 500 HQ in GA)
| Industry | F500 HQs | Revenue |
|---|---|---|
| Paper / Packaging | 2 | $29B |
|
||
| Retail | 1 | $160B |
|
||
| Transportation / Logistics | 1 | $91B |
|
||
| Airlines | 1 | $62B |
|
||
| Consumer Goods | 1 | $47B |
|
||
| Utilities | 1 | $25B |
|
||
Price history
2 events — show timeline
- 2026-05-01 Pending — GAMLS
- 2026-04-30 Listed $87,000 GAMLS
Property tax history
+4.7%/yrLatest (2025): $1,256 · -0.0% YoY. Source: county tax records.
Cash-flow waterfall
monthlySold comps — $/sqft
last 12 mo · ≤1 miLoading sold comps…