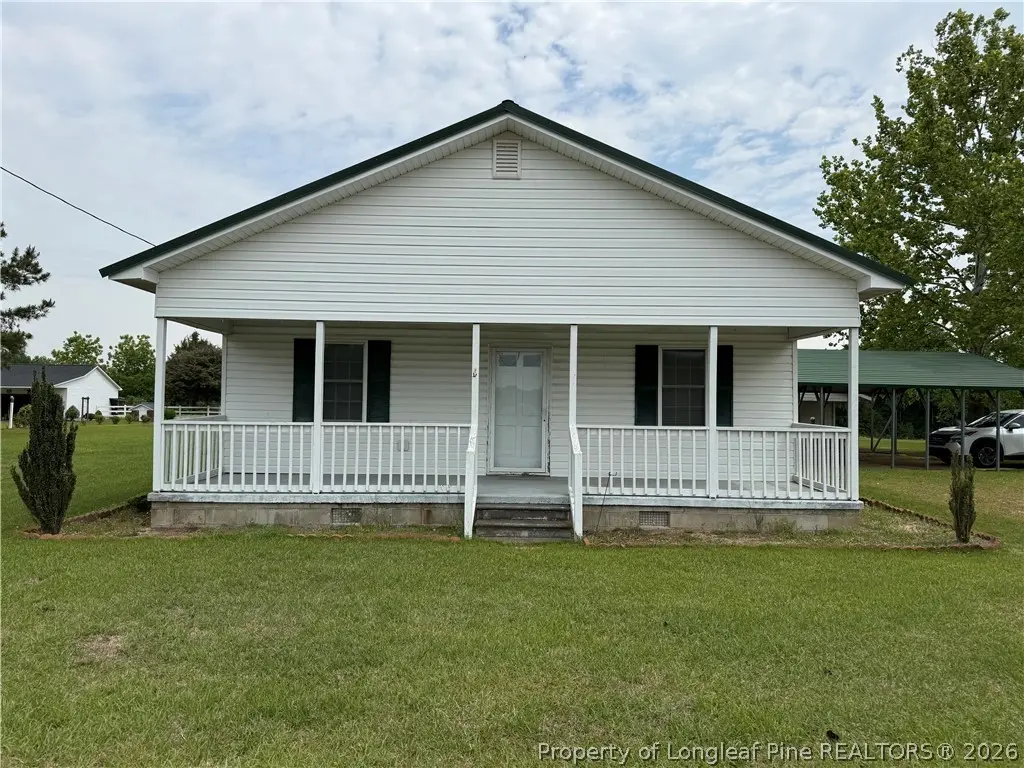
1123 Merkle Ln · Vann Crossroads, NC
Flood risk 1/10 · Minimal
- FEMA flood zone
- X (unshaded)
- Chance of flooding over 30 yrs
- 0.0%
- Est. flood insurance / yr
- $507 – $1,088
Fire risk 2/10 · Minimal
- Est. fire insurance / yr
- $906 – $1,684
Heat risk 7/10 · Major
- Hot days now (above 106°F)
- 7 days/yr
- Hot days in 30 yrs
- 16 days/yr
Wind risk 8/10 · Major
- Chance of severe wind over 30 yrs
- 80.0%
Air-quality risk 2/10 · Minimal
- Unhealthy air days now
- 0 days/yr
- Unhealthy air days in 30 yrs
- 1 days/yr
Risk factors via First Street. Map © Google.
Why this score? — see what drove the C grade
The composite is a weighted blend of 9 inputs, each scored 0–100. Each bar is that input's sub-score; the figure is the points it added to the 100-point composite (weight × sub-score).
- Cash flow +25.1/30.0
- DSCR +8.2/10.0
- ARV discount +7.5/15.0
- 1% rule +6.5/10.0
- Schools +3.4/10.0
- Condition / age +2.8/5.0
- Rent growth +2.5/5.0
- Livability +1.9/5.0
- Appreciation +0.0/10.0
$130,000
🖨 Deal sheet 📄 Offer letter ✓ Due diligence
Listing remarks
Nearly an acre in a peaceful Sampson County setting, this Clinton property offers space, flexibility, and a home with plenty of potential. The tax card shows 5 bedrooms, 1 full bath, and approximately 1,500 square feet, with a heat pump for heating and cooling. The 0.92-acre lot gives buyers room to spread out, garden, add outdoor living space, or simply enjoy a quieter setting outside of town. Convenient to Clinton, Dunn, Newton Grove, and surrounding Sampson County communities, this property could be a great fit for an owner occupant looking for more land or an investor looking for their next opportunity. Buyer to verify zoning, utilities, septic/bedroom capacity, and all property details
Key facts
- 0.92 acre lot
- Outdoor living space
- 2 parking spots
Tags
Property features AI
Exterior
- Parking: 2 covered parking spaces; 2-car carport
- Utilities: Public water; Septic tank or holding tank sewer
- Home design: Single family residence; Residential property
- Construction: Vinyl siding
- Exterior features: Storage; Level topography/lot
Interior
- Flooring: Laminate; Vinyl
- Bathrooms: 1 full bathroom
- Heating & cooling: Natural gas central heating
- Interior features: Laminate and vinyl flooring; Crawl space basement
Neighborhood map
What this means for you Summary
Snapshot
- This is a 5-bed/1.0-bath single-family listed at $130k. Condition is rated average.
Deal economics
- At list price, monthly cash flow is $288 ($3k/yr) — positive.
- The deal already cash-flows at list — no discount required.
- Meets the 1% rule at list price ($2k rent vs $130k).
- Recommended offer: $128k (1.5% below list) — sets the bar for market timing.
Location & tenants
- Location reads 38/100 on livability (#735 in NC) — a limited-amenity area; tenant pool skews transient or value-seeking. Strengths: cost of living A+, crime A; Watch: amenities F, commute F, employment F.
- Sampson County Schools (rural): math 40% / reading 41% proficiency, ranked #114 of 178 in NC (top 64%) — families likely to look elsewhere, expect single-tenant / working-renter base with shorter leases; 74% free/reduced lunch — lower-income household profile, screen leases tightly.
- Zoned schools: Midway Middle (math 52% / reading 48%, grade C, #113 of 475 statewide, top 25%, 550 students, 100% FRL); Midway High (math 82% / reading 42%, grade B-, #184 of 535 statewide, top 37%, 757 students, 100% FRL) — zoned schools average 100% FRL vs 74% district-wide (26 pts higher); higher-poverty schools than district average — tighter screening recommended.
- Zoned-school proficiency averages 56% at this address vs 40% district-wide (+16 pts) — the actual schools serving this property are materially stronger than the Sampson County Schools average implies; a family-tenant draw the district grade alone would hide.
- Market conditions: 147 active listings in the ZIP; 189 units permitted in Sampson County in 2024 (0 in 5+ unit buildings).
Forward outlook
- Local home prices are declining (-3.0%/yr); year-one equity from $899 of loan paydown is wiped out by about $4k of value loss. Plan a longer hold.
- Sampson County population projected to shrink 5% by 2050 — rents likely to lag national; underwrite the cash flow, not the appreciation.
Negotiation context
- It's been on market 27 days — a 2% lower offer ($128k) is reasonable based on typical stale-listing flexibility.
Risks & watch-outs
- Watch-outs: built in 1945 — expect roof / HVAC / electrical / plumbing capex.
- Climate carrying-cost: severe wind risk, 80% chance of damaging wind over 30y; extreme-heat days projected 7→16/yr by 2055 (HVAC capex compounding) — expect insurance premiums to compound above CPI over the hold.
Questions for the listing agent
- Built in 1945 — when were the roof, HVAC, electrical panel, plumbing, and water heater last replaced?
- Is there a deadline driving the sale (1031 exchange, divorce, estate, relocation)? That informs how much negotiation room exists.
- Schools are F-rated, which usually means shorter tenancies and higher turnover. Who's the typical renter profile here, and what's been the actual vacancy rate?
- What's the average days-on-market for RENTAL listings here right now (not sales)? A rising rental-DOM trend means longer vacancies and softer asking-rent achievability than the comps imply.
- What's the recent tenant-quality profile in this submarket — average credit score on applications, eviction rate, late-payment / NSF rate, and stable-employment percentage? A property-management company in the area should have these aggregated.
- How much new for-sale + rental construction is in the pipeline within 1–3 miles? Heavy new supply typically softens prices + rents 12–24 months out; constrained supply supports both.
Investment metrics
- 1% rule
- 1.15% ✓
- Cap rate
- 8.95%
- Cash-on-cash
- 9.49%
- DSCR
- 1.42
- GRM
- 7.2
CMA / ARV
No comps found within radius.
Projected returns pro-forma
-3.0% appreciation · 3.0% rent growth · sell at horizon
- IRR
- -2.0%
- Equity multiple
- 0.93×
- Total profit
- $-2,717
- Equity at exit
- $19,383
- IRR
- 7.7%
- Equity multiple
- 1.59×
- Total profit
- $21,324
- Equity at exit
- $11,240
Cash invested: $36,400 (down + closing). Projections, not guarantees.
Landlord ↔ Tenant lean methodology
- Overall (STATE)
- 85 Strongly Landlord-Friendly
- State North Carolina
- 85 Strongly Landlord-Friendly · R+3
- County
- — inherits STATE
- City
- — inherits STATE
ZIP-level market 28328
- Home prices YoY
- -17.3%
- Active inventory
- 147
- Price-to-rent
- 7.2×
Monthly cashflow live
- Estimated rent
- $1,501 medium interval (Pro) →
- Mortgage (P&I)
- −$682
- Tax est. 1.5%
- −$162 /mo · $1,950/yr
- Insurance
- −$54
- HOA
- −$0
- Vacancy / Maint / Mgmt
- −$315
- Net cashflow
- $288
Break-even live
UW: 25.0% down · 7.5% · 30yr · 1.5% tax · 5.0% vac · 8.0% maint · 8.0% mgmt
Financing live
Cash to close
- Down payment
- $32,500
- Closing costs
- $3,900
- Reserves months
- —
- Total cash needed
- —
Loan-product check · same deal, 3 products live
Conventional
25% down · 7.5% · 30yr
- Down + closing
- —
- Monthly P&I
- —
- Monthly cashflow
- —
- DSCR
- —
- Eligible?
- —
Personal DTI + credit; lowest rate.
DSCR
20% down · 8.5% · 30yr
- Down + closing
- —
- Monthly P&I
- —
- Monthly cashflow
- —
- DSCR
- —
- Eligible?
- —
No personal income docs; deal must DSCR.
Hard money
10% down · 12.0% · 12mo
- Down + closing
- —
- Monthly P&I
- —
- Monthly cashflow
- —
- DSCR
- —
- Eligible?
- —
Short-term bridge; refi at stabilization.
Listing history 18 events
-
2026-06-18days on market $130,000 Active 27 DOM
-
2026-06-17days on market $130,000 Active 26 DOM
-
2026-06-16days on market $130,000 Active 25 DOM
-
2026-06-16price $130,000 Active 24 DOM
-
2026-06-15days on market $140,000 Active 24 DOM
-
2026-06-14days on market $140,000 Active 22 DOM
-
2026-06-13pricedays on market $140,000 Active 21 DOM
-
2026-06-10days on market $145,000 Active 19 DOM
-
2026-06-09days on market $145,000 Active 18 DOM
-
2026-06-08days on market $145,000 Active 17 DOM
-
2026-06-07days on market $145,000 Active 16 DOM
-
2026-06-05days on market $145,000 Active 13 DOM
-
2026-06-03days on market $145,000 Active 12 DOM
-
2026-06-02days on market $145,000 Active 11 DOM
-
2026-06-01days on market $145,000 Active 10 DOM
-
2026-05-31days on market $145,000 Active 9 DOM
-
2026-05-30days on market $145,000 Active 8 DOM
-
2026-05-21$145,000 Active
ⓘ Source: listings_history table (triggers on properties + properties_extension) + one-shot
backfill from property_details.listing_events for pre-trigger history.
Climate risk First Street
- Flood 1/10 Low FEMA zone X (unshaded) · 0% chance over 30 yrs
- Wildfire 2/10 Low
- Heat 7/10 Severe 7 d/yr ≥106°F today · 16 d/yr by 30 yrs out
- Wind 8/10 Severe 80% chance of damaging wind over 30 yrs
- Air quality 2/10 Low 0 unhealthy d/yr today · 1 by 30 yrs out
Nearby sold comps map
Loading sold comps map…
Walkable amenities ~0.75 mi
Loading nearby amenities…
Taxation est. · year 1
- Rental income
- $18,017
- − Mortgage interest
- −$7,282
- − Property taxes
- −$1,950
- − Insurance
- −$650
- − Repairs & maintenance
- −$1,441
- − Management
- −$1,441
- − Depreciation
- −$3,782
- Taxable income
- $1,471
- Est. tax owed @ 24.0%
- −$353
- After-tax cash flow
- $3,100/yr
For passive investors: Depreciation is non-cash, so a rental often shows a tax loss while cash-flowing — sheltering income. Rental losses are passive: they offset passive income freely, and up to $25,000/yr can offset ordinary (W-2) income if you actively participate and your MAGI is under $100k (phasing out to $0 by $150k); unused losses carry forward. On sale, claimed depreciation is recaptured at up to 25%, and gains may owe capital-gains tax (a 1031 exchange can defer both). Figures are a year-1 estimate at your 24.0% rate — not tax advice; consult a CPA.
Condition & rehab AI · 27 photos
This home has average condition with moderate rehab needs, offering potential for significant value increase through updates.
Repairs flagged
- Minor kitchen cabinets — existing cabinets need touch-up
- Minor bathroom fixtures — existing fixtures need cleaning
- Minor exterior siding — existing siding needs touch-up
- Minor interior walls — existing paint needs touch-up
Value-add opportunities
- Both new kitchen appliances — improves functionality and aesthetics
- Both new bathroom fixtures — enhances functionality and aesthetics
- Both new exterior paint — enhances curb appeal and value
- Both new flooring — improves comfort and aesthetics
Renovation cost estimate screening
| Repair item | Severity | Est. cost |
|---|---|---|
| kitchen cabinets · existing cabinets need touch-up | Minor | $500–3,000 |
| bathroom fixtures · existing fixtures need cleaning | Minor | $500–3,000 |
| exterior siding · existing siding needs touch-up | Minor | $500–3,000 |
| interior walls · existing paint needs touch-up | Minor | $500–3,000 |
| Total estimated repair cost · 4 items | $2,000–12,000 |
Value-add ROI direction
- Both new kitchen appliances — improves functionality and aesthetics ↑
- Both new bathroom fixtures — enhances functionality and aesthetics ↑
- Both new exterior paint — enhances curb appeal and value ↑
- Both new flooring — improves comfort and aesthetics ↑
ⓘ Cost ranges are severity-bucket heuristics (US national rule-of-thumb). Get contractor quotes + a written scope before underwriting a rehab budget.
Schools (NCES district)
- District
- Sampson County Schools
- NCES district ID
- 3704140
- Math proficiency
- 40% ▼ -6.00%
- Reading proficiency
- 41% ▼ -6.00%
- Median HH income
- $37,391
- Composite
- 33.71/100
- National rank
- #5379
- State rank
- #114 of 178 in NC
Livability — Vann Crossroads
- Score
- 38/100
- State rank
- #735
- US rank
- #27448
Category grades
Schools grade is shown separately in the Schools card above.
Census & demographics
- Census place
- Vann Crossroads, NC
- Population (ZIP)
- 26,314
Population outlook (Sampson County) Hauer SSP2
- Today (2025)
- 63,499 people
- By 2030
- 62,970 · -0.8%
- By 2040
- 61,609 · -3.0%
- By 2050
- 60,462 · -4.8%
- By 2075
- 60,108 · -5.3%
- By 2100
- 62,120 · -2.2%
Race, ethnicity, and origin ACS 2023
- Neighborhood character
- Diverse neighborhood (Simpson 0.69)
- Race & ethnicity
- White 40% Black 29% Hispanic / Latino 26% Two or more races 4% Native American 4%
- Hispanic origin (detail)
- Mexican 12% Cuban 1%
- Common ancestry
- Serbian 1% Slovak 1%
- Foreign-born
- 15% · Canada
- Languages at home
- 77% English-only · Spanish 22%
Political lean MEDSL · Sampson
- 2024 margin
- Strong R (+29.8) · D 34.8% · R 64.6%
- 2008→2024 swing
- -21.3pp toward R · 2008: -8.4pp · 2024: -29.8pp
- All cycles
- 2024: R+29.8 2020: R+22.5 2016: R+16.7 2012: R+11.0 2008: R+8.4
Not yet ingested
- Civics
- —
Market trends
- HPI YoY
- ▼ -49.24%
- Current HPI
- 236.0823
- Rent YoY
- —
- Metro
- —
- State GDP YoY
- ▲ 3.28%
- F500 in state
- 26
Industry mix (Fortune 500 HQ in NC)
| Industry | F500 HQs | Revenue |
|---|---|---|
| Financial Services | 2 | $213B |
|
||
| Retail | 2 | $95B |
|
||
| Industrial Conglomerate | 1 | $38B |
|
||
| Metals / Steel | 1 | $35B |
|
||
| Utilities | 1 | $30B |
|
||
| Industrial Machinery | 1 | $19B |
|
||
Price history
1 event — show timeline
- 2026-05-21 Listed $145,000 LPRMLS
Cash-flow waterfall
monthlySold comps — $/sqft
last 12 mo · ≤1 miLoading sold comps…