 Multi-family
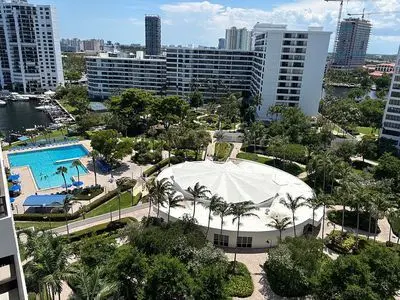
2500 Parkview Dr · Hallandale Beach, FL
Flood risk 9/10 · Severe
- FEMA flood zone
- AE
- Chance of flooding over 30 yrs
- 0.99%
- Est. flood insurance / yr
- $1,737 – $8,500
Fire risk 1/10 · Minimal
- Est. fire insurance / yr
- $947 – $1,759
Heat risk 10/10 · Severe
- Hot days now (above 104°F)
- 7 days/yr
- Hot days in 30 yrs
- 24 days/yr
Wind risk 10/10 · Severe
- Chance of severe wind over 30 yrs
- 99.0%
Air-quality risk 2/10 · Minimal
- Unhealthy air days now
- 1 days/yr
- Unhealthy air days in 30 yrs
- 2 days/yr
Risk factors via First Street. Map © Google.
Why this score? — see what drove the B- grade
The composite is a weighted blend of 9 inputs, each scored 0–100. Each bar is that input's sub-score; the figure is the points it added to the 100-point composite (weight × sub-score).
- Cash flow +27.4/30.0
- DSCR +9.6/10.0
- 1% rule +7.5/10.0
- ARV discount +7.5/15.0
- Schools +4.1/10.0
- Livability +4.0/5.0
- Rent growth +2.6/5.0
- Condition / age +2.5/5.0
- Appreciation +0.0/10.0
$335,000
🖨 Deal sheet (PDF) 📄 Offer letter ✓ Due diligence
Multi-family units
County records classify this as Multi-Family (5+ Unit). Listing-text estimate: 1 unit. estimate disagrees with records
5+ unit building — per-unit beds/baths from public records are typically unavailable; the breakdown below (if shown) is an estimate from the listing text.
Listing remarks
Gorgeous marina view from a spacious private terrace in the Olympus complex. Marble floors, spacious with 3 walk in closets and additional storage space. Covered parking (1 space), State of the art gym, 2 swimming pools, 8 tennis courts, sauna, and BBQ park. Other amenities include Billiards Room, 24-hour Concierge and Security, Vale, Car Wash, Shuttle Bus, Library, Boat rental spaces. Flexible lease term. Unfurnished. Safe neighborhood surrounded by lakes and green spaces. 5-min walk to a lake and park. 15-min walk to shopping plazas and beach. Recently renovated ceiling, floors and wall paining.
Key facts
- Heated pools
- Fitness center
- Yoga studio
Tags
Neighborhood map
What this means for you Summary
Snapshot
- This is a 2-bed/2.0-bath multifamily listed at $335k.
Deal economics
- At list price, monthly cash flow is $558 ($7k/yr) — positive.
- The deal already cash-flows at list — no discount required.
- Meets the 1% rule at list price ($4k rent vs $335k).
- Cap rate 9.8% vs local median 5.2% in Hallandale Beach — top-decile yield for the area; either an underpriced asset or a hidden risk that comps aren't pricing in. Stress-test before assuming the spread holds.
Location & tenants
- Location reads 81/100 on livability (#86 in FL, #1,400 nationally) — a professional / high-income tenant draw. Strengths: commute A+, health & safety A+, crime B+; Watch: employment D-.
- Broward (suburban): math 42% / reading 53% proficiency, ranked #46 of 73 in FL (top 63%) — families likely to look elsewhere, expect single-tenant / working-renter base with shorter leases.
- Zoned schools: Gulfstream Academy of Hallandale Beach (math 32% / reading 40%, grade F, #1,670 of 2,144 statewide, top 78%, 1,317 students, 73% FRL); Nova Middle School (math 44% / reading 53%, grade C-, #274 of 571 statewide, top 50%, 1,284 students, 68% FRL); Nova High School (math 22% / reading 56%, grade F, #312 of 667 statewide, top 48%, 2,227 students, 59% FRL) — zoned schools average 67% FRL vs 51% district-wide (16 pts higher); higher-poverty schools than district average — tighter screening recommended.
- Market conditions: Rents flat; 1380 active listings in the ZIP; 40 comparable units currently listed for rent nearby; rentals at typical pace (median 16d on market — plan ~3-4 weeks tenant-placement turnaround); 2,111 units permitted in Broward County in 2024 (1,265 in 5+ unit buildings).
- At $4,177/mo this rent would consume 96% of the median local household income ($52k/yr) (locally 3293% of renters already pay >50% of income on rent) — very limited rent-growth headroom before tenants either downsize or default.
Forward outlook
- Local home prices are declining (-3.0%/yr); year-one equity from $2k of loan paydown is wiped out by about $10k of value loss. Plan a longer hold.
- Broward County population projected at +34% by 2050 — long-run rental-demand tailwind backs the buy-and-hold thesis.
Negotiation context
- Only 6 days on market — expect competitive offers; lowballing is unlikely to land.
- 27 sale attempts since 19y ago; this cycle's ask is 16% above the opening price — seller raised mid-cycle; expect resistance to lowballs.
Risks & watch-outs
- Watch-outs: flood insurance adds $427/mo.
- Climate carrying-cost: in FEMA flood zone AE (mandatory federal flood insurance); severe wind risk, 99% chance of damaging wind over 30y; extreme-heat days projected 7→24/yr by 2055 (HVAC capex compounding) — expect insurance premiums to compound above CPI over the hold.
Questions for the listing agent
- What's the actual annual flood-insurance premium (NFIP or private), and is the property in a SFHA with mandatory coverage?
- Is there a deadline driving the sale (1031 exchange, divorce, estate, relocation)? That informs how much negotiation room exists.
- What's the average days-on-market for RENTAL listings here right now (not sales)? A rising rental-DOM trend means longer vacancies and softer asking-rent achievability than the comps imply.
- What's the recent tenant-quality profile in this submarket — average credit score on applications, eviction rate, late-payment / NSF rate, and stable-employment percentage? A property-management company in the area should have these aggregated.
- How much new apartment / multifamily construction is in the pipeline within 1–3 miles? Heavy new supply (>2% of stock underway) typically softens rents 12–24 months out; light construction supports rent growth.
Investment metrics
- 1% rule
- 1.25% ✓
- Cap rate
- 9.82%
- Cash-on-cash
- 12.60%
- DSCR
- 1.56
- GRM
- 6.7
CMA / ARV
No comps found within radius.
Projected returns pro-forma
-3.0% appreciation · 0.43% rent growth · sell at horizon
- IRR
- -8.7%
- Equity multiple
- 0.69×
- Total profit
- $-28,942
- Equity at exit
- $49,950
- IRR
- -3.5%
- Equity multiple
- 0.80×
- Total profit
- $-19,152
- Equity at exit
- $28,965
Cash invested: $93,800 (down + closing). Projections, not guarantees.
Landlord ↔ Tenant lean methodology
- Overall (STATE)
- 87 Strongly Landlord-Friendly
- State Florida
- 87 Strongly Landlord-Friendly · R+3
- County
- — inherits STATE
- City
- — inherits STATE
ZIP-level market 33009
- Rents YoY
- 0.4%
- Active inventory
- 1380
- Price-to-rent
- 6.7×
Monthly cashflow live
- Estimated rent
- $4,177 high interval (Pro) →
- Mortgage (P&I)
- −$1,757
- Tax est. 1.5%
- −$419 /mo · $5,025/yr
- Insurance
- −$140
- Flood insurance flood zone
- −$427 /mo · $5,118/yr
- HOA
- −$0
- Vacancy / Maint / Mgmt
- −$877
- Net cashflow
- $558
Break-even live
Sensitivity live
| Price | -10% $790 | -5% $674 | +0% $558 | +5% $442 | +10% $327 |
|---|---|---|---|---|---|
| Rent | -10% $228 | -5% $393 | +0% $558 | +5% $723 | +10% $888 |
| Rate | -1.0pp $727 | -0.5pp $643 | base $558 | +0.5pp $471 | +1.0pp $383 |
UW: 25.0% down · 7.5% · 30yr · 1.5% tax · 5.0% vac · 8.0% maint · 8.0% mgmt
Financing live
Cash to close
- Down payment
- $83,750
- Closing costs
- $10,050
- Reserves months
- —
- Total cash needed
- —
Loan-product check · same deal, 3 products live
Conventional
25% down · 7.5% · 30yr
- Down + closing
- —
- Monthly P&I
- —
- Monthly cashflow
- —
- DSCR
- —
- Eligible?
- —
Personal DTI + credit; lowest rate.
DSCR
20% down · 8.5% · 30yr
- Down + closing
- —
- Monthly P&I
- —
- Monthly cashflow
- —
- DSCR
- —
- Eligible?
- —
No personal income docs; deal must DSCR.
Hard money
10% down · 12.0% · 12mo
- Down + closing
- —
- Monthly P&I
- —
- Monthly cashflow
- —
- DSCR
- —
- Eligible?
- —
Short-term bridge; refi at stabilization.
Rent comps 40 comps
| Address | Beds | Baths | Sqft | Rent | $/sqft | DOM | Units | Dist |
|---|---|---|---|---|---|---|---|---|
| 2500 Parkview Dr #1112 Hallandale Beach, FL | 2.0 | 2.0 | 1580 | $3,800 | $2.41 | 26d | 1 | 0.01mi |
| 2500 Parkview Dr #2518 Hallandale Beach, FL | 2.0 | 2.0 | 1280 | $4,000 | $3.12 | 15d | 1 | 0.01mi |
| 2500 Parkview Dr #2518 Hallandale Beach, FL | 2.0 | 2.0 | 1280 | $4,000 | $3.12 | 9d | 1 | 0.01mi |
| 2753 S Parkview Dr Hallandale Beach, FL | 2.0 | 2.0 | 1680 | $3,699 | $2.20 | 19d | 1 | 0.14mi |
| 513 Leslie Dr #513 Hallandale Beach, FL | 3.0 | 2.0 | 1624 | $5,250 | $3.23 | 26d | 1 | 0.16mi |
| 523 Leslie Dr Hallandale Beach, FL | 3.0 | 2.0 | 1624 | $4,950 | $3.05 | 26d | 1 | 0.17mi |
| 825 NE 26th Ave Hallandale Beach, FL | 3.0 | 2.0 | 1844 | $4,200 | $2.28 | 26d | 1 | 0.20mi |
| 1001 Three Islands Blvd #331 Hallandale Beach, FL | 3.0 | 2.5 | 1750 | $3,780 | $2.16 | 0d | 1 | 0.29mi |
| 3800 S Ocean Dr #1818 Hollywood, FL | 2.0 | 2.0 | 1270 | $4,200 | $3.31 | 9d | 1 | 0.41mi |
| 3800 S Ocean Dr #1818 Hollywood, FL | 2.0 | 2.0 | 1270 | $3,800 | $2.99 | 6d | 1 | 0.41mi |
| 3800 S Ocean Dr Hollywood, FL | 2.0 | 2.0 | 1302 | $3,750 | $2.88 | 5d | 3 | 0.42mi |
| 3800 S Ocean Dr Hollywood, FL | 2.0 | 2.0 | 1301 | $3,775 | $2.90 | 7d | 2 | 0.42mi |
| 1529 Shoreline Way #1529 Hollywood, FL | 3.0 | 2.5 | 1784 | $7,750 | $4.34 | 13d | 1 | 0.43mi |
| 1529 Shoreline Way #1529 Hollywood, FL | 3.0 | 2.0 | 1784 | $7,500 | $4.20 | 3d | 1 | 0.43mi |
| 1529 Shoreline Way Hollywood, FL | 3.0 | 2.5 | 1784 | $7,500 | $4.20 | 9d | 1 | 0.43mi |
| 3505 S Ocean Dr Hollywood, FL | 1.0–2.0 | 1.5–2.0 | 1085 | $6,500 | $5.99 | 14d | 17 | 0.45mi |
| 3505 S Ocean Dr Hollywood, FL | 1.0–2.0 | 1.5–2.0 | 1085 | $6,500 | $5.99 | 12d | 18 | 0.45mi |
| 3101 S Ocean Dr #1904 Hollywood, FL | 2.0 | 2.5 | 1733 | $5,500 | $3.17 | 23d | 1 | 0.45mi |
| 3101 S Ocean Dr #1504 Hollywood, FL | 2.0 | 2.5 | 1733 | $7,500 | $4.33 | 26d | 1 | 0.45mi |
| 3725 S Ocean Dr Hollywood, FL | 2.0–3.0 | 2.0 | 1454 | $4,000 | $2.75 | 26d | 6 | 0.48mi |
| 3725 S Ocean Dr Hollywood, FL | 2.0–3.0 | 2.0 | 1377 | $4,000 | $2.90 | 15d | 8 | 0.48mi |
| 3725 S Ocean Dr Hollywood, FL | 2.0–3.0 | 2.0 | 1377 | $4,000 | $2.90 | 4d | 7 | 0.48mi |
| 3725 S Ocean Dr Unit 1339235P Hollywood, FL | 2.0 | 2.0 | 1248 | $5,432 | $4.35 | 0d | 1 | 0.48mi |
| 3001 S Ocean Dr #1211 Hollywood, FL | 2.0 | 2.0 | 1208 | $4,750 | $3.93 | 26d | 1 | 0.48mi |
| 3001 S Ocean Dr #1211 Hollywood, FL | 2.0 | 2.0 | 1208 | $4,750 | $3.93 | 9d | 1 | 0.48mi |
| 1755 E Hallandale Beach Blvd Unit 2207E Hallandale Beach, FL | 2.0 | 2.0 | 1354 | $3,950 | $2.92 | 26d | 1 | 0.48mi |
| 1755 E Hallandale Beach Blvd Unit 1407E Hallandale Beach, FL | 2.0 | 2.0 | 1354 | $3,650 | $2.70 | 26d | 1 | 0.48mi |
| 4010 S Ocean Dr Hollywood, FL | 1.0–3.0 | 1.0–3.5 | 1078 | $7,250 | $6.73 | 26d | 5 | 0.48mi |
| 2601 E Hallandale Beach Blvd Unit 1227344P Hallandale Beach, FL | 1.0–2.0 | 1.0–2.0 | 844 | $4,219 | $5.00 | 3d | 2 | 0.50mi |
| 1745 E Hallandale Beach Blvd Unit 2302W Hallandale Beach, FL | 3.0 | 2.0 | 1481 | $3,900 | $2.63 | 26d | 1 | 0.50mi |
| 1745 E Hallandale Beach Blvd Unit 2302W Hallandale Beach, FL | 3.0 | 2.0 | 1481 | $3,900 | $2.63 | 16d | 1 | 0.50mi |
| 1745 E Hallandale Beach Blvd Unit 802W Hallandale Beach, FL | 3.0 | 2.0 | 1481 | $3,600 | $2.43 | 26d | 1 | 0.50mi |
| 2751 S Ocean Dr Unit 508S Hollywood, FL | 3.0 | 2.5 | 1868 | $5,300 | $2.84 | 19d | 1 | 0.50mi |
| 2751 S Ocean Dr Unit 508S Hollywood, FL | 3.0 | 2.5 | 1868 | $5,300 | $2.84 | 9d | 1 | 0.50mi |
| 2751 S Ocean Dr Unit 1705 Hollywood, FL | 2.0 | 2.0 | 1360 | $5,000 | $3.68 | 9d | 1 | 0.50mi |
| 4010 S Ocean Dr Unit 1227249P Hollywood, FL | 1.0–3.0 | 1.5–2.5 | 1140 | $5,730 | $5.02 | 0d | 3 | 0.50mi |
| 4010 S Ocean Dr Unit R1108 Hollywood, FL | 3.0 | 2.5 | 1361 | $12,999 | $9.55 | 26d | 1 | 0.50mi |
| 4010 S Ocean Dr Unit R504 Hollywood, FL | 3.0 | 2.0 | 1122 | $10,000 | $8.91 | 26d | 1 | 0.50mi |
| 4010 S Ocean Dr Unit R2102 Hollywood, FL | 2.0 | 2.0 | 1075 | $6,500 | $6.05 | 26d | 1 | 0.50mi |
| 4010 S Ocean Dr Unit T3609 Hollywood, FL | 2.0 | 2.0 | 1060 | $6,300 | $5.94 | 5d | 1 | 0.50mi |
Listing history 50 events
-
2026-06-21days on market $335,000 Active 6 DOM
-
2026-06-18days on market $335,000 Active 3 DOM
-
2026-06-17days on market $335,000 Active 2 DOM
-
2026-06-16pricedays on market $335,000 Active 1 DOM
-
2026-06-15days on market $340,000 Active 219 DOM
-
2026-06-13days on market $340,000 Active 217 DOM
-
2026-06-09days on market $340,000 Active 213 DOM
-
2026-06-07days on market $340,000 Active 211 DOM
-
2026-06-04days on market $340,000 Active 208 DOM
-
2026-06-03days on market $340,000 Active 207 DOM
-
2026-06-02days on market $340,000 Active 206 DOM
-
2026-06-01days on market $340,000 Active 205 DOM
-
2026-05-31days on market $340,000 Active 204 DOM
-
2026-04-23$289,000 Active
-
2026-04-23historical
-
2026-03-14$3,100
-
2026-03-14$1,800
-
2026-01-01historical $1,800
-
2025-11-26$1,800
-
2025-11-09price $340,000
-
2025-11-08$2,500 Active
-
2025-04-19historical $2,000
-
2025-03-16$2,000
-
2025-03-04historical $2,000
-
2025-02-17$2,000
-
2025-01-25historical $2,000
-
2025-01-16historical $2,000
-
2025-01-15historical $2,000
-
2025-01-07$2,000
-
2025-01-07$2,100
-
2024-12-12$2,100
-
2024-12-12historical $2,350
-
2024-12-08$2,350
-
2024-10-17historical $3,200
-
2024-10-03$3,200
-
2024-09-17historical $2,150
-
2024-09-17$2,150
-
2024-04-26historical $2,800
-
2024-04-10$2,800
-
2024-04-10historical $2,800
-
2024-03-31$2,800
-
2024-03-31historical $2,800
-
2024-03-30$2,800
-
2024-03-22historical $3,500
-
2024-03-05$3,500
-
2024-02-23historical $3,500
-
2024-01-15historical $3,500
-
2024-01-15$3,500
-
2023-12-21$3,500
-
2022-12-29historical
ⓘ Source: listings_history table (triggers on properties + properties_extension) + one-shot
backfill from property_details.listing_events for pre-trigger history.
Climate risk First Street
- Flood 9/10 Extreme FEMA zone AE · 99% chance over 30 yrs
- Wildfire 1/10 Low
- Heat 10/10 Extreme 7 d/yr ≥104°F today · 24 d/yr by 30 yrs out
- Wind 10/10 Extreme 99% chance of damaging wind over 30 yrs
- Air quality 2/10 Low 1 unhealthy d/yr today · 2 by 30 yrs out
Nearby sold comps map
Loading sold comps map…
Walkable amenities ~0.75 mi
Loading nearby amenities…
Taxation est. · year 1
- Rental income
- $50,123
- − Mortgage interest
- −$18,765
- − Property taxes
- −$5,025
- − Insurance
- −$6,794
- − Repairs & maintenance
- −$4,010
- − Management
- −$4,010
- − Depreciation
- −$9,745
- Taxable income
- $1,774
- Est. tax owed @ 24.0%
- −$426
- After-tax cash flow
- $6,272/yr
For passive investors: Depreciation is non-cash, so a rental often shows a tax loss while cash-flowing — sheltering income. Rental losses are passive: they offset passive income freely, and up to $25,000/yr can offset ordinary (W-2) income if you actively participate and your MAGI is under $100k (phasing out to $0 by $150k); unused losses carry forward. On sale, claimed depreciation is recaptured at up to 25%, and gains may owe capital-gains tax (a 1031 exchange can defer both). Figures are a year-1 estimate at your 24.0% rate — not tax advice; consult a CPA.
Schools (NCES district)
- District
- Broward
- NCES district ID
- 1200180
- Math proficiency
- 42% ▼ -18.00%
- Reading proficiency
- 53% ▼ -5.00%
- Median HH income
- $52,139
- Composite
- 40.88/100
- National rank
- #3621
- State rank
- #46 of 73 in FL
Livability — Hallandale Beach
- Score
- 81/100
- State rank
- #86
- US rank
- #1400
Category grades
Schools grade is shown separately in the Schools card above.
Census & demographics
- Census place
- Hallandale Beach, FL
- County
- Broward County · 1,963,430 people
- City population
- 44,021
- Metro
- Miami-Fort Lauderdale-Pompano Beach, FL
- Population (ZIP)
- 44,502
- Household income
- $52,079
- Rent vs Own
- Severe rent burden
- 3293.0
Population outlook (Broward County) Hauer SSP2
- Today (2025)
- 2,207,033 people
- By 2030
- 2,360,704 · +7.0%
- By 2040
- 2,661,208 · +20.6%
- By 2050
- 2,946,698 · +33.5%
- By 2075
- 3,602,273 · +63.2%
- By 2100
- 3,970,984 · +79.9%
Race, ethnicity, and origin ACS 2023
- Neighborhood character
- Diverse neighborhood (Simpson 0.67)
- Race & ethnicity
- Hispanic / Latino 39% White 39% Two or more races 24% Black 17% Asian 1%
- Hispanic origin (detail)
- Mexican 2% Puerto Rican 3% Cuban 9% Dominican 3% Salvadoran 2%
- Common ancestry
- Scotch-Irish 5% Hispanic 5% Subsaharan African 3%
- Foreign-born
- 51% · Canada, Jamaica, Dominican Republic
- Languages at home
- 38% English-only · Spanish 36% Russian/Polish/Slavic 12% French/Haitian/Cajun 7%
Political lean MEDSL · Broward
- 2024 margin
- D (+17.0) · D 58.0% · R 41.0%
- 2008→2024 swing
- -17.8pp toward R · 2008: 34.7pp · 2024: 17.0pp
- All cycles
- 2024: D+17.0 2020: D+29.8 2016: D+35.0 2012: D+34.9 2008: D+34.7
Not yet ingested
- Civics
- —
Market trends
- HPI YoY
- ▼ -299.13%
- Current HPI
- 329.9081
- Rent YoY
- ▲ 0.43%
- Metro
- Miami-Fort Lauderdale-Pompano Beach, FL
- State GDP YoY
- ▲ 3.28%
- F500 in state
- 36
Industry mix (Fortune 500 HQ in FL)
| Industry | F500 HQs | Revenue |
|---|---|---|
| Industrial Technology | 2 | $29B |
|
||
| Insurance | 2 | $17B |
|
||
| Retail | 1 | $60B |
|
||
| Technology Distribution | 1 | $58B |
|
||
| Homebuilding | 1 | $35B |
|
||
| Technology Manufacturing | 1 | $35B |
|
||
Price history
+20.9% since first listed58 events — show timeline
- 2026-04-23 Listing Removed — MARMLS
- 2026-04-23 Listed $289,000 MARMLS
- 2026-03-14 Listed for Rent $3,100 SHOWMOJO
- 2026-03-14 Listed for Rent $1,800 SHOWMOJO
- 2026-01-01 Rental Removed $1,800 SHOWMOJO
- 2025-11-26 Listed for Rent $1,800 SHOWMOJO
- 2025-11-09 Price Changed $340,000 ForSaleByOwner.com
- 2025-11-08 Listed $2,500 ForSaleByOwner.com
- 2025-04-19 Rental Removed $2,000 TURBOTENANT
- 2025-03-16 Listed for Rent $2,000 TURBOTENANT
- 2025-03-04 Rental Removed $2,000 TURBOTENANT
- 2025-02-17 Listed for Rent $2,000 TURBOTENANT
- 2025-01-25 Rental Removed $2,000 TURBOTENANT
- 2025-01-16 Rental Removed $2,000 MARMLS
- 2025-01-15 Rental Removed $2,000 MARMLS
- 2025-01-07 Listed for Rent $2,000 MARMLS
- 2025-01-07 Listed for Rent $2,100 TURBOTENANT
- 2024-12-12 Listed for Rent $2,100 MARMLS
- 2024-12-12 Rental Removed $2,350 LISTANZA
- 2024-12-08 Listed for Rent $2,350 LISTANZA
- 2024-10-17 Rental Removed $3,200 RENTALBEAST
- 2024-10-03 Listed for Rent $3,200 RENTALBEAST
- 2024-09-17 Rental Removed $2,150 TURBOTENANT
- 2024-09-17 Listed for Rent $2,150 TURBOTENANT
- 2024-04-26 Rental Removed $2,800 TURBOTENANT
- 2024-04-10 Listed for Rent $2,800 TURBOTENANT
- 2024-04-10 Rental Removed $2,800 APPFOLIO
- 2024-03-31 Listed for Rent $2,800 APPFOLIO
- 2024-03-31 Rental Removed $2,800 TURBOTENANT
- 2024-03-30 Listed for Rent $2,800 TURBOTENANT
- 2024-03-22 Rental Removed $3,500 REALLYO
- 2024-03-05 Listed for Rent $3,500 REALLYO
- 2024-02-23 Rental Removed $3,500 REALLYO
- 2024-01-15 Rental Removed $3,500 VLS
- 2024-01-15 Listed for Rent $3,500 REALLYO
- 2023-12-21 Listed for Rent $3,500 VLS
- 2022-12-29 Listing Removed — MARMLS
- 2022-12-29 Listing Removed — MARMLS
- 2022-12-01 Rental Removed — RMLSFL
- 2022-09-15 Listed $595,000 MARMLS
- 2022-09-07 Price Changed $625,000 MARMLS
- 2022-07-11 Listed $615,000 MARMLS
- 2022-04-05 Sold (MLS) $485,000 MARMLS
- 2022-03-30 Pending — MARMLS
- 2022-03-30 Listed $485,000 MARMLS
- 2021-03-19 Listing Removed — MARMLS
- 2021-02-05 Listing Removed — MARMLS
- 2021-01-19 Listed $948,888 MARMLS
- 2020-12-28 Price Changed $948,888 MARMLS
- 2020-12-12 Price Changed $950,000 MARMLS
- 2020-08-17 Price Changed $985,000 MARMLS
- 2020-08-12 Listed $1,050,000 MARMLS
- 2018-07-05 Listing Removed — MARMLS
- 2018-07-05 Listing Removed — MARMLS
- 2018-07-04 Listed $199,900 MARMLS
- 2018-07-04 Listed $209,900 MARMLS
- 2008-03-19 Listing Removed — Beaches MLS
- 2007-03-19 Listed $239,000 Beaches MLS
Cash-flow waterfall
monthlySold comps — $/sqft
last 12 mo · ≤1 miLoading sold comps…