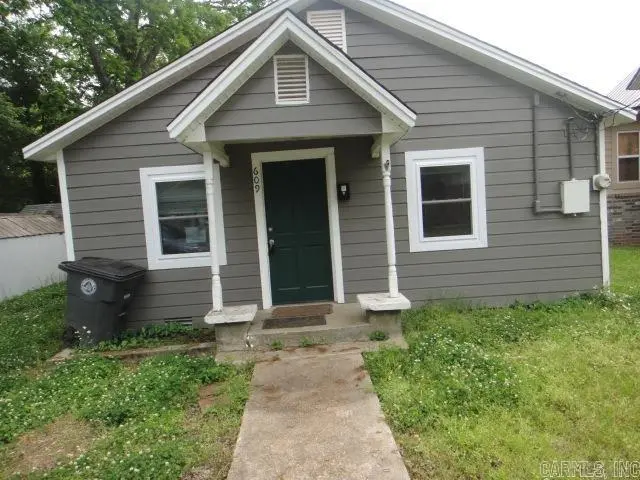
609 W Vine Ave · Searcy, AR
Flood risk 1/10 · Minimal
- FEMA flood zone
- X (unshaded)
- Chance of flooding over 30 yrs
- 0.0%
- Est. flood insurance / yr
- $507 – $1,088
Fire risk 4/10 · Minor
- Est. fire insurance / yr
- $1,499 – $2,785
Heat risk 6/10 · Moderate
- Hot days now (above 111°F)
- 7 days/yr
- Hot days in 30 yrs
- 19 days/yr
Wind risk 3/10 · Minor
- Chance of severe wind over 30 yrs
- 6.0%
Air-quality risk 1/10 · Minimal
- Unhealthy air days now
- 0 days/yr
- Unhealthy air days in 30 yrs
- 0 days/yr
Risk factors via First Street. Map © Google.
Why this score? — see what drove the B+ grade
The composite is a weighted blend of 9 inputs, each scored 0–100. Each bar is that input's sub-score; the figure is the points it added to the 100-point composite (weight × sub-score).
- Cash flow +30.0/30.0
- ARV discount +15.0/15.0
- DSCR +10.0/10.0
- 1% rule +9.5/10.0
- Schools +3.8/10.0
- Livability +3.5/5.0
- Rent growth +2.5/5.0
- Condition / age +2.5/5.0
- Appreciation +0.0/10.0
$65,000
🖨 Deal sheet (PDF) 📄 Offer letter ✓ Due diligence
Listing remarks MLS
updated 3br 2ba house with hardie backer siding on the outside, new luxury vinyl flooring throughout the house. , and new paint. Fenced in backyard and a storage building.
Key facts
- Storage buildings
- Close to post office
- Chain fence
Tags
Property features AI
Finance
- Financial info: Financing available: conventional loan or cash
Exterior
- Utilities: Public sewer; Public water; Municipal electric (Entergy); Natural gas
- Home design: Metal/vinyl siding
- Construction: Architectural shingle roof; Slab foundation
- Exterior features: Fully fenced yard; Outside storage area; Chain link fencing; Paved road access
Interior
- Kitchen: Free-standing stove; Dishwasher
- Flooring: Vinyl flooring
- Bathrooms: 2 full bathrooms
- Heating & cooling: Central heating; Central cooling
- Interior features: Washer connection; Electric dryer connection; Gas water heater; Sheetrock walls/ceilings
- Laundry & utility: Laundry room
Neighborhood map
What this means for you Summary
Snapshot
- This is a 3-bed/2.0-bath single-family listed at $65k.
Deal economics
- At list price, monthly cash flow is $361 ($4k/yr) — positive.
- The deal already cash-flows at list — no discount required.
- Meets the 1% rule at list price ($945 rent vs $65k).
- Recommended offer: $64k (1.5% below list) — sets the bar for market timing.
- Cap rate 13.0% vs local median 3.2% in Searcy — top-decile yield for the area; either an underpriced asset or a hidden risk that comps aren't pricing in. Stress-test before assuming the spread holds.
Location & tenants
- Location reads 70/100 on livability (#51 in AR) — a middle-class / working-renter tenant base. Strengths: cost of living A+, health & safety A+, housing A-; Watch: crime D, commute F, employment F.
- Searcy School District (town): math 47% / reading 43% proficiency, ranked #37 of 238 in AR (top 16%) — families likely to look elsewhere, expect single-tenant / working-renter base with shorter leases.
- Zoned schools: Mcrae Elementary School (math 52% / reading 37%, grade F, #143 of 454 statewide, top 36%, 422 students, 58% FRL); Southwest Middle School (math 51% / reading 42%, grade D+, #49 of 201 statewide, top 26%, 910 students, 50% FRL); Searcy High School (math 30% / reading 42%, grade F, #81 of 292 statewide, top 29%, 1,166 students, 39% FRL).
- Market conditions: 176 active listings in the ZIP; 10 comparable units currently listed for rent nearby; rentals lingering (median 46d on market — plan ~5-8 weeks vacancy on turnover, expect pricing pressure); 100% of comp listings sitting > 30 days — soft ceiling on asking rent; 219 units permitted in White County in 2024 (36 in 5+ unit buildings).
Forward outlook
- Local home prices are declining (-3.0%/yr); year-one equity from $449 of loan paydown is wiped out by about $2k of value loss. Plan a longer hold.
- White County population projected at +7% by 2050 — modest demand growth; plan on rents tracking national, not racing it.
- At projected returns (-3.0% appreciation + 3.0% rent growth), your $18k cash investment doubles in ~6 years — after that, you're playing with house money.
Negotiation context
- It's been on market 20 days — a 2% lower offer ($64k) is reasonable based on typical stale-listing flexibility.
- 3 sale attempts since 3y ago with the ask held roughly flat each time — persistent listings suggest the price (not the market) is what's stuck; bring a comps-based counter.
Risks & watch-outs
- Watch-outs: built in 1950 — expect roof / HVAC / electrical / plumbing capex.
- Climate carrying-cost: extreme-heat days projected 7→19/yr by 2055 (HVAC capex compounding) — expect insurance premiums to compound above CPI over the hold.
Questions for the listing agent
- Built in 1950 — when were the roof, HVAC, electrical panel, plumbing, and water heater last replaced?
- Is there a deadline driving the sale (1031 exchange, divorce, estate, relocation)? That informs how much negotiation room exists.
- Crime grade is D in this area — have there been break-ins, vandalism, or insurance claims at this property in the last 3 years? What carrier currently insures it and at what premium?
- What's the average days-on-market for RENTAL listings here right now (not sales)? A rising rental-DOM trend means longer vacancies and softer asking-rent achievability than the comps imply.
- What's the recent tenant-quality profile in this submarket — average credit score on applications, eviction rate, late-payment / NSF rate, and stable-employment percentage? A property-management company in the area should have these aggregated.
- How much new for-sale + rental construction is in the pipeline within 1–3 miles? Heavy new supply typically softens prices + rents 12–24 months out; constrained supply supports both.
Investment metrics
- 1% rule
- 1.45% ✓
- Cap rate
- 12.95%
- Cash-on-cash
- 23.78%
- DSCR
- 2.06
- GRM
- 5.7
CMA / ARV
- ARV (median comp)
- $104,420
- List price
- $65,000
- Delta
- -37.75%
- Verdict
- UNDERPRICED
- Comps
- 20 within 1.0 mi
Show comp detail 12 sales within ~0.75 mi
| Address | Dist | Beds/Ba | Sqft | Sold | Price | $/sf | Match |
|---|---|---|---|---|---|---|---|
| 611 W Moore Ave | 0.12mi | 3/1.0 | 1,080 (-4%) | 10mo | $143,000 | $132 | 74 |
| 710 N Pne | 0.34mi | 3/1.5 | 1,088 (-4%) | 3mo | $119,900 | $110 | 74 |
| 507 W Academy | 0.09mi | 3/1.0 | 1,188 (+5%) | 11mo | $75,000 | $63 | 74 |
| 905 W Center Ave | 0.27mi | 3/1.0 | 1,182 (+5%) | 4mo | $162,000 | $137 | 72 |
| 207 S Elm St | 0.34mi | 3/1.0 | 1,057 (-6%) | 0mo | $107,000 | $101 | 69 |
| 603 N Sowell | 0.35mi | 3/1.0 | 1,144 (+1%) | 11mo | $146,000 | $128 | 68 |
| 1206 W Race St | 0.36mi | 2/1.0 (-1) | 1,080 (-4%) | 9mo | $132,000 | $122 | 60 |
| 710 N Sowell | 0.36mi | 3/2.0 | 960 (-15%) | 4mo | $130,000 | $135 | 55 |
| 411 N Olive St | 0.45mi | 2/2.0 (-1) | 960 (-15%) | 2mo | $140,000 | $146 | 48 |
| 608 N Main | 0.45mi | 2/1.0 (-1) | 1,242 (+10%) | 10mo | $100,000 | $81 | 45 |
| 613 Sanibel St | 0.62mi | 3/2.0 | 1,292 (+14%) | 7mo | $185,000 | $143 | 41 |
| 1505 W Park Ave | 0.64mi | 4/1.5 (+1) | 1,240 (+10%) | 11mo | $130,500 | $105 | 37 |
Match score weights: distance 35% · size 25% · config 20% · recency 20%. Top-matched comps best support the ARV.
Projected returns pro-forma
-3.0% appreciation · 3.0% rent growth · sell at horizon
- IRR
- 16.9%
- Equity multiple
- 1.68×
- Total profit
- $12,413
- Equity at exit
- $9,692
- IRR
- 25.4%
- Equity multiple
- 3.21×
- Total profit
- $40,287
- Equity at exit
- $5,620
Cash invested: $18,200 (down + closing). Projections, not guarantees.
Landlord ↔ Tenant lean methodology
- Overall (STATE)
- 92 Strongly Landlord-Friendly
- State Arkansas
- 92 Strongly Landlord-Friendly · R+14
- County
- — inherits STATE
- City
- — inherits STATE
ZIP-level market 72143
- Home prices YoY
- -28.4%
- Active inventory
- 176
- Price-to-rent
- 5.7×
Monthly cashflow live
- Estimated rent
- $945 high interval (Pro) →
- Mortgage (P&I)
- −$341
- Tax from tax record
- −$18 /mo · $216/yr
- Insurance
- −$27
- HOA
- −$0
- Vacancy / Maint / Mgmt
- −$198
- Net cashflow
- $361
Break-even live
Sensitivity live
| Price | -10% $397 | -5% $379 | +0% $361 | +5% $342 | +10% $324 |
|---|---|---|---|---|---|
| Rent | -10% $286 | -5% $323 | +0% $361 | +5% $398 | +10% $435 |
| Rate | -1.0pp $393 | -0.5pp $377 | base $361 | +0.5pp $344 | +1.0pp $327 |
UW: 25.0% down · 7.5% · 30yr · 1.5% tax · 5.0% vac · 8.0% maint · 8.0% mgmt
Financing live
Cash to close
- Down payment
- $16,250
- Closing costs
- $1,950
- Reserves months
- —
- Total cash needed
- —
Loan-product check · same deal, 3 products live
Conventional
25% down · 7.5% · 30yr
- Down + closing
- —
- Monthly P&I
- —
- Monthly cashflow
- —
- DSCR
- —
- Eligible?
- —
Personal DTI + credit; lowest rate.
DSCR
20% down · 8.5% · 30yr
- Down + closing
- —
- Monthly P&I
- —
- Monthly cashflow
- —
- DSCR
- —
- Eligible?
- —
No personal income docs; deal must DSCR.
Hard money
10% down · 12.0% · 12mo
- Down + closing
- —
- Monthly P&I
- —
- Monthly cashflow
- —
- DSCR
- —
- Eligible?
- —
Short-term bridge; refi at stabilization.
Rent comps 10 comps
| Address | Beds | Baths | Sqft | Rent | $/sqft | DOM | Units | Dist |
|---|---|---|---|---|---|---|---|---|
| 508 N Apple St Searcy, AR | 2.0 | 1.0 | 926 | $800 | $0.86 | 45d | 1 | 0.13mi |
| 104 E Academy Ave Unit 1 Searcy, AR | 2.0 | 2.0 | 1052 | $950 | $0.90 | 45d | 1 | 0.39mi |
| 909 Holmes Rd Searcy, AR | 1.0–2.0 | 1.0–2.0 | 795 | $865 | $1.09 | 45d | 13 | 0.61mi |
| 701 S Elm St Unit H1 Searcy, AR | 2.0 | 1.0 | 850 | $839 | $0.99 | 45d | 1 | 0.68mi |
| 32 Robbye Ln Searcy, AR | 3.0 | 2.0 | 1331 | $1,400 | $1.05 | 45d | 1 | 1.05mi |
| 1104 E Race Ave Searcy, AR | 2.0 | 1.0 | 700 | $750 | $1.07 | 45d | 1 | 1.10mi |
| 28 Stoneybrook Ln Unit 16 Searcy, AR | 2.0 | 1.5 | 900 | $755 | $0.84 | 45d | 1 | 1.13mi |
| 32 Stoneybrook Ln Apt 7 Searcy, AR | 2.0 | 1.0 | 720 | $715 | $0.99 | 45d | 1 | 1.16mi |
| 32 Stoneybrook Ln Unit 5 Searcy, AR | 2.0 | 1.0 | 720 | $745 | $1.03 | 45d | 1 | 1.16mi |
| 400 Meadow Lake Cir Searcy, AR | 1.0–2.0 | 1.0 | 610 | $860 | $1.41 | 45d | 7 | 1.22mi |
Listing history 17 events
-
2026-06-22days on market $65,000 Active 20 DOM
-
2026-06-21days on market $65,000 Active 19 DOM
-
2026-06-19days on market $65,000 Active 17 DOM
-
2026-06-18days on market $65,000 Active 16 DOM
-
2026-06-17statusdays on market $65,000 Active 15 DOM
-
2026-06-16days on market $65,000 Back on Market 14 DOM
-
2026-06-15days on market $65,000 Back on Market 13 DOM
-
2026-06-14days on market $65,000 Back on Market 11 DOM
-
2026-06-12statusdays on market $65,000 Back on Market 10 DOM
-
2026-05-14status Under Contract 535-char remark
-
2026-05-13status Pending (FC, SS, REO) 535-char remark
-
2026-05-05$65,000 New Listing 535-char remark
-
2023-02-21soldstatus $89,000
-
2023-02-17soldstatus $89,000 Sold 173-char remark
Show marketing remark (173 chars)
updated 3br 2ba house with hardie backer siding on the outside, new luxury vinyl flooring throughout the house. , and new paint. Fenced in backyard and a storage building.
-
2023-01-10status Under Contract 173-char remark
Show marketing remark (173 chars)
updated 3br 2ba house with hardie backer siding on the outside, new luxury vinyl flooring throughout the house. , and new paint. Fenced in backyard and a storage building.
-
2023-01-05$85,900 New Listing 173-char remark
Show marketing remark (173 chars)
updated 3br 2ba house with hardie backer siding on the outside, new luxury vinyl flooring throughout the house. , and new paint. Fenced in backyard and a storage building.
-
2001-08-08soldstatus $73,182
ⓘ Source: listings_history table (triggers on properties + properties_extension) + one-shot
backfill from property_details.listing_events for pre-trigger history.
Tax reassessment forecast AR · Resets to sale price
- Current annual tax
- $216 · $18/mo
- Projected year-2 tax
- $416 · $35/mo
- Expected delta
- +$200/yr (+$17/mo · 92.6%)
ⓘ Screening estimate from a state-policy table — verify with the county assessor before closing.
Climate risk First Street
- Flood 1/10 Low FEMA zone X (unshaded) · 0% chance over 30 yrs
- Wildfire 4/10 Moderate
- Heat 6/10 Major 7 d/yr ≥111°F today · 19 d/yr by 30 yrs out
- Wind 3/10 Moderate 6% chance of damaging wind over 30 yrs
- Air quality 1/10 Low 0 unhealthy d/yr today · 0 by 30 yrs out
Nearby sold comps map
Loading sold comps map…
Walkable amenities ~0.75 mi
Loading nearby amenities…
Taxation est. · year 1
- Rental income
- $11,341
- − Mortgage interest
- −$3,641
- − Property taxes
- −$216
- − Insurance
- −$325
- − Repairs & maintenance
- −$907
- − Management
- −$907
- − Depreciation
- −$1,891
- Taxable income
- $3,453
- Est. tax owed @ 24.0%
- −$829
- After-tax cash flow
- $3,499/yr
For passive investors: Depreciation is non-cash, so a rental often shows a tax loss while cash-flowing — sheltering income. Rental losses are passive: they offset passive income freely, and up to $25,000/yr can offset ordinary (W-2) income if you actively participate and your MAGI is under $100k (phasing out to $0 by $150k); unused losses carry forward. On sale, claimed depreciation is recaptured at up to 25%, and gains may owe capital-gains tax (a 1031 exchange can defer both). Figures are a year-1 estimate at your 24.0% rate — not tax advice; consult a CPA.
Schools (NCES district)
- District
- Searcy School District
- NCES district ID
- 0512210
- Math proficiency
- 47% ▼ -11.00%
- Reading proficiency
- 43% ▼ -10.00%
- Median HH income
- $44,318
- Composite
- 38.12/100
- National rank
- #4272
- State rank
- #37 of 238 in AR
Livability — Searcy
- Score
- 70/100
- State rank
- #51
- US rank
- #7408
Category grades
Schools grade is shown separately in the Schools card above.
Census & demographics
- Census place
- Searcy, AR
- County
- White County · 35,000 people
- City population
- 35,000
- Metro
- Searcy, AR
- Population (ZIP)
- 35,000
- Household income
- $58,344
- Rent vs Own
- Severe rent burden
- 804.0
Population outlook (White County) Hauer SSP2
- Today (2025)
- 82,310 people
- By 2030
- 83,861 · +1.9%
- By 2040
- 86,492 · +5.1%
- By 2050
- 88,246 · +7.2%
- By 2075
- 91,307 · +10.9%
- By 2100
- 91,548 · +11.2%
Race, ethnicity, and origin ACS 2023
- Neighborhood character
- Predominantly White (82%)
- Race & ethnicity
- White 82% Black 7% Hispanic / Latino 6% Two or more races 5%
- Hispanic origin (detail)
- Mexican 4%
- Common ancestry
- Italian 2% Slovak 1% Serbian 1%
- Foreign-born
- 2% · Canada
- Languages at home
- 95% English-only · Spanish 4%
Political lean MEDSL · White
- 2024 margin
- Solid R (+61.2) · D 18.3% · R 79.5% · Other 2.2%
- 2008→2024 swing
- -14.0pp toward R · 2008: -47.2pp · 2024: -61.2pp
- All cycles
- 2024: R+61.2 2020: R+58.9 2016: R+57.9 2012: R+53.7 2008: R+47.2
Not yet ingested
- Civics
- —
Market trends
- HPI YoY
- ▼ -81.60%
- Current HPI
- 206.0334
- Rent YoY
- —
- Metro
- Searcy, AR
- State GDP YoY
- ▲ 3.80%
- F500 in state
- 10
Industry mix (Fortune 500 HQ in AR)
| Industry | F500 HQs | Revenue |
|---|---|---|
| Retail | 1 | $681B |
|
||
| Food / Agriculture | 1 | $53B |
|
||
| Retail / Energy | 1 | $22B |
|
||
| Transportation / Logistics | 1 | $12B |
|
||
| Energy | 1 | $4B |
|
||
Price history
-11.2% since first listed9 events — show timeline
- 2026-06-10 Relisted — CARMLS
- 2026-05-14 Pending — CARMLS
- 2026-05-13 Pending — CARMLS
- 2026-05-05 Listed $65,000 CARMLS
- 2023-02-21 Sold (Public Records) $89,000 Public Records
- 2023-02-17 Sold (MLS) $89,000 CARMLS
- 2023-01-10 Pending — CARMLS
- 2023-01-05 Listed $85,900 CARMLS
- 2001-08-08 Sold (Public Records) $73,182 Public Records
Property tax history
-1.8%/yrLatest (2025): $216 · +0.0% YoY. Source: county tax records.
Cash-flow waterfall
monthlySold comps — $/sqft
last 12 mo · ≤1 miLoading sold comps…