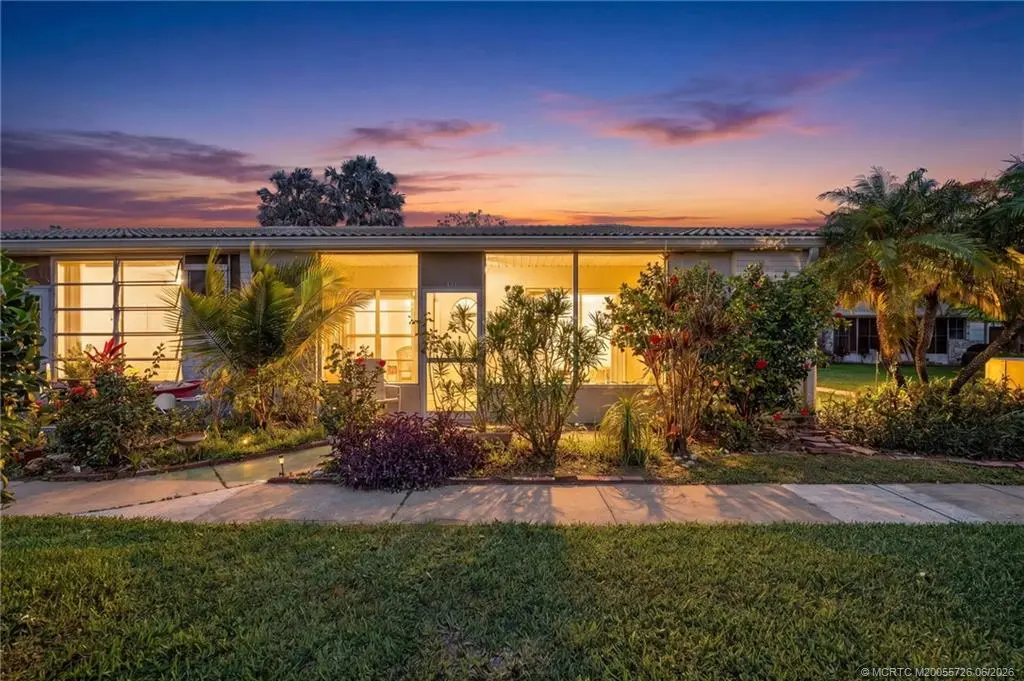
2227 SE Letha Ct · Stuart, FL
Flood risk 6/10 · Moderate
- FEMA flood zone
- X (unshaded)
- Chance of flooding over 30 yrs
- 0.74%
- Est. flood insurance / yr
- $507 – $1,088
Fire risk 1/10 · Minimal
- Est. fire insurance / yr
- $947 – $1,759
Heat risk 10/10 · Severe
- Hot days now (above 106°F)
- 7 days/yr
- Hot days in 30 yrs
- 26 days/yr
Wind risk 10/10 · Severe
- Chance of severe wind over 30 yrs
- 99.0%
Air-quality risk 2/10 · Minimal
- Unhealthy air days now
- 2 days/yr
- Unhealthy air days in 30 yrs
- 2 days/yr
Risk factors via First Street. Map © Google.
Why this score? — see what drove the D grade
The composite is a weighted blend of 9 inputs, each scored 0–100. Each bar is that input's sub-score; the figure is the points it added to the 100-point composite (weight × sub-score).
- Cash flow +9.7/30.0
- ARV discount +7.5/15.0
- 1% rule +7.3/10.0
- Schools +4.5/10.0
- Livability +4.2/5.0
- DSCR +2.8/10.0
- Condition / age +2.5/5.0
- Rent growth +2.3/5.0
- Appreciation +0.0/10.0
$159,900
🖨 Deal sheet 📄 Offer letter ✓ Due diligence
Listing remarks
Available for under $200,000, welcome home to this well-maintained 2BR/2BA condo located in the established Kingman Acres community in Stuart. This ALL AGE community offers a fantastic opportunity to enjoy the Florida lifestyle at an affordable price. Great central location close to Downtown Stuart, beaches, shopping, restaurants, & medical facilities. Spacious layout featuring tile flooring throughout, generous closet space, & new washer & dryer. Excellent potential for seasonal or year-round living. Enjoy the charm of this established community & convenient Florida lifestyle. Roof 2016.
Key facts
- New washer dryer
- Central location
- Tile flooring
Tags
Property features AI
Finance
- Financial info: Pet restrictions and limits apply
- HOA & community: Homeowners association; Association fee of $557; Association covers common areas, insurance, grounds maintenance, structure maintenance, road maintenance, sewer and water; Community clubhouse; Non-gated community; Community pool
Exterior
- Parking: Assigned parking; Guest parking
- Utilities: Cable available; Electricity available; Public water (connected); Public sewer (connected); Trash collection
- Home design: Single-story; Resale property; Barrel roof; Facing direction not specified
- Construction: Block and concrete construction
- Exterior features: Porch; Screened porch; Community pool; Has view; Paved road
Interior
- Kitchen: Built-In Oven; Dishwasher; Microwave; Refrigerator
- Bedrooms: 2 possible bedrooms
- Flooring: Tile
- Bathrooms: 2 full bathrooms
- Heating & cooling: Central heating; Central air conditioning
- Interior features: Furnished; Living/Dining room; Tile flooring
- Laundry & utility: Washer; Dryer
Neighborhood map
What this means for you Summary
Snapshot
- This is a 2-bed/2.0-bath condo listed at $160k.
Deal economics
- At list price, monthly cash flow is $-105 ($-1k/yr) — negative.
- To cash-flow at today's rent, offer at most $145k (9.5% below list).
- Meets the 1% rule at list price ($2k rent vs $160k).
- Recommended offer: $145k (9.5% below list) — sets the bar for cash-flow.
- Cap rate 5.5% vs local median 4.1% in Stuart — top-decile yield for the area; either an underpriced asset or a hidden risk that comps aren't pricing in. Stress-test before assuming the spread holds.
Location & tenants
- Location reads 84/100 on livability (#39 in FL, #790 nationally) — a professional / high-income tenant draw. Strengths: commute A+, housing A+, health & safety A+; Watch: crime C-, employment C-, amenities D.
- Martin (suburban): math 52% / reading 53% proficiency, ranked #24 of 73 in FL (top 33%) — acceptable for families but not a draw, mixed tenant base, ~2y average lease.
- Market conditions: Rents soft (-0.7%/yr); 256 active listings in the ZIP; 22 comparable units currently listed for rent nearby; rentals at typical pace (median 24d on market — plan ~3-4 weeks tenant-placement turnaround); 737 units permitted in Martin County in 2024 (167 in 5+ unit buildings).
- This rent runs 38% of the median local income ($63k/yr) — at the standard rent-burdened threshold; future hikes will face affordability resistance.
Forward outlook
- Local home prices are declining (-3.0%/yr); year-one equity from $1k of loan paydown is wiped out by about $5k of value loss. Plan a longer hold.
- Martin County population projected at +19% by 2050 — long-run rental-demand tailwind backs the buy-and-hold thesis.
Negotiation context
- It's been on market 15 days — a 2% lower offer ($158k) is reasonable based on typical stale-listing flexibility.
- Current owner paid $42k; list at $160k implies a 281% gain — meaningful room to come down on a strong offer.
Risks & watch-outs
- Watch-outs: HOA is 28% of rent.
- Climate carrying-cost: major flood risk; severe wind risk, 99% chance of damaging wind over 30y; extreme-heat days projected 7→26/yr by 2055 (HVAC capex compounding) — expect insurance premiums to compound above CPI over the hold.
Questions for the listing agent
- What do current leases actually rent for vs. the listed asking? Can we see a recent rent roll and the last 12 months of T-12 income?
- Built in 1977 — when were the roof, HVAC, electrical panel, plumbing, and water heater last replaced?
- What does the HOA fee cover, when was the last increase, and are there any pending special assessments or reserve-fund shortfalls?
- Any open or pending special assessments — roof, HVAC, plumbing, elevator, façade? What's the per-unit balance and payoff schedule, and is the seller paying it off at close or rolling it to the buyer?
- Is there a deadline driving the sale (1031 exchange, divorce, estate, relocation)? That informs how much negotiation room exists.
- Schools are A-rated — typically a magnet for longer-tenancy family renters. What's the average tenant stay here, and is there a school-zone premium baked into asking?
- The area grade is low — what's the realistic commute time and amenity access for the typical tenant pool here? Any planned neighborhood developments (good or bad) we should know about?
- What's the average days-on-market for RENTAL listings here right now (not sales)? A rising rental-DOM trend means longer vacancies and softer asking-rent achievability than the comps imply.
- What's the recent tenant-quality profile in this submarket — average credit score on applications, eviction rate, late-payment / NSF rate, and stable-employment percentage? A property-management company in the area should have these aggregated.
- How much new apartment / multifamily construction is in the pipeline within 1–3 miles? Heavy new supply (>2% of stock underway) typically softens rents 12–24 months out; light construction supports rent growth.
Investment metrics
- 1% rule
- 1.23% ✓
- Cap rate
- 5.51%
- Cash-on-cash
- -2.80%
- DSCR
- 0.88
- GRM
- 6.8
CMA / ARV
No comps found within radius.
Projected returns pro-forma
-3.0% appreciation · 0.0% rent growth · sell at horizon
- IRR
- -26.1%
- Equity multiple
- 0.15×
- Total profit
- $-37,978
- Equity at exit
- $23,842
- IRR
- -51.1%
- Equity multiple
- -0.40×
- Total profit
- $-62,465
- Equity at exit
- $13,825
Cash invested: $44,772 (down + closing). Projections, not guarantees.
Landlord ↔ Tenant lean methodology
- Overall (STATE)
- 87 Strongly Landlord-Friendly
- State Florida
- 87 Strongly Landlord-Friendly · R+3
- County
- — inherits STATE
- City
- — inherits STATE
ZIP-level market 34994
- Home prices YoY
- -27.1%
- Rents YoY
- -0.7%
- Active inventory
- 256
- Price-to-rent
- 6.8×
Monthly cashflow live
- Estimated rent
- $1,971 high interval (Pro) →
- Mortgage (P&I)
- −$839
- Tax est. 1.5%
- −$200 /mo · $2,398/yr
- Insurance
- −$67
- HOA
- −$557
- Vacancy / Maint / Mgmt
- −$414
- Net cashflow
- $-105
Break-even live
UW: 25.0% down · 7.5% · 30yr · 1.5% tax · 5.0% vac · 8.0% maint · 8.0% mgmt
Financing live
Cash to close
- Down payment
- $39,975
- Closing costs
- $4,797
- Reserves months
- —
- Total cash needed
- —
Loan-product check · same deal, 3 products live
Conventional
25% down · 7.5% · 30yr
- Down + closing
- —
- Monthly P&I
- —
- Monthly cashflow
- —
- DSCR
- —
- Eligible?
- —
Personal DTI + credit; lowest rate.
DSCR
20% down · 8.5% · 30yr
- Down + closing
- —
- Monthly P&I
- —
- Monthly cashflow
- —
- DSCR
- —
- Eligible?
- —
No personal income docs; deal must DSCR.
Hard money
10% down · 12.0% · 12mo
- Down + closing
- —
- Monthly P&I
- —
- Monthly cashflow
- —
- DSCR
- —
- Eligible?
- —
Short-term bridge; refi at stabilization.
Rent comps 22 comps
| Address | Beds | Baths | Sqft | Rent | $/sqft | DOM | Units | Dist |
|---|---|---|---|---|---|---|---|---|
| 1215 SE Glenwood Dr Stuart, FL | 2.0 | 2.0 | 1089 | $1,859 | $1.71 | 14d | 10 | 0.09mi |
| 2124 SE Edler Dr Stuart, FL | 2.0 | 2.0 | 876 | $1,800 | $2.05 | 23d | 1 | 0.20mi |
| 2118 SE Edler Dr Unit B Stuart, FL | 2.0 | 2.0 | 876 | $1,995 | $2.28 | 23d | 1 | 0.21mi |
| 2104 SE Edler Dr Stuart, FL | 1.0 | 1.0 | 726 | $1,500 | $2.07 | 23d | 1 | 0.24mi |
| 3031 SE Aster Ln Unit 608 Stuart, FL | 2.0 | 2.0 | 1019 | $1,870 | $1.84 | 23d | 1 | 0.34mi |
| 3151 SE Aster Ln #1306 Stuart, FL | 2.0 | 2.0 | 1034 | $1,800 | $1.74 | 23d | 1 | 0.35mi |
| 1290 SE Parkview Pl Unit A2 Stuart, FL | 2.0 | 2.0 | 1021 | $1,800 | $1.76 | 21d | 1 | 0.46mi |
| 3302 SE Aster Ln Stuart, FL | 2.0 | 2.0 | 888 | $1,900 | $2.14 | 23d | 1 | 0.49mi |
| 801 SE Central Pkwy #7 Stuart, FL | 2.0 | 2.0 | 1046 | $2,150 | $2.06 | 14d | 1 | 0.67mi |
| 3250 SE Commerce Ave Stuart, FL | 1.0–2.0 | 1.0–2.0 | 746 | $2,206 | $2.96 | 14d | 28 | 0.94mi |
| 400 SE Central Pkwy Stuart, FL | 1.0–2.0 | 1.0–2.0 | 918 | $2,640 | $2.87 | 14d | 16 | 0.96mi |
| 3003 SE Birch Ave Unit 3007 Stuart, FL | 2.0 | 1.0 | 950 | $2,200 | $2.32 | 23d | 1 | 1.02mi |
| 3002 SE Camino Ave Stuart, FL | 2.0 | 1.0 | 930 | $2,000 | $2.15 | 23d | 1 | 1.11mi |
| 2600 S Kanner Hwy Stuart, FL | 1.0–2.0 | 1.5–2.0 | 890 | $1,950 | $2.19 | 14d | 3 | 1.16mi |
| 3800 S Kanner Hwy Stuart, FL | 3.0 | 1.0–2.0 | 970 | $2,604 | $2.68 | 14d | 21 | 1.22mi |
| 4284 SE Cove Lake Cir Stuart, FL | 1.0 | 1.0 | 719 | $1,815 | $2.52 | 23d | 1 | 1.24mi |
| 1900 S Kanner Hwy Unit 2-203 Stuart, FL | 2.0 | 2.0 | 1086 | $1,800 | $1.66 | 14d | 1 | 1.35mi |
| 2934 SE Ellendale St Stuart, FL | 2.0 | 2.0 | 900 | $2,000 | $2.22 | 14d | 1 | 1.37mi |
| 917 SE Nassau Ave Stuart, FL | 2.0 | 1.0 | 832 | $3,800 | $4.57 | 23d | 1 | 1.38mi |
| 917 SE Nassau Ave Stuart, FL | 2.0 | 1.0 | 832 | $1,900 | $2.28 | 21d | 1 | 1.38mi |
| 906 SE Tarpon Ave Unit B Stuart, FL | 1.0 | 1.0 | 600 | $1,350 | $2.25 | 23d | 1 | 1.39mi |
| 3129 SE Indian St #3 Stuart, FL | 2.0 | 1.5 | 986 | $2,300 | $2.33 | 23d | 1 | 1.49mi |
HOA detail condo
- Monthly dues
- $557 · $6,684/yr
- Assessments
- None detected in remarks — confirm with the listing agent.
Listing history 12 events
-
2026-06-18days on market $159,900 Active 15 DOM
-
2026-06-17days on market $159,900 Active 14 DOM
-
2026-06-16days on market $159,900 Active 13 DOM
-
2026-06-15days on market $159,900 Active 12 DOM
-
2026-06-14days on market $159,900 Active 10 DOM
-
2026-06-13days on market $159,900 Active 9 DOM
-
2026-06-10days on market $159,900 Active 7 DOM
-
2026-06-09days on market $159,900 Active 6 DOM
-
2026-06-08days on market $159,900 Active 5 DOM
-
2026-06-07days on market $159,900 Active 4 DOM
-
2026-06-03remarks 601-char remark
-
2026-06-03$159,900 Active 1 DOM
ⓘ Source: listings_history table (triggers on properties + properties_extension) + one-shot
backfill from property_details.listing_events for pre-trigger history.
Climate risk First Street
- Flood 6/10 Major FEMA zone X (unshaded) · 74% chance over 30 yrs
- Wildfire 1/10 Low
- Heat 10/10 Extreme 7 d/yr ≥106°F today · 26 d/yr by 30 yrs out
- Wind 10/10 Extreme 99% chance of damaging wind over 30 yrs
- Air quality 2/10 Low 2 unhealthy d/yr today · 2 by 30 yrs out
Nearby sold comps map
Loading sold comps map…
Walkable amenities ~0.75 mi
Loading nearby amenities…
Taxation est. · year 1
- Rental income
- $23,657
- − Mortgage interest
- −$8,957
- − Property taxes
- −$2,398
- − Insurance
- −$800
- − Repairs & maintenance
- −$1,893
- − Management
- −$1,893
- − HOA
- −$6,684
- − Depreciation
- −$4,652
- Taxable loss
- −$3,618
- Est. tax savings @ 24.0%
- +$868
- After-tax cash flow
- $-387/yr
For passive investors: Depreciation is non-cash, so a rental often shows a tax loss while cash-flowing — sheltering income. Rental losses are passive: they offset passive income freely, and up to $25,000/yr can offset ordinary (W-2) income if you actively participate and your MAGI is under $100k (phasing out to $0 by $150k); unused losses carry forward. On sale, claimed depreciation is recaptured at up to 25%, and gains may owe capital-gains tax (a 1031 exchange can defer both). Figures are a year-1 estimate at your 24.0% rate — not tax advice; consult a CPA.
Schools (NCES district)
- District
- Martin
- NCES district ID
- 1201290
- Math proficiency
- 52% ▼ -14.00%
- Reading proficiency
- 53% ▼ -4.00%
- Median HH income
- $52,482
- Composite
- 45.1/100
- National rank
- #2690
- State rank
- #24 of 73 in FL
Livability — Stuart
- Score
- 84/100
- State rank
- #39
- US rank
- #790
Category grades
Schools grade is shown separately in the Schools card above.
Census & demographics
- Census place
- Stuart, FL
- County
- Martin County · 165,223 people
- City population
- 65,812
- Metro
- Port St. Lucie, FL
- Population (ZIP)
- 18,737
- Household income
- $62,533
- Rent vs Own
- Severe rent burden
- 1408.0
Population outlook (Martin County) Hauer SSP2
- Today (2025)
- 172,383 people
- By 2030
- 180,192 · +4.5%
- By 2040
- 194,114 · +12.6%
- By 2050
- 204,992 · +18.9%
- By 2075
- 229,641 · +33.2%
- By 2100
- 232,146 · +34.7%
Race, ethnicity, and origin ACS 2023
- Neighborhood character
- Majority White (65%)
- Race & ethnicity
- White 65% Hispanic / Latino 21% Two or more races 12% Black 11%
- Hispanic origin (detail)
- Mexican 6% Puerto Rican 5% Cuban 1%
- Common ancestry
- Romanian 5% Lithuanian 3% Slovak 2%
- Foreign-born
- 12% · Canada
- Languages at home
- 80% English-only · Spanish 16% Russian/Polish/Slavic 2% Other Indo-European 1%
Political lean MEDSL · Martin
- 2024 margin
- Solid R (+31.1) · D 34.1% · R 65.2%
- 2008→2024 swing
- -17.5pp toward R · 2008: -13.6pp · 2024: -31.1pp
- All cycles
- 2024: R+31.1 2020: R+24.6 2016: R+26.9 2012: R+22.9 2008: R+13.6
Not yet ingested
- Civics
- —
Market trends
- HPI YoY
- ▼ -130.08%
- Current HPI
- 349.7061
- Rent YoY
- ▼ -0.69%
- Metro
- Port St. Lucie, FL
- State GDP YoY
- ▲ 3.28%
- F500 in state
- 36
Industry mix (Fortune 500 HQ in FL)
| Industry | F500 HQs | Revenue |
|---|---|---|
| Industrial Technology | 2 | $29B |
|
||
| Insurance | 2 | $17B |
|
||
| Retail | 1 | $60B |
|
||
| Technology Distribution | 1 | $58B |
|
||
| Homebuilding | 1 | $35B |
|
||
| Technology Manufacturing | 1 | $35B |
|
||
Price history
+301.8% since first listed5 events — show timeline
- 2026-06-03 Listed $159,900 MCRTC
- 2009-06-29 Sold (Public Records) $42,000 Public Records
- 2004-02-20 Sold (Public Records) $72,500 Public Records
- 1989-04-07 Sold (Public Records) $43,000 Public Records
- 1979-11-01 Sold (Public Records) $39,800 Public Records
Property tax history
+3.4%/yrLatest (2025): $258 · +6.4% YoY. Source: county tax records.
Cash-flow waterfall
monthlySold comps — $/sqft
last 12 mo · ≤1 miLoading sold comps…