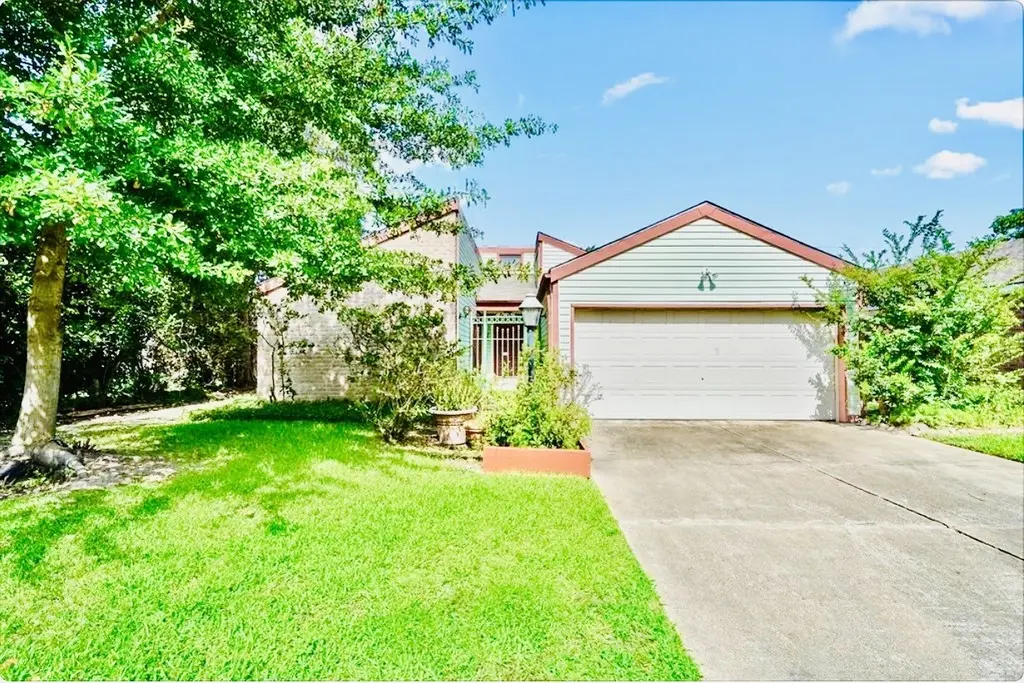
11635 Ridge Run Dr · Houston, TX
Flood risk 3/10 · Minor
- FEMA flood zone
- X (unshaded)
- Chance of flooding over 30 yrs
- 0.2%
- Est. flood insurance / yr
- $507 – $1,088
Fire risk 1/10 · Minimal
- Est. fire insurance / yr
- $1,222 – $2,270
Heat risk 9/10 · Severe
- Hot days now (above 110°F)
- 7 days/yr
- Hot days in 30 yrs
- 23 days/yr
Wind risk 8/10 · Major
- Chance of severe wind over 30 yrs
- 99.0%
Air-quality risk 3/10 · Minor
- Unhealthy air days now
- 2 days/yr
- Unhealthy air days in 30 yrs
- 3 days/yr
Risk factors via First Street. Map © Google.
Why this score? — see what drove the D grade
The composite is a weighted blend of 9 inputs, each scored 0–100. Each bar is that input's sub-score; the figure is the points it added to the 100-point composite (weight × sub-score).
- ARV discount +14.0/15.0
- Cash flow +6.7/30.0
- Appreciation +4.8/10.0
- Schools +4.4/10.0
- Livability +3.7/5.0
- 1% rule +3.2/10.0
- Condition / age +2.5/5.0
- Rent growth +1.7/5.0
- DSCR +0.9/10.0
$210,000
🖨 Deal sheet (PDF) 📄 Offer letter ✓ Due diligence
Listing remarks MLS
Charming 3 bedroom, 2 bath home in a great location! Open floor plan offers a perfect flow for entertaining. Bedrooms are split allowing plenty of privacy. Spacious family room includes vaulted ceiling and fireplace. Island kitchen has plenty of cabinets and counter space. Home has been maintained by current owner who is the second owner and purchased from the builder. The AC unit & furnace are 5 years old. Roof is 12 years old. Easy access to Hwy 290, Hwy 249, Beltway 8, nearby shopping, dining and hospitals. Zoned to Cy Fair schools.
Key facts
- 7,200 sq ft lot
- 2 garage spots
- Built 1979
Property features AI
Finance
- Other: Property area approximately 1,592 living area
- HOA & community: Chaparral association; Association amenities: playground, trash service; Association fee $450 annually
Exterior
- Parking: Attached garage; 2 garage spaces
- Utilities: Public water; Public sewer
- Home design: Residential property; Single-story entry (First floor rooms listed)
- Construction: Built in 1979; Brick and wood siding exterior; Composition roof; Slab foundation
- Exterior features: Cleared lot; Other lot features; Asphalt and concrete road surfaces
Interior
- Kitchen: Dishwasher; Electric cooktop; Electric oven; Electric range; Disposal; Microwave; Oven; Refrigerator; Walk-in pantry
- Bedrooms: Primary bedroom (First floor) — 15x13; Bedroom (First floor) — 11x11; Bedroom (First floor) — 12x11; Bonus room (First floor) — 13x8
- Flooring: Tile flooring; Wood flooring
- Bathrooms: 2 full bathrooms
- Heating & cooling: Central heating (gas); Central air conditioning (electric); HVAC energy-efficient features
- Interior features: Kitchen island; Kitchen/family room combo; Kitchen/dining combo; Tub with shower; Walk-in pantry; One fireplace; 6 total rooms
- Laundry & utility: Washer hookup; Electric dryer hookup; Washer; Dryer
Neighborhood map
What this means for you Summary
Snapshot
- This is a 3-bed/2.0-bath single-family listed at $210k.
Deal economics
- At list price, monthly cash flow is $-340 ($-4k/yr) — negative.
- To cash-flow at today's rent, offer at most $150k (28.6% below list).
- To meet the 1% rule (rent ≥ 1% of price), the offer needs to be $171k (18.5% below list).
- Recommended offer: $150k (28.6% below list) — sets the bar for cash-flow.
- Cap rate 4.4% vs local median 3.2% in Houston — top-decile yield for the area; either an underpriced asset or a hidden risk that comps aren't pricing in. Stress-test before assuming the spread holds.
Location & tenants
- Location reads 74/100 on livability (#184 in TX, #4,771 nationally) — a middle-class / working-renter tenant base. Strengths: amenities A+, cost of living A+, housing A+; Watch: crime F.
- Cypress-Fairbanks ISD (suburban): math 45% / reading 52% proficiency, ranked #161 of 826 in TX (top 20%) — families likely to look elsewhere, expect single-tenant / working-renter base with shorter leases.
- Zoned schools: Francone El (math 19% / reading 29%, grade F, #3,221 of 4,322 statewide, top 75%, 804 students, 89% FRL); Campbell Middle (math 33% / reading 42%, grade F, #736 of 1,662 statewide, top 45%, 1,103 students, 78% FRL); Cypress-Fairbanks J J A E P (12 students, 0% FRL).
- Zoned-school proficiency averages 31% at this address vs 48% district-wide (-18 pts) — the specific schools serving this property underperform the Cypress-Fairbanks ISD average; the district grade overstates school quality for this exact location.
- Market conditions: Rents falling (-3.4%/yr); 155 active listings in the ZIP; 32 comparable units currently listed for rent nearby; rentals leasing fast (median 9d on market — plan ~1-2 weeks tenant-placement turnaround); solid renter incomes; 29,883 units permitted in Harris County in 2024 (8,621 in 5+ unit buildings).
Forward outlook
- In year one you build about $518 of equity ($1k loan paydown + $-934 appreciation (-0.4% local appreciation)).
- Harris County population projected at +47% by 2050 — long-run rental-demand tailwind backs the buy-and-hold thesis.
Negotiation context
- Only 10 days on market — expect competitive offers; lowballing is unlikely to land.
- 6 sale attempts since 2y ago with the ask held roughly flat each time — persistent listings suggest the price (not the market) is what's stuck; bring a comps-based counter.
Risks & watch-outs
- Watch-outs: property tax is 2.7% of price.
- Climate carrying-cost: severe wind risk, 99% chance of damaging wind over 30y; extreme-heat days projected 7→23/yr by 2055 (HVAC capex compounding) — expect insurance premiums to compound above CPI over the hold.
Questions for the listing agent
- What do current leases actually rent for vs. the listed asking? Can we see a recent rent roll and the last 12 months of T-12 income?
- Built in 1979 — when were the roof, HVAC, electrical panel, plumbing, and water heater last replaced?
- Property tax is high relative to price — has the assessment been appealed recently, and will the sale trigger a re-assessment?
- What does the HOA fee cover, when was the last increase, and are there any pending special assessments or reserve-fund shortfalls?
- Is there a deadline driving the sale (1031 exchange, divorce, estate, relocation)? That informs how much negotiation room exists.
- Schools are D-rated, which usually means shorter tenancies and higher turnover. Who's the typical renter profile here, and what's been the actual vacancy rate?
- Crime grade is F in this area — have there been break-ins, vandalism, or insurance claims at this property in the last 3 years? What carrier currently insures it and at what premium?
- The area grade is low — what's the realistic commute time and amenity access for the typical tenant pool here? Any planned neighborhood developments (good or bad) we should know about?
- What's the average days-on-market for RENTAL listings here right now (not sales)? A rising rental-DOM trend means longer vacancies and softer asking-rent achievability than the comps imply.
- What's the recent tenant-quality profile in this submarket — average credit score on applications, eviction rate, late-payment / NSF rate, and stable-employment percentage? A property-management company in the area should have these aggregated.
- How much new for-sale + rental construction is in the pipeline within 1–3 miles? Heavy new supply typically softens prices + rents 12–24 months out; constrained supply supports both.
Investment metrics
- 1% rule
- 0.82% ✗
- Cap rate
- 4.35%
- Cash-on-cash
- -6.93%
- DSCR
- 0.69
- GRM
- 10.2
CMA / ARV
- ARV (median comp)
- $245,488
- List price
- $210,000
- Delta
- -10.38%
- Verdict
- UNDERPRICED
- Comps
- 20 within 1.0 mi
Show comp detail 12 sales within ~0.75 mi
| Address | Dist | Beds/Ba | Sqft | Sold | Price | $/sf | Match |
|---|---|---|---|---|---|---|---|
| 11623 Henley Dr | 0.06mi | 3/2.0 | 1,630 (+2%) | 2mo | $218,000 | $134 | 91 |
| 11527 Deep Meadow Dr | 0.12mi | 3/2.0 | 1,652 (+4%) | 1mo | $229,000 | $139 | 87 |
| 11523 Early Mist Ct | 0.19mi | 3/2.0 | 1,608 (+1%) | 8mo | $255,000 | $159 | 83 |
| 9503 Turtle Log Trl | 0.17mi | 3/2.0 | 1,672 (+5%) | 1mo | $225,000 | $135 | 83 |
| 9518 Marblemount Dr | 0.15mi | 3/2.0 | 1,642 (+3%) | 8mo | $203,500 | $124 | 81 |
| 11819 Stone Bridge Dr | 0.26mi | 4/2.0 (+1) | 1,612 (+1%) | 4mo | $244,999 | $152 | 77 |
| 9511 Tree Branch Dr | 0.14mi | 4/2.0 (+1) | 1,642 (+3%) | 8mo | $224,990 | $137 | 77 |
| 11615 Stone Bridge Dr | 0.23mi | 3/2.0 | 1,692 (+6%) | 5mo | $190,000 | $112 | 74 |
| 11803 Inga Ln | 0.29mi | 3/2.0 | 1,697 (+7%) | 3mo | $227,000 | $134 | 73 |
| 9806 Early Spring Dr | 0.58mi | 3/2.0 | 1,671 (+5%) | 3mo | $274,990 | $165 | 62 |
| 9923 Windriver Dr | 0.33mi | 3/2.0 | 1,770 (+11%) | 6mo | $275,000 | $155 | 61 |
| 11234 Rippling Meadows Dr | 0.61mi | 3/2.0 | 1,828 (+15%) | 8mo | $249,000 | $136 | 40 |
Match score weights: distance 35% · size 25% · config 20% · recency 20%. Top-matched comps best support the ARV.
Projected returns pro-forma
-0.44% appreciation · 0.0% rent growth · sell at horizon
- IRR
- -14.3%
- Equity multiple
- 0.37×
- Total profit
- $-36,975
- Equity at exit
- $56,347
- IRR
- -10.5%
- Equity multiple
- 0.05×
- Total profit
- $-56,009
- Equity at exit
- $64,140
Cash invested: $58,800 (down + closing). Projections, not guarantees.
Landlord ↔ Tenant lean methodology
- Overall (STATE)
- 87 Strongly Landlord-Friendly
- State Texas
- 87 Strongly Landlord-Friendly · R+5
- County
- — inherits STATE
- City
- — inherits STATE
ZIP-level market 77064
- Home prices YoY
- -0.2%
- Rents YoY
- -3.4%
- Active inventory
- 155
- Price-to-rent
- 10.2×
Monthly cashflow live
- Estimated rent
- $1,712 high interval (Pro) →
- Mortgage (P&I)
- −$1,101
- Tax from tax record
- −$465 /mo · $5,584/yr
- Insurance
- −$88
- HOA
- −$38
- Vacancy / Maint / Mgmt
- −$359
- Net cashflow
- $-340
Break-even live
Sensitivity live
| Price | -10% $-221 | -5% $-280 | +0% $-340 | +5% $-399 | +10% $-459 |
|---|---|---|---|---|---|
| Rent | -10% $-475 | -5% $-407 | +0% $-340 | +5% $-272 | +10% $-204 |
| Rate | -1.0pp $-234 | -0.5pp $-286 | base $-340 | +0.5pp $-394 | +1.0pp $-449 |
UW: 25.0% down · 7.5% · 30yr · 1.5% tax · 5.0% vac · 8.0% maint · 8.0% mgmt
Financing live
Cash to close
- Down payment
- $52,500
- Closing costs
- $6,300
- Reserves months
- —
- Total cash needed
- —
Loan-product check · same deal, 3 products live
Conventional
25% down · 7.5% · 30yr
- Down + closing
- —
- Monthly P&I
- —
- Monthly cashflow
- —
- DSCR
- —
- Eligible?
- —
Personal DTI + credit; lowest rate.
DSCR
20% down · 8.5% · 30yr
- Down + closing
- —
- Monthly P&I
- —
- Monthly cashflow
- —
- DSCR
- —
- Eligible?
- —
No personal income docs; deal must DSCR.
Hard money
10% down · 12.0% · 12mo
- Down + closing
- —
- Monthly P&I
- —
- Monthly cashflow
- —
- DSCR
- —
- Eligible?
- —
Short-term bridge; refi at stabilization.
Rent comps 32 comps
| Address | Beds | Baths | Sqft | Rent | $/sqft | DOM | Units | Dist |
|---|---|---|---|---|---|---|---|---|
| 9575 Farm to Market 1960 Rd W Houston, TX | 3.0 | 2.0 | 1234 | $1,310 | $1.06 | 45d | 1 | 0.09mi |
| 11806 Perry Rd Houston, TX | 3.0 | 2.0 | 1760 | $1,985 | $1.13 | 0d | 1 | 0.19mi |
| 9915 Cypress Creek Pkwy Houston, TX | 1.0–3.0 | 1.0–2.5 | 1023 | $1,550 | $1.51 | 1d | 1 | 0.25mi |
| 11907 Cedarcliff Dr Houston, TX | 4.0 | 2.0 | 2087 | $1,806 | $0.87 | 45d | 1 | 0.47mi |
| 11240 Perry Rd Houston, TX | 2.0 | 1.0–2.0 | 1025 | $1,362 | $1.33 | 4d | 5 | 0.74mi |
| 12925 Windfern Rd Houston, TX | 3.0 | 2.0 | 1240 | $1,470 | $1.19 | 45d | 1 | 0.76mi |
| 12919 Windfern Rd Houston, TX | 1.0–3.0 | 1.0–2.0 | 995 | $1,599 | $1.61 | 0d | 9 | 0.81mi |
| 11130 Thunderhaven Dr Houston, TX | 3.0 | 1.5 | 1066 | $1,645 | $1.54 | 23d | 1 | 0.81mi |
| 10770 Barely Ln Houston, TX | 1.0–3.0 | 1.0–2.0 | 917 | $1,770 | $1.93 | 1d | 19 | 0.82mi |
| 12210 Ferncrest Ct Houston, TX | 3.0 | 2.0 | 1793 | $2,200 | $1.23 | 45d | 1 | 0.84mi |
| 12534 Blinnwood Ln Houston, TX | 3.0 | 2.0 | 1812 | $2,060 | $1.14 | 0d | 1 | 0.95mi |
| 10015 Rippling Fields Dr Houston, TX | 4.0 | 2.5 | 2160 | $2,100 | $0.97 | 14d | 1 | 0.97mi |
| 10210 Rippling Fields Dr Houston, TX | 3.0 | 2.0 | 1580 | $1,765 | $1.12 | 9d | 1 | 1.00mi |
| 9247 Autumnsong Dr Houston, TX | 4.0 | 2.0 | 1328 | $1,750 | $1.32 | 12d | 1 | 1.03mi |
| 12619 Aubreywood Ln Houston, TX | 4.0 | 2.0 | 2187 | $2,205 | $1.01 | 7d | 1 | 1.05mi |
| 11925 Jones Rd Houston, TX | 2.0 | 2.0 | 1126 | $1,735 | $1.54 | 45d | 1 | 1.19mi |
| 11925 Jones Rd Unit 11948 Houston, TX | 2.0 | 2.0 | 1126 | $1,699 | $1.51 | 12d | 1 | 1.20mi |
| 11925 Jones Rd Unit 2112 Houston, TX | 2.0 | 2.0 | 1126 | $1,659 | $1.47 | 0d | 1 | 1.20mi |
| 11925 Jones Rd Unit 422 Houston, TX | 2.0 | 2.0 | 1126 | $1,675 | $1.49 | 9d | 1 | 1.20mi |
| 11925 Jones Rd Unit 2174 Houston, TX | 2.0 | 2.0 | 1126 | $1,700 | $1.51 | 0d | 1 | 1.20mi |
| 11925 Jones Rd Unit 424 Houston, TX | 2.0 | 2.0 | 1126 | $1,675 | $1.49 | 7d | 1 | 1.20mi |
| 11925 Jones Rd Unit 11962 Houston, TX | 2.0 | 2.0 | 1126 | $1,615 | $1.43 | 45d | 1 | 1.20mi |
| 11920 Jansells Crossing Dr Houston, TX | 2.0 | 2.0 | 1126 | $1,449 | $1.29 | 26d | 1 | 1.22mi |
| 10743 Staghill Dr Houston, TX | 4.0 | 2.0 | 1883 | $1,995 | $1.06 | 7d | 1 | 1.25mi |
| 12850 Perry Rd Houston, TX | 1.0–3.0 | 1.0–2.0 | 1141 | $2,149 | $1.88 | 1d | 37 | 1.26mi |
| 12856 Perry Rd Houston, TX | 3.0 | 2.0 | 1211 | $1,780 | $1.47 | 26d | 1 | 1.29mi |
| 12336 N Gessner Rd Houston, TX | 2.0 | 2.0 | 1065 | $1,627 | $1.53 | 45d | 1 | 1.34mi |
| 13030 Perry Rd Houston, TX | 1.0–3.0 | 1.0–2.0 | 935 | $1,825 | $1.95 | 3d | 32 | 1.39mi |
| 12330 N Gessner Rd Houston, TX | 1.0–3.0 | 1.0–2.0 | 1030 | $2,178 | $2.11 | 4d | 27 | 1.41mi |
| 10802 Legacy Park Dr Unit 10835 Houston, TX | 3.0 | 2.0 | 1395 | $1,703 | $1.22 | 12d | 1 | 1.46mi |
| 10027 Encino Cove Ct Houston, TX | 3.0 | 2.0 | 1822 | $1,900 | $1.04 | 14d | 1 | 1.46mi |
| 10802 Legacy Park Dr Unit 3148 Houston, TX | 3.0 | 2.0 | 1395 | $1,663 | $1.19 | 0d | 1 | 1.47mi |
HOA detail
- Monthly dues
- $38 · $456/yr
Listing history 23 events
-
2026-06-21days on market $210,000 Active 10 DOM
-
2026-06-18days on market $210,000 Active 7 DOM
-
2026-06-17remarks 349-char remark
-
2026-06-17pricestatus $210,000 Active 6 DOM
-
2026-06-17days on market $219,000 Pending 6 DOM
-
2026-06-16days on market $219,000 Pending 5 DOM
-
2026-06-16status $219,000 Pending 4 DOM
-
2026-06-15days on market $219,000 Active 4 DOM
-
2026-06-13days on market $219,000 Active 2 DOM
-
2026-06-13pricedays on market $219,000 Active 1 DOM
-
2026-04-17price $220,000 350-char remark
-
2026-04-13price $222,000 350-char remark
-
2026-04-04$225,000 Active 350-char remark
-
2024-09-11soldstatus
-
2024-08-30soldstatus Sold 547-char remark
Show marketing remark (547 chars)
Charming 3 bedroom, 2 bath home in a great location! Open floor plan offers a perfect flow for entertaining. Bedrooms are split allowing plenty of privacy. Spacious family room includes vaulted ceiling and fireplace. Island kitchen has plenty of cabinets and counter space. Home has been maintained by current owner who is the second owner and purchased from the builder. The AC unit & furnace are 5 years old. Roof is 12 years old. Easy access to Hwy 290, Hwy 249, Beltway 8, nearby shopping, dining and hospitals. Zoned to Cy Fair schools.
-
2024-08-13historical $1,750
-
2024-08-12status Pending 547-char remark
Show marketing remark (547 chars)
Charming 3 bedroom, 2 bath home in a great location! Open floor plan offers a perfect flow for entertaining. Bedrooms are split allowing plenty of privacy. Spacious family room includes vaulted ceiling and fireplace. Island kitchen has plenty of cabinets and counter space. Home has been maintained by current owner who is the second owner and purchased from the builder. The AC unit & furnace are 5 years old. Roof is 12 years old. Easy access to Hwy 290, Hwy 249, Beltway 8, nearby shopping, dining and hospitals. Zoned to Cy Fair schools.
-
2024-07-31$1,750
-
2024-07-07$224,900 Active 547-char remark
Show marketing remark (547 chars)
Charming 3 bedroom, 2 bath home in a great location! Open floor plan offers a perfect flow for entertaining. Bedrooms are split allowing plenty of privacy. Spacious family room includes vaulted ceiling and fireplace. Island kitchen has plenty of cabinets and counter space. Home has been maintained by current owner who is the second owner and purchased from the builder. The AC unit & furnace are 5 years old. Roof is 12 years old. Easy access to Hwy 290, Hwy 249, Beltway 8, nearby shopping, dining and hospitals. Zoned to Cy Fair schools.
-
2024-06-24historical
-
2024-04-17price $229,900
-
2024-03-12$239,900 Active
-
1988-01-02soldstatus
ⓘ Source: listings_history table (triggers on properties + properties_extension) + one-shot
backfill from property_details.listing_events for pre-trigger history.
Tax reassessment forecast TX · Resets to sale price
- Current annual tax
- $5,584 · $465/mo
- Projected year-2 tax
- $5,584 · $465/mo
- Expected delta
- $0/yr ($0/mo · 0.0%)
ⓘ Screening estimate from a state-policy table — verify with the county assessor before closing.
Climate risk First Street
- Flood 3/10 Moderate FEMA zone X (unshaded) · 20% chance over 30 yrs
- Wildfire 1/10 Low
- Heat 9/10 Extreme 7 d/yr ≥110°F today · 23 d/yr by 30 yrs out
- Wind 8/10 Severe 99% chance of damaging wind over 30 yrs
- Air quality 3/10 Moderate 2 unhealthy d/yr today · 3 by 30 yrs out
Nearby sold comps map
Loading sold comps map…
Walkable amenities ~0.75 mi
Loading nearby amenities…
Taxation est. · year 1
- Rental income
- $20,542
- − Mortgage interest
- −$11,763
- − Property taxes
- −$5,584
- − Insurance
- −$1,050
- − Repairs & maintenance
- −$1,643
- − Management
- −$1,643
- − HOA
- −$456
- − Depreciation
- −$6,109
- Taxable loss
- −$7,707
- Est. tax savings @ 24.0%
- +$1,850
- After-tax cash flow
- $-2,227/yr
For passive investors: Depreciation is non-cash, so a rental often shows a tax loss while cash-flowing — sheltering income. Rental losses are passive: they offset passive income freely, and up to $25,000/yr can offset ordinary (W-2) income if you actively participate and your MAGI is under $100k (phasing out to $0 by $150k); unused losses carry forward. On sale, claimed depreciation is recaptured at up to 25%, and gains may owe capital-gains tax (a 1031 exchange can defer both). Figures are a year-1 estimate at your 24.0% rate — not tax advice; consult a CPA.
Schools (NCES district)
- District
- Cypress-Fairbanks ISD
- NCES district ID
- 4816110
- Math proficiency
- 45% ▼ -12.00%
- Reading proficiency
- 52% ▼ -2.00%
- Median HH income
- $72,025
- Composite
- 43.63/100
- National rank
- #2968
- State rank
- #161 of 826 in TX
Livability — Houston
- Score
- 74/100
- State rank
- #184
- US rank
- #4771
Category grades
Schools grade is shown separately in the Schools card above.
Census & demographics
- County
- Harris County · 4,702,590 people
- City population
- 3,226,434
- Metro
- Houston-The Woodlands-Sugar Land, TX
- Population (ZIP)
- 49,591
- Household income
- $81,658
- Rent vs Own
- Severe rent burden
- 1589.0
Population outlook (Harris County) Hauer SSP2
- Today (2025)
- 5,571,493 people
- By 2030
- 6,089,821 · +9.3%
- By 2040
- 7,142,806 · +28.2%
- By 2050
- 8,185,864 · +46.9%
- By 2075
- 10,574,329 · +89.8%
- By 2100
- 12,109,958 · +117.4%
Race, ethnicity, and origin ACS 2023
- Neighborhood character
- Highly diverse neighborhood (Simpson 0.71)
- Race & ethnicity
- Hispanic / Latino 45% White 22% Two or more races 19% Asian 15% Black 15%
- Hispanic origin (detail)
- Mexican 30%
- Common ancestry
- Romanian 2% Lithuanian 1% Italian 1%
- Foreign-born
- 29% · Canada, Vietnam, Jamaica
- Languages at home
- 51% English-only · Spanish 35% Vietnamese 9% Other Indo-European 2%
Political lean MEDSL · Harris
- 2024 margin
- Lean D (+5.5) · D 52.0% · R 46.4% · Other 1.6%
- 2008→2024 swing
- +3.9pp toward D · 2008: 1.6pp · 2024: 5.5pp
- All cycles
- 2024: D+5.5 2020: D+13.3 2016: D+12.4 2012: D+0.1 2008: D+1.6
Not yet ingested
- Civics
- —
Market trends
- HPI YoY
- ▼ -0.44%
- Current HPI
- 238.9456
- Rent YoY
- ▼ -3.36%
- Metro
- Houston-The Woodlands-Sugar Land, TX
- State GDP YoY
- ▲ 3.95%
- F500 in state
- 110
Industry mix (Fortune 500 HQ in TX)
| Industry | F500 HQs | Revenue |
|---|---|---|
| Energy | 16 | $1,198B |
|
||
| Technology | 5 | $198B |
|
||
| Engineering / Construction | 4 | $72B |
|
||
| Energy Services | 3 | $60B |
|
||
| Utilities | 3 | $41B |
|
||
| Healthcare | 2 | $330B |
|
||
Price history
-12.5% since first listed18 events — show timeline
- 2026-06-17 Relisted — HARMLS
- 2026-06-17 Price Changed $210,000 HARMLS
- 2026-06-15 Pending — HARMLS
- 2026-06-11 Listed $219,000 HARMLS
- 2026-05-29 Listing Removed — HARMLS
- 2026-04-17 Price Changed $220,000 HARMLS
- 2026-04-13 Price Changed $222,000 HARMLS
- 2026-04-04 Listed $225,000 HARMLS
- 2024-09-11 Sold (Public Records) — Public Records
- 2024-08-30 Sold (MLS) — HARMLS
- 2024-08-13 Rental Removed $1,750 HARMLS
- 2024-08-12 Pending — HARMLS
- 2024-07-31 Listed for Rent $1,750 HARMLS
- 2024-07-07 Listed $224,900 HARMLS
- 2024-06-24 Listing Removed — HARMLS
- 2024-04-17 Price Changed $229,900 HARMLS
- 2024-03-12 Listed $239,900 HARMLS
- 1988-01-02 Sold (Public Records) — Public Records
Property tax history
+4.4%/yrLatest (2025): $5,584 · +8.7% YoY. Source: county tax records.
Cash-flow waterfall
monthlySold comps — $/sqft
last 12 mo · ≤1 miLoading sold comps…