 Multi-family
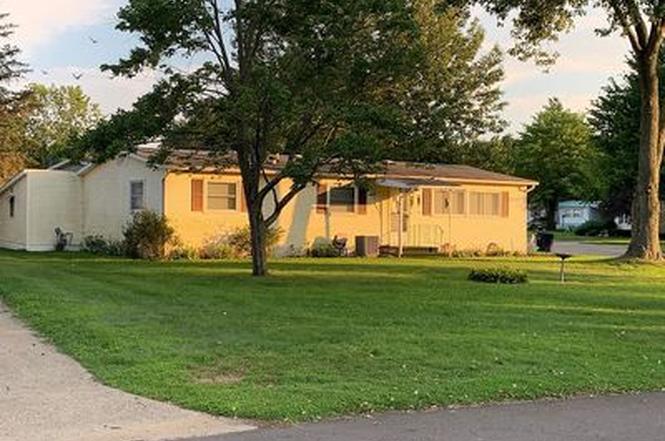
10450 6 Mile Rd · Battle Creek, MI
Flood risk 1/10 · Minimal
- FEMA flood zone
- X (unshaded)
- Chance of flooding over 30 yrs
- 0.0%
- Est. flood insurance / yr
- $507 – $1,088
Fire risk 2/10 · Minimal
- Est. fire insurance / yr
- $784 – $1,456
Heat risk 3/10 · Minor
- Hot days now (above 99°F)
- 7 days/yr
- Hot days in 30 yrs
- 16 days/yr
Wind risk 2/10 · Minimal
- Chance of severe wind over 30 yrs
- —
Air-quality risk 2/10 · Minimal
- Unhealthy air days now
- 1 days/yr
- Unhealthy air days in 30 yrs
- 2 days/yr
Risk factors via First Street. Map © Google.
Why this score? — see what drove the B- grade
The composite is a weighted blend of 9 inputs, each scored 0–100. Each bar is that input's sub-score; the figure is the points it added to the 100-point composite (weight × sub-score).
- Cash flow +30.0/30.0
- 1% rule +10.0/10.0
- DSCR +10.0/10.0
- ARV discount +7.5/15.0
- Livability +3.7/5.0
- Schools +2.9/10.0
- Rent growth +2.5/5.0
- Condition / age +2.5/5.0
- Appreciation +0.0/10.0
$55,000
🖨 Deal sheet 📄 Offer letter ✓ Due diligence
Multi-family units
County records classify this as Multi-Family (5+ Unit). Listing-text estimate: 1 unit. estimate disagrees with records
5+ unit building — per-unit beds/baths from public records are typically unavailable; the breakdown below (if shown) is an estimate from the listing text.
Listing remarks
Very large living room, built in office in Master bedroom, 2 full baths. So many closets! Coat closet in Living room, 2 hall closets, bathroom closet, pantry closet and a closet in each bedroom! Linoleum flooring throughout the whole house! No soft spots! New 3/4 & acirc; & euro; � sub floor on top of old subs floor and 1/4 & acirc; & euro; & oelig; birch wood on top of sub floor then new linoleum! Will post more photos soon! View of pond is beautiful year round!!
Key facts
- View of pond
- Built in office
- Coat closet
Tags
Neighborhood map
What this means for you Summary
Snapshot
- This is a 2-bed/2.0-bath multifamily listed at $55k.
Deal economics
- At list price, monthly cash flow is $663 ($8k/yr) — positive.
- The deal already cash-flows at list — no discount required.
- Meets the 1% rule at list price ($1k rent vs $55k).
- Cap rate 20.8% vs local median 5.2% in Battle Creek — top-decile yield for the area; either an underpriced asset or a hidden risk that comps aren't pricing in. Stress-test before assuming the spread holds.
Location & tenants
- Location reads 73/100 on livability (#198 in MI) — a middle-class / working-renter tenant base. Strengths: cost of living A+, housing A+, health & safety A+; Watch: schools C-, amenities C-, crime F.
- Harper Creek Community Schools (rural): math 25% / reading 40% proficiency, ranked #313 of 540 in MI (top 58%) — families likely to look elsewhere, expect single-tenant / working-renter base with shorter leases.
- Market conditions: 135 active listings in the ZIP; 2 comparable units currently listed for rent nearby; 132 units permitted in Calhoun County in 2024 (0 in 5+ unit buildings).
Forward outlook
- Local home prices are declining (-3.0%/yr); year-one equity from $380 of loan paydown is wiped out by about $2k of value loss. Plan a longer hold.
- Calhoun County population projected at -16% by 2050 — secular population decline; favor cash flow + early exit over multi-decade hold.
- At projected returns (-3.0% appreciation + 3.0% rent growth), your $15k cash investment doubles in ~3 years — after that, you're playing with house money.
Negotiation context
- Only 4 days on market — expect competitive offers; lowballing is unlikely to land.
- 2 sale attempts since 25y ago with the ask held roughly flat each time — persistent listings suggest the price (not the market) is what's stuck; bring a comps-based counter.
Questions for the listing agent
- Is there a deadline driving the sale (1031 exchange, divorce, estate, relocation)? That informs how much negotiation room exists.
- Crime grade is F in this area — have there been break-ins, vandalism, or insurance claims at this property in the last 3 years? What carrier currently insures it and at what premium?
- What's the average days-on-market for RENTAL listings here right now (not sales)? A rising rental-DOM trend means longer vacancies and softer asking-rent achievability than the comps imply.
- What's the recent tenant-quality profile in this submarket — average credit score on applications, eviction rate, late-payment / NSF rate, and stable-employment percentage? A property-management company in the area should have these aggregated.
- How much new apartment / multifamily construction is in the pipeline within 1–3 miles? Heavy new supply (>2% of stock underway) typically softens rents 12–24 months out; light construction supports rent growth.
Investment metrics
- 1% rule
- 2.40% ✓
- Cap rate
- 20.77%
- Cash-on-cash
- 51.69%
- DSCR
- 3.30
- GRM
- 3.5
CMA / ARV
No comps found within radius.
Projected returns pro-forma
-3.0% appreciation · 3.0% rent growth · sell at horizon
- IRR
- 49.6%
- Equity multiple
- 3.17×
- Total profit
- $33,354
- Equity at exit
- $8,201
- IRR
- 55.1%
- Equity multiple
- 6.42×
- Total profit
- $83,524
- Equity at exit
- $4,755
Cash invested: $15,400 (down + closing). Projections, not guarantees.
Landlord ↔ Tenant lean methodology
- Overall (STATE)
- 62 Landlord-Friendly
- State Michigan
- 62 Landlord-Friendly · EVEN
- County
- — inherits STATE
- City
- — inherits STATE
ZIP-level market 49014
- Home prices YoY
- -28.7%
- Active inventory
- 135
- Price-to-rent
- 3.5×
Monthly cashflow live
- Estimated rent
- $1,321 medium interval (Pro) →
- Mortgage (P&I)
- −$288
- Tax est. 1.5%
- −$69 /mo · $825/yr
- Insurance
- −$23
- HOA
- −$0
- Vacancy / Maint / Mgmt
- −$277
- Net cashflow
- $663
Break-even live
UW: 25.0% down · 7.5% · 30yr · 1.5% tax · 5.0% vac · 8.0% maint · 8.0% mgmt
Financing live
Cash to close
- Down payment
- $13,750
- Closing costs
- $1,650
- Reserves months
- —
- Total cash needed
- —
Loan-product check · same deal, 3 products live
Conventional
25% down · 7.5% · 30yr
- Down + closing
- —
- Monthly P&I
- —
- Monthly cashflow
- —
- DSCR
- —
- Eligible?
- —
Personal DTI + credit; lowest rate.
DSCR
20% down · 8.5% · 30yr
- Down + closing
- —
- Monthly P&I
- —
- Monthly cashflow
- —
- DSCR
- —
- Eligible?
- —
No personal income docs; deal must DSCR.
Hard money
10% down · 12.0% · 12mo
- Down + closing
- —
- Monthly P&I
- —
- Monthly cashflow
- —
- DSCR
- —
- Eligible?
- —
Short-term bridge; refi at stabilization.
Rent comps 2 comps
| Address | Beds | Baths | Sqft | Rent | $/sqft | DOM | Units | Dist |
|---|---|---|---|---|---|---|---|---|
| 10450-10456 Mile Rd Battle Creek, MI | 3.0 | 2.0 | 1200 | $1,499 | $1.25 | 13d | 1 | 0.11mi |
| 4650 Capital Ave SW Apt 6 Battle Creek, MI | 2.0 | 1.0 | 1000 | $920 | $0.92 | 13d | 1 | 1.41mi |
Listing history 5 events
-
2026-06-19days on market $55,000 Active 4 DOM
-
2026-06-18days on market $55,000 Active 3 DOM
-
2026-06-17days on market $55,000 Active 2 DOM
-
2026-06-16remarks 475-char remark
-
2026-06-16$55,000 Active 1 DOM
ⓘ Source: listings_history table (triggers on properties + properties_extension) + one-shot
backfill from property_details.listing_events for pre-trigger history.
Climate risk First Street
- Flood 1/10 Low FEMA zone X (unshaded) · 0% chance over 30 yrs
- Wildfire 2/10 Low
- Heat 3/10 Moderate 7 d/yr ≥99°F today · 16 d/yr by 30 yrs out
- Wind 2/10 Low
- Air quality 2/10 Low 1 unhealthy d/yr today · 2 by 30 yrs out
Nearby sold comps map
Loading sold comps map…
Walkable amenities ~0.75 mi
Loading nearby amenities…
Taxation est. · year 1
- Rental income
- $15,849
- − Mortgage interest
- −$3,081
- − Property taxes
- −$825
- − Insurance
- −$275
- − Repairs & maintenance
- −$1,268
- − Management
- −$1,268
- − Depreciation
- −$1,600
- Taxable income
- $7,532
- Est. tax owed @ 24.0%
- −$1,808
- After-tax cash flow
- $6,152/yr
For passive investors: Depreciation is non-cash, so a rental often shows a tax loss while cash-flowing — sheltering income. Rental losses are passive: they offset passive income freely, and up to $25,000/yr can offset ordinary (W-2) income if you actively participate and your MAGI is under $100k (phasing out to $0 by $150k); unused losses carry forward. On sale, claimed depreciation is recaptured at up to 25%, and gains may owe capital-gains tax (a 1031 exchange can defer both). Figures are a year-1 estimate at your 24.0% rate — not tax advice; consult a CPA.
Schools (NCES district)
- District
- Harper Creek Community Schools
- NCES district ID
- 2617730
- Math proficiency
- 25% ▼ -9.00%
- Reading proficiency
- 40% ▼ -5.00%
- Median HH income
- $53,979
- Composite
- 28.6/100
- National rank
- #6713
- State rank
- #313 of 540 in MI
Livability — Battle Creek
- Score
- 73/100
- State rank
- #198
- US rank
- #5031
Category grades
Schools grade is shown separately in the Schools card above.
Census & demographics
- County
- Calhoun County · 91,590 people
- City population
- 91,590
- Metro
- Battle Creek, MI
- Population (ZIP)
- 21,980
- Household income
- $69,009
- Rent vs Own
- Severe rent burden
- 416.0
Population outlook (Calhoun County) Hauer SSP2
- Today (2025)
- 130,157 people
- By 2030
- 126,691 · -2.7%
- By 2040
- 118,517 · -8.9%
- By 2050
- 109,855 · -15.6%
- By 2075
- 90,486 · -30.5%
- By 2100
- 70,766 · -45.6%
Race, ethnicity, and origin ACS 2023
- Neighborhood character
- Predominantly White (78%)
- Race & ethnicity
- White 78% Black 9% Two or more races 8% Hispanic / Latino 6% Asian 1%
- Hispanic origin (detail)
- Mexican 5%
- Common ancestry
- Romanian 4% Iranian 3% Slovak 2%
- Foreign-born
- 4% · Canada
- Languages at home
- 92% English-only · Spanish 4% Russian/Polish/Slavic 1%
Political lean MEDSL · Calhoun
- 2024 margin
- R (+14.1) · D 42.3% · R 56.4% · Other 1.3%
- 2008→2024 swing
- -23.4pp toward R · 2008: 9.4pp · 2024: -14.1pp
- All cycles
- 2024: R+14.1 2020: R+11.1 2016: R+12.5 2012: D+1.6 2008: D+9.4
Not yet ingested
- Civics
- —
Market trends
- HPI YoY
- ▼ -97.29%
- Current HPI
- 241.3422
- Rent YoY
- —
- Metro
- Battle Creek, MI
- State GDP YoY
- ▲ 1.37%
- F500 in state
- 28
Industry mix (Fortune 500 HQ in MI)
| Industry | F500 HQs | Revenue |
|---|---|---|
| Automotive Parts | 3 | $48B |
|
||
| Automotive | 2 | $372B |
|
||
| Chemicals | 1 | $45B |
|
||
| Automotive Retail | 1 | $29B |
|
||
| Healthcare / Medical Devices | 1 | $23B |
|
||
| Automotive Technology | 1 | $20B |
|
||
Price history
-15.4% since first listed3 events — show timeline
- 2026-06-16 Listed $55,000 FSBO.com
- 2001-08-03 Listing Removed — REALCOMP
- 2001-08-02 Listed $65,000 REALCOMP
Cash-flow waterfall
monthlySold comps — $/sqft
last 12 mo · ≤1 miLoading sold comps…