 Duplex
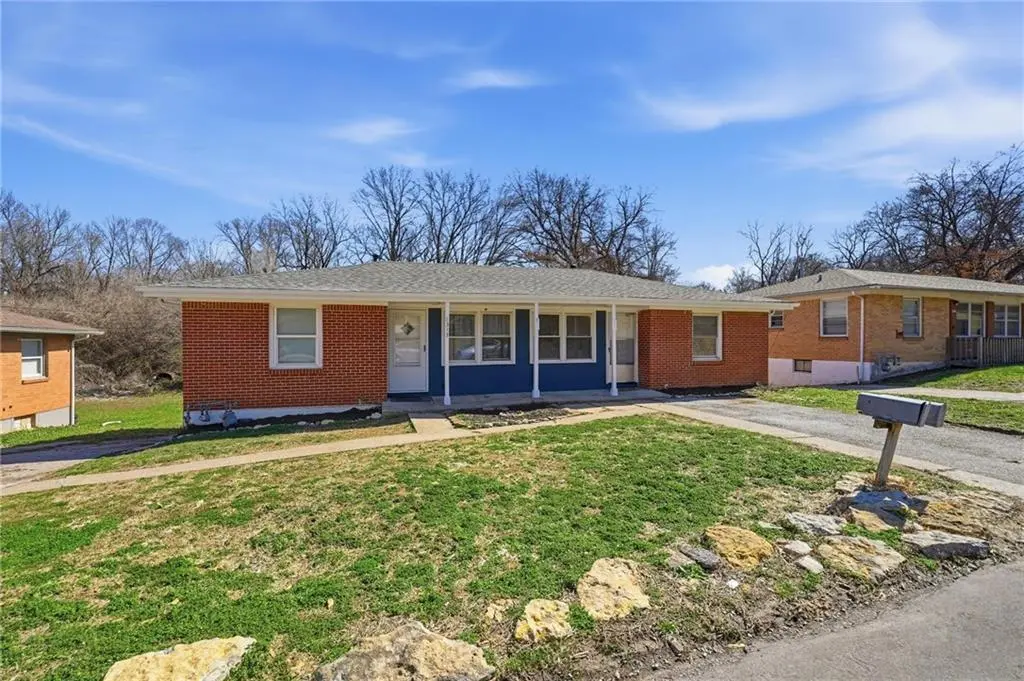
1313-1315 S Franklin Ave · Independence, MO
Flood risk 9/10 · Severe
- FEMA flood zone
- X (unshaded)
- Chance of flooding over 30 yrs
- 0.99%
- Est. flood insurance / yr
- $473 – $860
Fire risk 1/10 · Minimal
- Est. fire insurance / yr
- $1,054 – $1,958
Heat risk 4/10 · Minor
- Hot days now (above 106°F)
- 7 days/yr
- Hot days in 30 yrs
- 17 days/yr
Wind risk 2/10 · Minimal
- Chance of severe wind over 30 yrs
- —
Air-quality risk 3/10 · Minor
- Unhealthy air days now
- 2 days/yr
- Unhealthy air days in 30 yrs
- 3 days/yr
Risk factors via First Street. Map © Google.
Why this score? — see what drove the B- grade
The composite is a weighted blend of 9 inputs, each scored 0–100. Each bar is that input's sub-score; the figure is the points it added to the 100-point composite (weight × sub-score).
- Cash flow +24.0/30.0
- ARV discount +14.9/15.0
- DSCR +7.7/10.0
- 1% rule +5.6/10.0
- Livability +4.1/5.0
- Rent growth +3.9/5.0
- Schools +2.7/10.0
- Condition / age +2.5/5.0
- Appreciation +0.0/10.0
$175,000
🖨 Deal sheet (PDF) 📄 Offer letter ✓ Due diligence
Multi-family units
County records classify this as Multi-Family (2-4 Unit). Listing-text estimate: 2 units. confirmed
Listing remarks MLS
This turn-key duplex is a premier investment opportunity in a high-demand rental district. The property offers exceptional peace of mind with a one-year-old roof, ensuring low maintenance costs and long-term structural integrity for the new owner. The building provides immediate financial stability, as one unit is currently occupied by reliable, long-term tenants with a lease secured through next year. This guaranteed income stream allows for a seamless transition while you capitalize on the building's prime location and consistent historical occupancy. The second unit is move-in ready and features fresh designer paint, modern durable flooring, and plush new carpeting throughout. Whether you choose to house-hack and live for a fraction of the cost or rent it out at top-market rates, this refreshed space is designed to attract high-quality applicants in a high-growth area.
Key facts
- 8,227 sq ft lot
- Built 1959
- Listed 89 days
Neighborhood map
What this means for you Summary
Snapshot
- This is a 2 × 2-bed/1.0-bath units multifamily listed at $175k.
Deal economics
- At list price, monthly cash flow is $287 ($3k/yr) — positive. Per door: $143/mo.
- The deal already cash-flows at list — no discount required.
- Meets the 1% rule at list price ($2k rent vs $175k).
- Recommended offer: $164k (6.0% below list) — sets the bar for market timing.
- Cap rate 8.6% vs local median 5.0% in Independence — top-decile yield for the area; either an underpriced asset or a hidden risk that comps aren't pricing in. Stress-test before assuming the spread holds.
Location & tenants
- Location reads 82/100 on livability (#10 in MO, #1,296 nationally) — a professional / high-income tenant draw. Strengths: amenities A+, commute A+, cost of living A+; Watch: employment D+, crime F.
- Independence 30 (suburban): math 26% / reading 38% proficiency, ranked #252 of 324 in MO (top 78%) — families likely to look elsewhere, expect single-tenant / working-renter base with shorter leases.
- Zoned schools: Korte Elem. (math 17% / reading 32%, grade F, #879 of 1,115 statewide, top 81%, 447 students, 85% FRL); Clifford H. Nowlin Middle (math 13% / reading 29%, grade F, #342 of 391 statewide, top 88%, 875 students, 80% FRL); Van Horn High (math 13% / reading 27%, grade F, #472 of 521 statewide, top 91%, 1,047 students, 72% FRL) — zoned schools average 79% FRL vs 58% district-wide (20 pts higher); higher-poverty schools than district average — tighter screening recommended.
- Market conditions: Rents rising fast (+5.4%/yr); 135 active listings in the ZIP; 1 comparable units currently listed for rent nearby; 4,002 units permitted in Jackson County in 2024 (2,271 in 5+ unit buildings).
- This rent runs 38% of the median local income ($59k/yr) — at the standard rent-burdened threshold; future hikes will face affordability resistance.
Forward outlook
- Local home prices are declining (-3.0%/yr); year-one equity from $1k of loan paydown is wiped out by about $5k of value loss. Plan a longer hold.
- Jackson County population projected at +4% by 2050 — modest demand growth; plan on rents tracking national, not racing it.
- At projected returns (-3.0% appreciation + 5.4% rent growth), your $49k cash investment doubles in ~10 years — after that, you're playing with house money.
Negotiation context
- It's been on market 89 days — a 6% lower offer ($164k) is reasonable based on typical stale-listing flexibility.
- 9 sale attempts since 29y ago; this cycle's ask has dropped $25k (12%) from the opening price — seller is motivated, your offer sets the floor, not the list.
Risks & watch-outs
- Watch-outs: flood insurance adds $56/mo; built in 1959 — expect roof / HVAC / electrical / plumbing capex.
- Climate carrying-cost: severe flood risk — expect insurance premiums to compound above CPI over the hold.
Questions for the listing agent
- It's been on market 89 days. Have you received any prior offers? Is the seller open to a 6% concession, seller financing, or rate buy-down credit?
- Can we see the unit-by-unit rent roll, current vacancy, and any below-market leases? What's the average tenancy length?
- What capital expenditures (roof, boiler, parking lot, exteriors) have been made in the last 5 years, and what's planned in the next 2?
- Built in 1959 — when were the roof, HVAC, electrical panel, plumbing, and water heater last replaced?
- What's the actual annual flood-insurance premium (NFIP or private), and is the property in a SFHA with mandatory coverage?
- Why hasn't it sold? Are there any deal-killer items the seller is aware of (foundation, flood, title, zoning, code violations)?
- Is there a deadline driving the sale (1031 exchange, divorce, estate, relocation)? That informs how much negotiation room exists.
- Crime grade is F in this area — have there been break-ins, vandalism, or insurance claims at this property in the last 3 years? What carrier currently insures it and at what premium?
- What's the average days-on-market for RENTAL listings here right now (not sales)? A rising rental-DOM trend means longer vacancies and softer asking-rent achievability than the comps imply.
- What's the recent tenant-quality profile in this submarket — average credit score on applications, eviction rate, late-payment / NSF rate, and stable-employment percentage? A property-management company in the area should have these aggregated.
- How much new apartment / multifamily construction is in the pipeline within 1–3 miles? Heavy new supply (>2% of stock underway) typically softens rents 12–24 months out; light construction supports rent growth.
Investment metrics
- 1% rule
- 1.06% ✓
- Cap rate
- 8.64%
- Cash-on-cash
- 8.38%
- DSCR
- 1.37
- GRM
- 7.9
CMA / ARV
- ARV (median comp)
- $209,641
- List price
- $175,000
- Delta
- -16.52%
- Verdict
- UNDERPRICED
- Comps
- 20 within 1.0 mi
Projected returns pro-forma
-3.0% appreciation · 5.43% rent growth · sell at horizon
- IRR
- -2.9%
- Equity multiple
- 0.89×
- Total profit
- $-5,459
- Equity at exit
- $26,093
- IRR
- 9.3%
- Equity multiple
- 1.79×
- Total profit
- $38,766
- Equity at exit
- $15,131
Cash invested: $49,000 (down + closing). Projections, not guarantees.
Landlord ↔ Tenant lean methodology
- Overall (STATE)
- 81 Strongly Landlord-Friendly
- State Missouri
- 81 Strongly Landlord-Friendly · R+10
- County
- — inherits STATE
- City
- — inherits STATE
ZIP-level market 64052
- Home prices YoY
- -34.6%
- Rents YoY
- 5.4%
- Active inventory
- 135
- Price-to-rent
- 15.8×
Monthly cashflow live
- Estimated rent
- $1,850 high interval (Pro) →
- Mortgage (P&I)
- −$918
- Tax from tax record
- −$129 /mo · $1,544/yr
- Insurance
- −$73
- Flood insurance flood zone
- −$56 /mo · $666/yr
- HOA
- −$0
- Vacancy / Maint / Mgmt
- −$388
- Net cashflow
- $287
Break-even live
Sensitivity live
| Price | -10% $386 | -5% $336 | +0% $287 | +5% $237 | +10% $188 |
|---|---|---|---|---|---|
| Rent | -10% $141 | -5% $214 | +0% $287 | +5% $360 | +10% $433 |
| Rate | -1.0pp $375 | -0.5pp $331 | base $287 | +0.5pp $241 | +1.0pp $195 |
2-unit breakdown (identical units grouped — click to expand)
| Units | Beds | Baths | Est. rent |
|---|---|---|---|
| 2× units | 2 | 1 | $1,850 |
| #1 | 2 | 1 | $925 |
| #2 | 2 | 1 | $925 |
| Total (2 units) | $1,850 | ||
UW: 25.0% down · 7.5% · 30yr · 1.5% tax · 5.0% vac · 8.0% maint · 8.0% mgmt
Financing live
Cash to close
- Down payment
- $43,750
- Closing costs
- $5,250
- Reserves months
- —
- Total cash needed
- —
Loan-product check · same deal, 3 products live
Conventional
25% down · 7.5% · 30yr
- Down + closing
- —
- Monthly P&I
- —
- Monthly cashflow
- —
- DSCR
- —
- Eligible?
- —
Personal DTI + credit; lowest rate.
DSCR
20% down · 8.5% · 30yr
- Down + closing
- —
- Monthly P&I
- —
- Monthly cashflow
- —
- DSCR
- —
- Eligible?
- —
No personal income docs; deal must DSCR.
Hard money
10% down · 12.0% · 12mo
- Down + closing
- —
- Monthly P&I
- —
- Monthly cashflow
- —
- DSCR
- —
- Eligible?
- —
Short-term bridge; refi at stabilization.
Rent comps 1 comps
| Address | Beds | Baths | Sqft | Rent | $/sqft | DOM | Units | Dist |
|---|---|---|---|---|---|---|---|---|
| 1416 S Hardy Ave Independence, MO | 5.0 | 2.0 | 1328 | $1,625 | $1.22 | 45d | 1 | 0.32mi |
Listing history 44 events
-
2026-06-21days on market $175,000 Active 89 DOM
-
2026-06-18days on market $175,000 Active 86 DOM
-
2026-06-17days on market $175,000 Active 85 DOM
-
2026-06-16days on market $175,000 Active 84 DOM
-
2026-06-15statusdays on market $175,000 Active 83 DOM
-
2026-06-01status $175,000 Pending 82 DOM
-
2026-05-31days on market $175,000 Active 82 DOM
-
2026-04-27price $175,000 884-char remark
Show marketing remark (884 chars)
This turn-key duplex is a premier investment opportunity in a high-demand rental district. The property offers exceptional peace of mind with a one-year-old roof, ensuring low maintenance costs and long-term structural integrity for the new owner. The building provides immediate financial stability, as one unit is currently occupied by reliable, long-term tenants with a lease secured through next year. This guaranteed income stream allows for a seamless transition while you capitalize on the building's prime location and consistent historical occupancy. The second unit is move-in ready and features fresh designer paint, modern durable flooring, and plush new carpeting throughout. Whether you choose to house-hack and live for a fraction of the cost or rent it out at top-market rates, this refreshed space is designed to attract high-quality applicants in a high-growth area.
-
2026-04-27price $172,500 884-char remark
Show marketing remark (884 chars)
This turn-key duplex is a premier investment opportunity in a high-demand rental district. The property offers exceptional peace of mind with a one-year-old roof, ensuring low maintenance costs and long-term structural integrity for the new owner. The building provides immediate financial stability, as one unit is currently occupied by reliable, long-term tenants with a lease secured through next year. This guaranteed income stream allows for a seamless transition while you capitalize on the building's prime location and consistent historical occupancy. The second unit is move-in ready and features fresh designer paint, modern durable flooring, and plush new carpeting throughout. Whether you choose to house-hack and live for a fraction of the cost or rent it out at top-market rates, this refreshed space is designed to attract high-quality applicants in a high-growth area.
-
2026-04-16price $180,000 884-char remark
Show marketing remark (884 chars)
This turn-key duplex is a premier investment opportunity in a high-demand rental district. The property offers exceptional peace of mind with a one-year-old roof, ensuring low maintenance costs and long-term structural integrity for the new owner. The building provides immediate financial stability, as one unit is currently occupied by reliable, long-term tenants with a lease secured through next year. This guaranteed income stream allows for a seamless transition while you capitalize on the building's prime location and consistent historical occupancy. The second unit is move-in ready and features fresh designer paint, modern durable flooring, and plush new carpeting throughout. Whether you choose to house-hack and live for a fraction of the cost or rent it out at top-market rates, this refreshed space is designed to attract high-quality applicants in a high-growth area.
-
2026-04-03price $185,000 884-char remark
Show marketing remark (884 chars)
This turn-key duplex is a premier investment opportunity in a high-demand rental district. The property offers exceptional peace of mind with a one-year-old roof, ensuring low maintenance costs and long-term structural integrity for the new owner. The building provides immediate financial stability, as one unit is currently occupied by reliable, long-term tenants with a lease secured through next year. This guaranteed income stream allows for a seamless transition while you capitalize on the building's prime location and consistent historical occupancy. The second unit is move-in ready and features fresh designer paint, modern durable flooring, and plush new carpeting throughout. Whether you choose to house-hack and live for a fraction of the cost or rent it out at top-market rates, this refreshed space is designed to attract high-quality applicants in a high-growth area.
-
2026-03-18price $190,000 884-char remark
Show marketing remark (884 chars)
This turn-key duplex is a premier investment opportunity in a high-demand rental district. The property offers exceptional peace of mind with a one-year-old roof, ensuring low maintenance costs and long-term structural integrity for the new owner. The building provides immediate financial stability, as one unit is currently occupied by reliable, long-term tenants with a lease secured through next year. This guaranteed income stream allows for a seamless transition while you capitalize on the building's prime location and consistent historical occupancy. The second unit is move-in ready and features fresh designer paint, modern durable flooring, and plush new carpeting throughout. Whether you choose to house-hack and live for a fraction of the cost or rent it out at top-market rates, this refreshed space is designed to attract high-quality applicants in a high-growth area.
-
2026-03-11$200,000 Active 884-char remark
Show marketing remark (884 chars)
This turn-key duplex is a premier investment opportunity in a high-demand rental district. The property offers exceptional peace of mind with a one-year-old roof, ensuring low maintenance costs and long-term structural integrity for the new owner. The building provides immediate financial stability, as one unit is currently occupied by reliable, long-term tenants with a lease secured through next year. This guaranteed income stream allows for a seamless transition while you capitalize on the building's prime location and consistent historical occupancy. The second unit is move-in ready and features fresh designer paint, modern durable flooring, and plush new carpeting throughout. Whether you choose to house-hack and live for a fraction of the cost or rent it out at top-market rates, this refreshed space is designed to attract high-quality applicants in a high-growth area.
-
2026-03-10historical $200,000 884-char remark
Show marketing remark (884 chars)
This turn-key duplex is a premier investment opportunity in a high-demand rental district. The property offers exceptional peace of mind with a one-year-old roof, ensuring low maintenance costs and long-term structural integrity for the new owner. The building provides immediate financial stability, as one unit is currently occupied by reliable, long-term tenants with a lease secured through next year. This guaranteed income stream allows for a seamless transition while you capitalize on the building's prime location and consistent historical occupancy. The second unit is move-in ready and features fresh designer paint, modern durable flooring, and plush new carpeting throughout. Whether you choose to house-hack and live for a fraction of the cost or rent it out at top-market rates, this refreshed space is designed to attract high-quality applicants in a high-growth area.
-
2026-03-09historical
-
2025-11-25historical
-
2025-06-10historical
-
2025-05-28price $170,000
-
2025-05-10status Active
-
2025-05-03historical Active Under Contract
-
2025-04-25price $175,000
-
2025-04-15$185,000 Active
-
2022-01-28soldstatus
-
2022-01-27soldstatus Closed
-
2021-11-20historical Active Under Contract
-
2021-11-18$139,000 Active
-
2015-03-19soldstatus
-
2014-11-25soldstatus
-
2013-04-17soldstatus
-
2013-01-08$36,900
-
2007-09-24soldstatus
-
2007-07-16$62,790
-
2005-03-02soldstatus
-
2005-02-28soldstatus
-
2004-11-20$79,900
-
2001-11-13soldstatus
-
2001-06-22soldstatus
-
2000-05-09soldstatus
-
2000-05-05soldstatus
-
2000-03-23$61,750
-
1997-10-31soldstatus
-
1997-10-30soldstatus
-
1997-05-14$60,000
-
1989-10-20soldstatus
ⓘ Source: listings_history table (triggers on properties + properties_extension) + one-shot
backfill from property_details.listing_events for pre-trigger history.
Tax reassessment forecast MO · Resets to sale price
- Current annual tax
- $1,544 · $129/mo
- Projected year-2 tax
- $1,698 · $141/mo
- Expected delta
- +$154/yr (+$13/mo · 10.0%)
ⓘ Screening estimate from a state-policy table — verify with the county assessor before closing.
Climate risk First Street
- Flood 9/10 Extreme FEMA zone X (unshaded) · 99% chance over 30 yrs
- Wildfire 1/10 Low
- Heat 4/10 Moderate 7 d/yr ≥106°F today · 17 d/yr by 30 yrs out
- Wind 2/10 Low
- Air quality 3/10 Moderate 2 unhealthy d/yr today · 3 by 30 yrs out
Nearby sold comps map
Loading sold comps map…
Walkable amenities ~0.75 mi
Loading nearby amenities…
Taxation est. · year 1
- Rental income
- $22,200
- − Mortgage interest
- −$9,803
- − Property taxes
- −$1,544
- − Insurance
- −$1,542
- − Repairs & maintenance
- −$1,776
- − Management
- −$1,776
- − Depreciation
- −$5,091
- Taxable income
- $669
- Est. tax owed @ 24.0%
- −$161
- After-tax cash flow
- $3,280/yr
For passive investors: Depreciation is non-cash, so a rental often shows a tax loss while cash-flowing — sheltering income. Rental losses are passive: they offset passive income freely, and up to $25,000/yr can offset ordinary (W-2) income if you actively participate and your MAGI is under $100k (phasing out to $0 by $150k); unused losses carry forward. On sale, claimed depreciation is recaptured at up to 25%, and gains may owe capital-gains tax (a 1031 exchange can defer both). Figures are a year-1 estimate at your 24.0% rate — not tax advice; consult a CPA.
Schools (NCES district)
- District
- Independence 30
- NCES district ID
- 2915480
- Math proficiency
- 26% ▼ -8.00%
- Reading proficiency
- 38% ▼ -5.00%
- Median HH income
- $41,843
- Composite
- 27.04/100
- National rank
- #7054
- State rank
- #252 of 324 in MO
Livability — Independence
- Score
- 82/100
- State rank
- #10
- US rank
- #1296
Category grades
Schools grade is shown separately in the Schools card above.
Census & demographics
- Census place
- Independence, MO
- County
- Jackson County · 687,798 people
- City population
- 117,675
- Metro
- Kansas City, MO-KS
- Population (ZIP)
- 22,138
- Household income
- $59,007
- Rent vs Own
- Severe rent burden
- 965.0
Population outlook (Jackson County) Hauer SSP2
- Today (2025)
- 719,589 people
- By 2030
- 731,456 · +1.6%
- By 2040
- 746,689 · +3.8%
- By 2050
- 749,289 · +4.1%
- By 2075
- 736,227 · +2.3%
- By 2100
- 668,210 · -7.1%
Race, ethnicity, and origin ACS 2023
- Neighborhood character
- Diverse neighborhood (Simpson 0.56)
- Race & ethnicity
- White 62% Hispanic / Latino 23% Two or more races 15% Black 7% Asian 2%
- Hispanic origin (detail)
- Mexican 15%
- Common ancestry
- Italian 12% Slovak 2% Lithuanian 2%
- Foreign-born
- 11% · Canada, China
- Languages at home
- 85% English-only · Spanish 13% Other Asian/Pacific 1%
Political lean MEDSL · Jackson
- 2024 margin
- D (+19.3) · D 58.9% · R 39.5% · Other 1.6%
- 2008→2024 swing
- -6.1pp toward R · 2008: 25.4pp · 2024: 19.3pp
- All cycles
- 2024: D+19.3 2020: D+22.0 2016: D+16.6 2012: D+19.0 2008: D+25.4
Not yet ingested
- Civics
- —
Market trends
- HPI YoY
- ▼ -160.06%
- Current HPI
- 302.1124
- Rent YoY
- ▲ 5.43%
- Metro
- Kansas City, MO-KS
- State GDP YoY
- ▲ 1.84%
- F500 in state
- 20
Industry mix (Fortune 500 HQ in MO)
| Industry | F500 HQs | Revenue |
|---|---|---|
| Healthcare | 1 | $163B |
|
||
| Insurance | 1 | $21B |
|
||
| Industrial Technology | 1 | $17B |
|
||
| Retail | 1 | $16B |
|
||
| Industrial Distribution | 1 | $10B |
|
||
| Utilities | 1 | $9B |
|
||
Price history
+191.7% since first listed37 events — show timeline
- 2026-04-27 Price Changed $175,000 Heartland MLS as Distributed by MLS Grid
- 2026-04-27 Price Changed $172,500 Heartland MLS as Distributed by MLS Grid
- 2026-04-16 Price Changed $180,000 Heartland MLS as Distributed by MLS Grid
- 2026-04-03 Price Changed $185,000 Heartland MLS as Distributed by MLS Grid
- 2026-03-18 Price Changed $190,000 Heartland MLS as Distributed by MLS Grid
- 2026-03-11 Listed $200,000 Heartland MLS as Distributed by MLS Grid
- 2026-03-10 Coming Soon $200,000 Heartland MLS as Distributed by MLS Grid
- 2026-03-09 Listing Removed — Heartland MLS as Distributed by MLS Grid
- 2025-11-25 Coming Soon — Heartland MLS as Distributed by MLS Grid
- 2025-06-10 Listing Removed — Heartland MLS as Distributed by MLS Grid
- 2025-05-28 Price Changed $170,000 Heartland MLS as Distributed by MLS Grid
- 2025-05-10 Relisted — Heartland MLS as Distributed by MLS Grid
- 2025-05-03 Contingent — Heartland MLS as Distributed by MLS Grid
- 2025-04-25 Price Changed $175,000 Heartland MLS as Distributed by MLS Grid
- 2025-04-15 Listed $185,000 Heartland MLS as Distributed by MLS Grid
- 2022-01-28 Sold (Public Records) — Public Records
- 2022-01-27 Sold (MLS) — Heartland MLS as Distributed by MLS Grid
- 2021-11-20 Contingent — Heartland MLS as Distributed by MLS Grid
- 2021-11-18 Listed $139,000 Heartland MLS as Distributed by MLS Grid
- 2015-03-19 Sold (Public Records) — Public Records
- 2014-11-25 Sold (Public Records) — Public Records
- 2013-04-17 Sold (MLS) — Heartland MLS as Distributed by MLS Grid
- 2013-01-08 Listed $36,900 Heartland MLS as Distributed by MLS Grid
- 2007-09-24 Sold (MLS) — Heartland MLS as Distributed by MLS Grid
- 2007-07-16 Listed $62,790 Heartland MLS as Distributed by MLS Grid
- 2005-03-02 Sold (Public Records) — Public Records
- 2005-02-28 Sold (MLS) — Heartland MLS as Distributed by MLS Grid
- 2004-11-20 Listed $79,900 Heartland MLS as Distributed by MLS Grid
- 2001-11-13 Sold (Public Records) — Public Records
- 2001-06-22 Sold (Public Records) — Public Records
- 2000-05-09 Sold (Public Records) — Public Records
- 2000-05-05 Sold (MLS) — Heartland MLS as Distributed by MLS Grid
- 2000-03-23 Listed $61,750 Heartland MLS as Distributed by MLS Grid
- 1997-10-31 Sold (MLS) — Heartland MLS as Distributed by MLS Grid
- 1997-10-30 Sold (Public Records) — Public Records
- 1997-05-14 Listed $60,000 Heartland MLS as Distributed by MLS Grid
- 1989-10-20 Sold (Public Records) — Public Records
Property tax history
+3.4%/yrLatest (2025): $1,544 · -37.1% YoY. Source: county tax records.
Cash-flow waterfall
monthlySold comps — $/sqft
last 12 mo · ≤1 miLoading sold comps…