 Multi-family
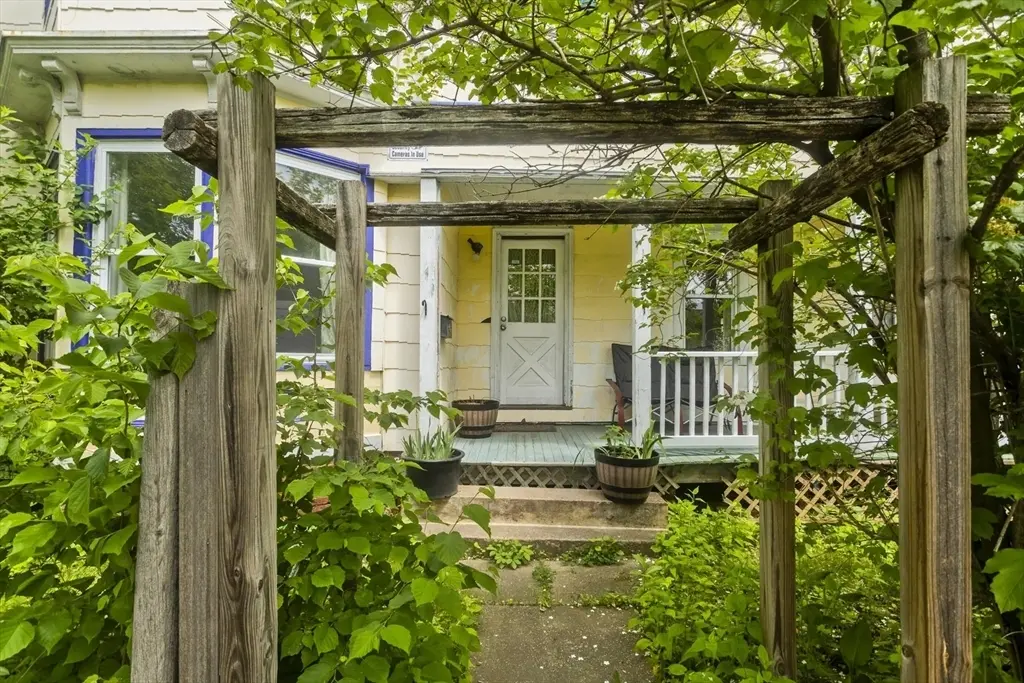
146 Beech St · Holyoke, MA
Flood risk 1/10 · Minimal
- FEMA flood zone
- X (unshaded)
- Chance of flooding over 30 yrs
- 0.0%
- Est. flood insurance / yr
- $473 – $860
Fire risk 3/10 · Minor
- Est. fire insurance / yr
- $915 – $1,699
Heat risk 4/10 · Minor
- Hot days now (above 98°F)
- 7 days/yr
- Hot days in 30 yrs
- 16 days/yr
Wind risk 5/10 · Moderate
- Chance of severe wind over 30 yrs
- 23.0%
Air-quality risk 2/10 · Minimal
- Unhealthy air days now
- 1 days/yr
- Unhealthy air days in 30 yrs
- 1 days/yr
Risk factors via First Street. Map © Google.
Why this score? — see what drove the D- grade
The composite is a weighted blend of 9 inputs, each scored 0–100. Each bar is that input's sub-score; the figure is the points it added to the 100-point composite (weight × sub-score).
- ARV discount +11.6/15.0
- Cash flow +10.6/30.0
- Livability +3.1/5.0
- DSCR +3.0/10.0
- 1% rule +2.8/10.0
- Rent growth +2.5/5.0
- Condition / age +2.5/5.0
- Schools +0.8/10.0
- Appreciation +0.0/10.0
$300,000
🖨 Deal sheet (PDF) 📄 Offer letter ✓ Due diligence
Multi-family units
County records classify this as Multi-Family (2-4 Unit). Listing-text estimate: 1 unit. estimate disagrees with records
Listing remarks MLS
REPLACEMENT WINDOWS, SEPARATE GAS UTILITIES, CIRCUIT BREAKERS, OFF STREET PARKING. 2 BEDROOMS ON 1ST FLOOR, 3 BEDROOMS ON THE 2ND FLOOR PLUS EXTRA ROOMS ON THE 3RD. LET THE TENANTS PAY YOUR MORTGAGE.
Key facts
- Private side porch
- Private porches
- Two story unit
Tags
Property features AI
Finance
- HOA & community: Public transportation nearby; Shopping nearby; Not a senior community
Exterior
- Parking: Paved driveway; 3 open parking spaces
- Utilities: Public water; Public sewer; Gas available for range
- Home design: Multi-family property; 3 stories
- Construction: Brick/mortar foundation; Built approximately (public records)
- Exterior features: Porch; Patio; Corner lot
Interior
- Kitchen: Range; Refrigerator
- Bathrooms: 2 full bathrooms
- Heating & cooling: Forced air heating; Natural gas heating; Electric heating; Radiant heating; Ductless heating
- Interior features: Living room; Dining room; Kitchen; Total of 10 rooms
Neighborhood map
What this means for you Summary
Snapshot
- This is a 4-bed/2.0-bath multifamily listed at $300k.
Deal economics
- At list price, monthly cash flow is $-150 ($-2k/yr) — negative.
- To cash-flow at today's rent, offer at most $274k (8.8% below list).
- To meet the 1% rule (rent ≥ 1% of price), the offer needs to be $235k (21.8% below list).
- Recommended offer: $235k (21.8% below list) — sets the bar for 1% rule.
Location & tenants
- Location reads 62/100 on livability (#203 in MA) — a middle-class / working-renter tenant base. Strengths: commute A+, health & safety A+, housing B; Watch: schools F, crime F, amenities F.
- Holyoke (suburban): math 5% / reading 14% proficiency, ranked #302 of 302 in MA (top 100%) — low school quality limits family demand, transient renter base, plan for 1-2y turnover; 82% free/reduced lunch — lower-income household profile, screen leases tightly.
- Market conditions: 43 active listings in the ZIP; 3 comparable units currently listed for rent nearby; rentals lingering (median 45d on market — plan ~5-8 weeks vacancy on turnover, expect pricing pressure); 67% of comp listings sitting > 30 days — soft ceiling on asking rent; 453 units permitted in Hampden County in 2024 (116 in 5+ unit buildings).
- At $2,346/mo this rent would consume 53% of the median local household income ($54k/yr) (locally 2404% of renters already pay >50% of income on rent) — very limited rent-growth headroom before tenants either downsize or default.
Forward outlook
- Local home prices are declining (-3.0%/yr); year-one equity from $2k of loan paydown is wiped out by about $9k of value loss. Plan a longer hold.
- Hampden County population projected at +5% by 2050 — modest demand growth; plan on rents tracking national, not racing it.
Negotiation context
- It's been on market 26 days — a 2% lower offer ($296k) is reasonable based on typical stale-listing flexibility.
- 2 sale attempts since 24y ago with the ask held roughly flat each time — persistent listings suggest the price (not the market) is what's stuck; bring a comps-based counter.
- Current owner paid $49k; list at $300k implies a 512% gain — meaningful room to come down on a strong offer.
Risks & watch-outs
- Watch-outs: built in 1885 — expect roof / HVAC / electrical / plumbing capex.
- Climate carrying-cost: moderate wind risk, 23% chance of damaging wind over 30y — expect insurance premiums to compound above CPI over the hold.
Questions for the listing agent
- What do current leases actually rent for vs. the listed asking? Can we see a recent rent roll and the last 12 months of T-12 income?
- Built in 1885 — when were the roof, HVAC, electrical panel, plumbing, and water heater last replaced?
- Is there a deadline driving the sale (1031 exchange, divorce, estate, relocation)? That informs how much negotiation room exists.
- Schools are F-rated, which usually means shorter tenancies and higher turnover. Who's the typical renter profile here, and what's been the actual vacancy rate?
- Crime grade is F in this area — have there been break-ins, vandalism, or insurance claims at this property in the last 3 years? What carrier currently insures it and at what premium?
- The area grade is low — what's the realistic commute time and amenity access for the typical tenant pool here? Any planned neighborhood developments (good or bad) we should know about?
- What's the average days-on-market for RENTAL listings here right now (not sales)? A rising rental-DOM trend means longer vacancies and softer asking-rent achievability than the comps imply.
- What's the recent tenant-quality profile in this submarket — average credit score on applications, eviction rate, late-payment / NSF rate, and stable-employment percentage? A property-management company in the area should have these aggregated.
- How much new apartment / multifamily construction is in the pipeline within 1–3 miles? Heavy new supply (>2% of stock underway) typically softens rents 12–24 months out; light construction supports rent growth.
Investment metrics
- 1% rule
- 0.78% ✗
- Cap rate
- 5.69%
- Cash-on-cash
- -2.14%
- DSCR
- 0.90
- GRM
- 10.7
CMA / ARV
- ARV (on-the-fly)
- $329,920
- Comps found
- 7
Show comp detail 7 sales within ~0.75 mi
| Address | Dist | Beds/Ba | Sqft | Sold | Price | $/sf | Match |
|---|---|---|---|---|---|---|---|
| 63 Pine St | 0.24mi | 4/2.0 | 2,000 (-3%) | 4mo | $280,000 | $140 | 81 |
| 4 Faille Ave | 0.54mi | 4/2.0 | 2,244 (+9%) | 11mo | $300,000 | $134 | 51 |
| 238 Lyman St | 0.28mi | 4/2.0 | 1,768 (-14%) | 15mo | $320,000 | $181 | 51 |
| 140 Pearl St | 0.59mi | 5/2.0 (+1) | 1,920 (-7%) | 10mo | $385,000 | $201 | 48 |
| 72 Allyn St | 0.64mi | 4/2.0 | 1,800 (-13%) | 3mo | $237,000 | $132 | 46 |
| 109 Waldo St | 0.61mi | 5/3.0 (+1) | 1,840 (-11%) | 17mo | $295,000 | $160 | 30 |
| 1 Williams St | 0.74mi | 3/2.0 (-1) | 1,852 (-10%) | 16mo | $416,000 | $225 | 30 |
Match score weights: distance 35% · size 25% · config 20% · recency 20%. Top-matched comps best support the ARV.
Projected returns pro-forma
-3.0% appreciation · 3.0% rent growth · sell at horizon
- IRR
- -19.9%
- Equity multiple
- 0.31×
- Total profit
- $-58,168
- Equity at exit
- $44,731
- IRR
- -12.8%
- Equity multiple
- 0.25×
- Total profit
- $-62,977
- Equity at exit
- $25,939
Cash invested: $84,000 (down + closing). Projections, not guarantees.
Landlord ↔ Tenant lean methodology
- Overall (STATE)
- 20 Strongly Tenant-Friendly
- State Massachusetts
- 20 Strongly Tenant-Friendly · D+15
- County
- — inherits STATE
- City
- — inherits STATE
ZIP-level market 01040
- Home prices YoY
- -33.2%
- Active inventory
- 43
- Price-to-rent
- 10.7×
Monthly cashflow live
- Estimated rent
- $2,346 medium interval (Pro) →
- Mortgage (P&I)
- −$1,573
- Tax from tax record
- −$305 /mo · $3,658/yr
- Insurance
- −$125
- HOA
- −$0
- Vacancy / Maint / Mgmt
- −$493
- Net cashflow
- $-150
Break-even live
Sensitivity live
| Price | -10% $20 | -5% $-65 | +0% $-150 | +5% $-235 | +10% $-320 |
|---|---|---|---|---|---|
| Rent | -10% $-335 | -5% $-243 | +0% $-150 | +5% $-57 | +10% $35 |
| Rate | -1.0pp $1 | -0.5pp $-74 | base $-150 | +0.5pp $-228 | +1.0pp $-307 |
UW: 25.0% down · 7.5% · 30yr · 1.5% tax · 5.0% vac · 8.0% maint · 8.0% mgmt
Financing live
Cash to close
- Down payment
- $75,000
- Closing costs
- $9,000
- Reserves months
- —
- Total cash needed
- —
Loan-product check · same deal, 3 products live
Conventional
25% down · 7.5% · 30yr
- Down + closing
- —
- Monthly P&I
- —
- Monthly cashflow
- —
- DSCR
- —
- Eligible?
- —
Personal DTI + credit; lowest rate.
DSCR
20% down · 8.5% · 30yr
- Down + closing
- —
- Monthly P&I
- —
- Monthly cashflow
- —
- DSCR
- —
- Eligible?
- —
No personal income docs; deal must DSCR.
Hard money
10% down · 12.0% · 12mo
- Down + closing
- —
- Monthly P&I
- —
- Monthly cashflow
- —
- DSCR
- —
- Eligible?
- —
Short-term bridge; refi at stabilization.
Rent comps 3 comps
| Address | Beds | Baths | Sqft | Rent | $/sqft | DOM | Units | Dist |
|---|---|---|---|---|---|---|---|---|
| 297 Beech St Unit 3 Holyoke, MA | 4.0 | 1.0 | 1600 | $2,500 | $1.56 | 44d | 1 | 0.41mi |
| 11 Worcester Pl Unit 2 Holyoke, MA | 3.0 | 1.0 | 1500 | $1,850 | $1.23 | 22d | 1 | 0.51mi |
| 109 Ridgewood Ave Holyoke, MA | 3.0 | 1.5 | 1584 | $2,499 | $1.58 | 44d | 1 | 1.16mi |
Listing history 22 events
-
2026-06-18days on market $300,000 Active 26 DOM
-
2026-06-17days on market $300,000 Active 25 DOM
-
2026-06-16days on market $300,000 Active 24 DOM
-
2026-06-15days on market $300,000 Active 23 DOM
-
2026-06-14days on market $300,000 Active 21 DOM
-
2026-06-10days on market $300,000 Active 18 DOM
-
2026-06-09days on market $300,000 Active 17 DOM
-
2026-06-08days on market $300,000 Active 16 DOM
-
2026-06-07days on market $300,000 Active 15 DOM
-
2026-06-03days on market $300,000 Active 11 DOM
-
2026-06-02days on market $300,000 Active 10 DOM
-
2026-06-01days on market $300,000 Active 9 DOM
-
2026-05-31days on market $300,000 Active 8 DOM
-
2026-05-30days on market $300,000 Active 7 DOM
-
2026-05-23$300,000 New
-
2007-07-03soldstatus $49,000
-
2007-04-03soldstatus $76,500
-
2006-05-01soldstatus $175,000
-
2004-08-16soldstatus $115,000
-
2003-01-27soldstatus $69,900 201-char remark
Show marketing remark (201 chars)
REPLACEMENT WINDOWS, SEPARATE GAS UTILITIES, CIRCUIT BREAKERS, OFF STREET PARKING. 2 BEDROOMS ON 1ST FLOOR, 3 BEDROOMS ON THE 2ND FLOOR PLUS EXTRA ROOMS ON THE 3RD. LET THE TENANTS PAY YOUR MORTGAGE.
-
2003-01-24soldstatus $69,900
-
2002-08-15$69,900 201-char remark
Show marketing remark (201 chars)
REPLACEMENT WINDOWS, SEPARATE GAS UTILITIES, CIRCUIT BREAKERS, OFF STREET PARKING. 2 BEDROOMS ON 1ST FLOOR, 3 BEDROOMS ON THE 2ND FLOOR PLUS EXTRA ROOMS ON THE 3RD. LET THE TENANTS PAY YOUR MORTGAGE.
ⓘ Source: listings_history table (triggers on properties + properties_extension) + one-shot
backfill from property_details.listing_events for pre-trigger history.
Tax reassessment forecast MA · Partial reset (capped growth)
- Current annual tax
- $3,658 · $305/mo
- Projected year-2 tax
- $3,674 · $306/mo
- Expected delta
- +$16/yr (+$1/mo · 0.4%)
ⓘ Screening estimate from a state-policy table — verify with the county assessor before closing.
Climate risk First Street
- Flood 1/10 Low FEMA zone X (unshaded) · 0% chance over 30 yrs
- Wildfire 3/10 Moderate
- Heat 4/10 Moderate 7 d/yr ≥98°F today · 16 d/yr by 30 yrs out
- Wind 5/10 Major 23% chance of damaging wind over 30 yrs
- Air quality 2/10 Low 1 unhealthy d/yr today · 1 by 30 yrs out
Nearby sold comps map
Loading sold comps map…
Walkable amenities ~0.75 mi
Loading nearby amenities…
Taxation est. · year 1
- Rental income
- $28,149
- − Mortgage interest
- −$16,805
- − Property taxes
- −$3,658
- − Insurance
- −$1,500
- − Repairs & maintenance
- −$2,252
- − Management
- −$2,252
- − Depreciation
- −$8,727
- Taxable loss
- −$7,045
- Est. tax savings @ 24.0%
- +$1,691
- After-tax cash flow
- $-108/yr
For passive investors: Depreciation is non-cash, so a rental often shows a tax loss while cash-flowing — sheltering income. Rental losses are passive: they offset passive income freely, and up to $25,000/yr can offset ordinary (W-2) income if you actively participate and your MAGI is under $100k (phasing out to $0 by $150k); unused losses carry forward. On sale, claimed depreciation is recaptured at up to 25%, and gains may owe capital-gains tax (a 1031 exchange can defer both). Figures are a year-1 estimate at your 24.0% rate — not tax advice; consult a CPA.
Schools (NCES district)
- District
- Holyoke
- NCES district ID
- 2506270
- Math proficiency
- 5% ▼ -7.00%
- Reading proficiency
- 14% ▼ -5.00%
- Median HH income
- $35,495
- Composite
- 7.79/100
- National rank
- #9934
- State rank
- #302 of 302 in MA
Livability — Holyoke
- Score
- 62/100
- State rank
- #203
- US rank
- #16308
Category grades
Schools grade is shown separately in the Schools card above.
Census & demographics
- Census place
- Holyoke, MA
- County
- Hampden County · 230,965 people
- City population
- 37,813
- Metro
- Springfield, MA
- Population (ZIP)
- 37,813
- Household income
- $53,605
- Rent vs Own
- Severe rent burden
- 2404.0
Population outlook (Hampden County) Hauer SSP2
- Today (2025)
- 485,646 people
- By 2030
- 491,517 · +1.2%
- By 2040
- 500,539 · +3.1%
- By 2050
- 508,827 · +4.8%
- By 2075
- 539,167 · +11.0%
- By 2100
- 545,698 · +12.4%
Race, ethnicity, and origin ACS 2023
- Neighborhood character
- Majority Hispanic (52%)
- Race & ethnicity
- Hispanic / Latino 52% White 43% Two or more races 23% Black 2%
- Hispanic origin (detail)
- Puerto Rican 45% Dominican 2%
- Common ancestry
- Lithuanian 5% Romanian 4% Slovak 1%
- Foreign-born
- 6% · Canada, Jamaica
- Languages at home
- 58% English-only · Spanish 39% Russian/Polish/Slavic 1% French/Haitian/Cajun 1%
Political lean MEDSL · Hampden
- 2024 margin
- Lean D (+8.9) · D 53.4% · R 44.5% · Other 2.1%
- 2008→2024 swing
- -16.4pp toward R · 2008: 25.3pp · 2024: 8.9pp
- All cycles
- 2024: D+8.9 2020: D+17.7 2016: D+16.0 2012: D+25.4 2008: D+25.3
Not yet ingested
- Civics
- —
Market trends
- HPI YoY
- ▼ -146.03%
- Current HPI
- 293.93
- Rent YoY
- —
- Metro
- Springfield, MA
- State GDP YoY
- ▲ 2.28%
- F500 in state
- 38
Industry mix (Fortune 500 HQ in MA)
| Industry | F500 HQs | Revenue |
|---|---|---|
| Technology | 3 | $17B |
|
||
| Insurance | 2 | $84B |
|
||
| Retail | 2 | $76B |
|
||
| Life Sciences | 1 | $43B |
|
||
| Energy Technology | 1 | $31B |
|
||
| Aerospace / Defense | 1 | $18B |
|
||
Price history
+329.2% since first listed8 events — show timeline
- 2026-05-23 Listed $300,000 MLS PIN
- 2007-07-03 Sold (Public Records) $49,000 Public Records
- 2007-04-03 Sold (Public Records) $76,500 Public Records
- 2006-05-01 Sold (Public Records) $175,000 Public Records
- 2004-08-16 Sold (Public Records) $115,000 Public Records
- 2003-01-27 Sold (MLS) $69,900 MLS PIN
- 2003-01-24 Sold (Public Records) $69,900 Public Records
- 2002-08-15 Listed $69,900 MLS PIN
Property tax history
+4.3%/yrLatest (2023): $3,658 · -0.4% YoY. Source: county tax records.
Cash-flow waterfall
monthlySold comps — $/sqft
last 12 mo · ≤1 miLoading sold comps…