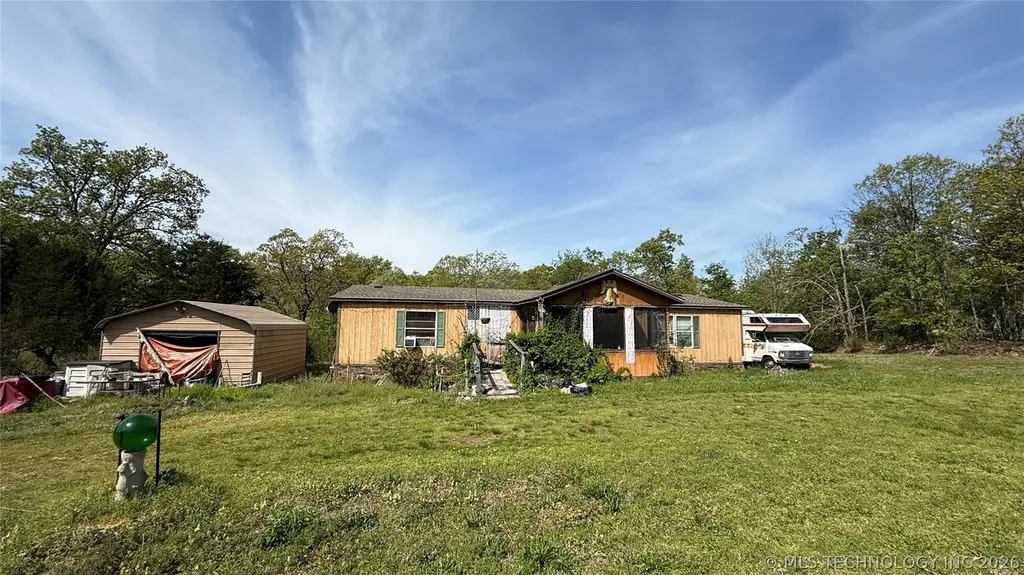
26989 S Indian Rd · Pettit, OK
Flood risk 1/10 · Minimal
- FEMA flood zone
- X (unshaded)
- Chance of flooding over 30 yrs
- 0.0%
- Est. flood insurance / yr
- $507 – $1,088
Fire risk 7/10 · Major
- Est. fire insurance / yr
- $2,463 – $4,575
Heat risk 5/10 · Moderate
- Hot days now (above 111°F)
- 7 days/yr
- Hot days in 30 yrs
- 19 days/yr
Wind risk 2/10 · Minimal
- Chance of severe wind over 30 yrs
- 3.0%
Air-quality risk 2/10 · Minimal
- Unhealthy air days now
- 1 days/yr
- Unhealthy air days in 30 yrs
- 1 days/yr
Risk factors via First Street. Map © Google.
Why this score? — see what drove the B+ grade
The composite is a weighted blend of 9 inputs, each scored 0–100. Each bar is that input's sub-score; the figure is the points it added to the 100-point composite (weight × sub-score).
- Cash flow +30.0/30.0
- DSCR +10.0/10.0
- 1% rule +8.6/10.0
- Appreciation +7.8/10.0
- ARV discount +7.5/15.0
- Schools +3.4/10.0
- Livability +3.1/5.0
- Rent growth +2.5/5.0
- Condition / age +2.5/5.0
$89,000
🖨 Deal sheet (PDF) 📄 Offer letter ✓ Due diligence
Listing remarks
No restrictions on this 3.23 acre parcel 7 minutes to Pettit Bay Marina and Tenkiller Lake Access. Paved road for easy commute to town. Great location for a Lake Area business and or build a new home! The roof is 5 years old; however, this manufactued home is in need of repairs so, No FHA, VA or USDA please.
Key facts
- Paved road
- 3.23 acre parcel
- 3.23 acre lot
Tags
Property features AI
Finance
- Other: Lot size approximately 3.23 acres; Water body nearby: Tenkiller Lake
- Financial info: Annual taxes info provided
- HOA & community: Community marina
Exterior
- Parking: Driveway parking (gravel)
- Security: No safety shelter
- Utilities: Cable available; Electricity available; Natural gas available; Phone available; Septic tank; Rural water
- Home design: Manufactured home (double wide); Single-story; Faces east; Tie-down foundation
- Construction: Manufactured construction; Asphalt/fiberglass roof
- Exterior features: Enclosed porch; Porch; Gravel driveway; Mature trees; Sloped/rolling lot; Zero lot line; Less than 5 miles to water (Tenkiller Lake); Horses allowed
Interior
- Kitchen: Dishwasher; Oven; Range; Stove
- Bedrooms: Bedroom details not provided
- Flooring: Carpet; Vinyl; Wood veneer
- Bathrooms: 2 full bathrooms
- Heating & cooling: Central heating (electric); Central air; Window unit(s)
- Interior features: Ceiling fan(s); Laminate counters; Gas range and gas oven connections; Aluminum window frames; Other built-in features
- Laundry & utility: Washer hookup; Electric dryer hookup; Electric water heater
Neighborhood map
What this means for you Summary
Snapshot
- This is a 3-bed/2.0-bath manufactured listed at $89k.
Deal economics
- At list price, monthly cash flow is $426 ($5k/yr) — positive.
- The deal already cash-flows at list — no discount required.
- Meets the 1% rule at list price ($1k rent vs $89k).
- Recommended offer: $84k (6.0% below list) — sets the bar for market timing.
Location & tenants
- Location reads 62/100 on livability (#258 in OK) — a middle-class / working-renter tenant base. Strengths: cost of living A+, housing A+; Watch: schools C-, crime C-, employment D+.
- Keys (rural): math 39% / reading 40% proficiency, ranked #19 of 270 in OK (top 7%) — families likely to look elsewhere, expect single-tenant / working-renter base with shorter leases.
- Market conditions: 145 active listings in the ZIP; 48 units permitted in Cherokee County in 2024 (0 in 5+ unit buildings).
Forward outlook
- In year one you build about $6k of equity ($615 loan paydown + $5k appreciation (5.7% local appreciation)).
- Cherokee County population projected at +15% by 2050 — modest demand growth; plan on rents tracking national, not racing it.
- At projected returns (5.7% appreciation + 3.0% rent growth), your $25k cash investment doubles in ~3 years — after that, you're playing with house money.
- By year 6, paydown + projected appreciation supports a ~$31k cash-out refi (75% LTV) — recoverable capital for the next deal without selling this one.
Negotiation context
- It's been on market 68 days — a 6% lower offer ($84k) is reasonable based on typical stale-listing flexibility.
- 2 sale attempts since 24y ago; this cycle's ask has dropped $20k (18%) from the opening price — seller is motivated, your offer sets the floor, not the list.
- Current owner paid $71k; 25% above their basis — modest negotiation headroom, anchor on the comps not their cost.
Risks & watch-outs
- Climate carrying-cost: major wildfire risk; extreme-heat days projected 7→19/yr by 2055 (HVAC capex compounding) — expect insurance premiums to compound above CPI over the hold.
Questions for the listing agent
- It's been on market 68 days. Have you received any prior offers? Is the seller open to a 6% concession, seller financing, or rate buy-down credit?
- Why hasn't it sold? Are there any deal-killer items the seller is aware of (foundation, flood, title, zoning, code violations)?
- Is there a deadline driving the sale (1031 exchange, divorce, estate, relocation)? That informs how much negotiation room exists.
- What's the average days-on-market for RENTAL listings here right now (not sales)? A rising rental-DOM trend means longer vacancies and softer asking-rent achievability than the comps imply.
- What's the recent tenant-quality profile in this submarket — average credit score on applications, eviction rate, late-payment / NSF rate, and stable-employment percentage? A property-management company in the area should have these aggregated.
- How much new for-sale + rental construction is in the pipeline within 1–3 miles? Heavy new supply typically softens prices + rents 12–24 months out; constrained supply supports both.
Investment metrics
- 1% rule
- 1.36% ✓
- Cap rate
- 12.03%
- Cash-on-cash
- 20.49%
- DSCR
- 1.91
- GRM
- 6.1
CMA / ARV
No comps found within radius.
Projected returns pro-forma
5.65% appreciation · 3.0% rent growth · sell at horizon
- IRR
- 31.9%
- Equity multiple
- 3.04×
- Total profit
- $50,908
- Equity at exit
- $53,971
- IRR
- 29.9%
- Equity multiple
- 6.18×
- Total profit
- $128,984
- Equity at exit
- $96,209
Cash invested: $24,920 (down + closing). Projections, not guarantees.
Landlord ↔ Tenant lean methodology
- Overall (STATE)
- 83 Strongly Landlord-Friendly
- State Oklahoma
- 83 Strongly Landlord-Friendly · R+20
- County
- — inherits STATE
- City
- — inherits STATE
ZIP-level market 74451
- Home prices YoY
- 2.2%
- Active inventory
- 145
- Price-to-rent
- 6.1×
Monthly cashflow live
- Estimated rent
- $1,210 medium interval (Pro) →
- Mortgage (P&I)
- −$467
- Tax from tax record
- −$26 /mo · $316/yr
- Insurance
- −$37
- HOA
- −$0
- Vacancy / Maint / Mgmt
- −$254
- Net cashflow
- $426
Break-even live
Sensitivity live
| Price | -10% $476 | -5% $451 | +0% $426 | +5% $400 | +10% $375 |
|---|---|---|---|---|---|
| Rent | -10% $330 | -5% $378 | +0% $426 | +5% $473 | +10% $521 |
| Rate | -1.0pp $470 | -0.5pp $448 | base $426 | +0.5pp $403 | +1.0pp $379 |
UW: 25.0% down · 7.5% · 30yr · 1.5% tax · 5.0% vac · 8.0% maint · 8.0% mgmt
Financing live
Cash to close
- Down payment
- $22,250
- Closing costs
- $2,670
- Reserves months
- —
- Total cash needed
- —
Loan-product check · same deal, 3 products live
Conventional
25% down · 7.5% · 30yr
- Down + closing
- —
- Monthly P&I
- —
- Monthly cashflow
- —
- DSCR
- —
- Eligible?
- —
Personal DTI + credit; lowest rate.
DSCR
20% down · 8.5% · 30yr
- Down + closing
- —
- Monthly P&I
- —
- Monthly cashflow
- —
- DSCR
- —
- Eligible?
- —
No personal income docs; deal must DSCR.
Hard money
10% down · 12.0% · 12mo
- Down + closing
- —
- Monthly P&I
- —
- Monthly cashflow
- —
- DSCR
- —
- Eligible?
- —
Short-term bridge; refi at stabilization.
Listing history 19 events
-
2026-06-17status $89,000 Pending 68 DOM
-
2026-06-16days on market $89,000 Active 68 DOM
-
2026-06-15days on market $89,000 Active 67 DOM
-
2026-06-14days on market $89,000 Active 65 DOM
-
2026-06-12days on market $89,000 Active 64 DOM
-
2026-06-09days on market $89,000 Active 61 DOM
-
2026-06-08days on market $89,000 Active 60 DOM
-
2026-06-07days on market $89,000 Active 59 DOM
-
2026-06-05days on market $89,000 Active 56 DOM
-
2026-06-02days on market $89,000 Active 54 DOM
-
2026-06-01days on market $89,000 Active 53 DOM
-
2026-05-31days on market $89,000 Active 52 DOM
-
2026-05-30days on market $89,000 Active 51 DOM
-
2026-05-21price $89,000
-
2026-04-08$109,000 Active
-
2002-04-03soldstatus $71,000
-
2002-04-03soldstatus $71,000
-
2002-02-14historical
-
2002-01-22$59,000
ⓘ Source: listings_history table (triggers on properties + properties_extension) + one-shot
backfill from property_details.listing_events for pre-trigger history.
Tax reassessment forecast OK · Resets to sale price
- Current annual tax
- $316 · $26/mo
- Projected year-2 tax
- $801 · $67/mo
- Expected delta
- +$485/yr (+$40/mo · 153.5%)
ⓘ Screening estimate from a state-policy table — verify with the county assessor before closing.
Climate risk First Street
- Flood 1/10 Low FEMA zone X (unshaded) · 0% chance over 30 yrs
- Wildfire 7/10 Severe
- Heat 5/10 Major 7 d/yr ≥111°F today · 19 d/yr by 30 yrs out
- Wind 2/10 Low 3% chance of damaging wind over 30 yrs
- Air quality 2/10 Low 1 unhealthy d/yr today · 1 by 30 yrs out
Nearby sold comps map
Loading sold comps map…
Walkable amenities ~0.75 mi
Loading nearby amenities…
Taxation est. · year 1
- Rental income
- $14,517
- − Mortgage interest
- −$4,985
- − Property taxes
- −$316
- − Insurance
- −$445
- − Repairs & maintenance
- −$1,161
- − Management
- −$1,161
- − Depreciation
- −$2,589
- Taxable income
- $3,859
- Est. tax owed @ 24.0%
- −$926
- After-tax cash flow
- $4,181/yr
For passive investors: Depreciation is non-cash, so a rental often shows a tax loss while cash-flowing — sheltering income. Rental losses are passive: they offset passive income freely, and up to $25,000/yr can offset ordinary (W-2) income if you actively participate and your MAGI is under $100k (phasing out to $0 by $150k); unused losses carry forward. On sale, claimed depreciation is recaptured at up to 25%, and gains may owe capital-gains tax (a 1031 exchange can defer both). Figures are a year-1 estimate at your 24.0% rate — not tax advice; consult a CPA.
Schools (NCES district)
- District
- Keys
- NCES district ID
- 4000033
- Math proficiency
- 39% ▼ -2.00%
- Reading proficiency
- 40% ▲ 4.00%
- Median HH income
- $46,426
- Composite
- 33.74/100
- National rank
- #5370
- State rank
- #19 of 270 in OK
Livability — Pettit
- Score
- 62/100
- State rank
- #258
- US rank
- #16899
Category grades
Schools grade is shown separately in the Schools card above.
Census & demographics
- Census place
- Pettit, OK
- Population (ZIP)
- 3,816
Population outlook (Cherokee County) Hauer SSP2
- Today (2025)
- 51,747 people
- By 2030
- 53,481 · +3.4%
- By 2040
- 56,503 · +9.2%
- By 2050
- 59,370 · +14.7%
- By 2075
- 67,178 · +29.8%
- By 2100
- 70,900 · +37.0%
Race, ethnicity, and origin ACS 2023
- Neighborhood character
- Highly diverse neighborhood (Simpson 0.73)
- Race & ethnicity
- White 52% Native American 27% Two or more races 20% Hispanic / Latino 4%
- Common ancestry
- Italian 6% Slovak 3% Lithuanian 2%
- Foreign-born
- 2% · Canada
- Languages at home
- 96% English-only · Spanish 2%
Political lean MEDSL · Cherokee
- 2024 margin
- Solid R (+32.6) · D 32.7% · R 65.3% · Other 2.0%
- 2008→2024 swing
- -20.4pp toward R · 2008: -12.2pp · 2024: -32.6pp
- All cycles
- 2024: R+32.6 2020: R+29.3 2016: R+27.5 2012: R+14.1 2008: R+12.2
Not yet ingested
- Civics
- —
Market trends
- HPI YoY
- ▲ 5.65%
- Current HPI
- 256.0707
- Rent YoY
- —
- Metro
- —
- State GDP YoY
- ▲ 1.55%
- F500 in state
- 6
Industry mix (Fortune 500 HQ in OK)
| Industry | F500 HQs | Revenue |
|---|---|---|
| Energy | 3 | $48B |
|
||
Price history
+50.8% since first listed6 events — show timeline
- 2026-05-21 Price Changed $89,000 MLS Technology, Inc.
- 2026-04-08 Listed $109,000 MLS Technology, Inc.
- 2002-04-03 Sold (Public Records) $71,000 Public Records
- 2002-04-03 Sold (MLS) $71,000 MLS Technology, Inc.
- 2002-02-14 Listing Removed — MLS Technology, Inc.
- 2002-01-22 Listed $59,000 MLS Technology, Inc.
Property tax history
-3.2%/yrLatest (2025): $316 · +0.3% YoY. Source: county tax records.
Cash-flow waterfall
monthlySold comps — $/sqft
last 12 mo · ≤1 miLoading sold comps…