863 Cavalier · San Antonio, TX
Flood risk 1/10 · Minimal
- FEMA flood zone
- X (unshaded)
- Chance of flooding over 30 yrs
- 0.0%
- Est. flood insurance / yr
- $507 – $1,088
Fire risk 1/10 · Minimal
- Est. fire insurance / yr
- $1,222 – $2,270
Heat risk 8/10 · Major
- Hot days now (above 108°F)
- 7 days/yr
- Hot days in 30 yrs
- 20 days/yr
Wind risk 7/10 · Major
- Chance of severe wind over 30 yrs
- 78.0%
Air-quality risk 2/10 · Minimal
- Unhealthy air days now
- 1 days/yr
- Unhealthy air days in 30 yrs
- 2 days/yr
Risk factors via First Street. Map © Google.
Why this score? — see what drove the C- grade
The composite is a weighted blend of 9 inputs, each scored 0–100. Each bar is that input's sub-score; the figure is the points it added to the 100-point composite (weight × sub-score).
- Cash flow +14.0/30.0
- ARV discount +13.3/15.0
- Appreciation +6.9/10.0
- 1% rule +4.7/10.0
- DSCR +4.2/10.0
- Livability +4.0/5.0
- Rent growth +2.5/5.0
- Condition / age +2.5/5.0
- Schools +1.4/10.0
$120,000
🖨 Deal sheet 📄 Offer letter ✓ Due diligence
Listing remarks MLS
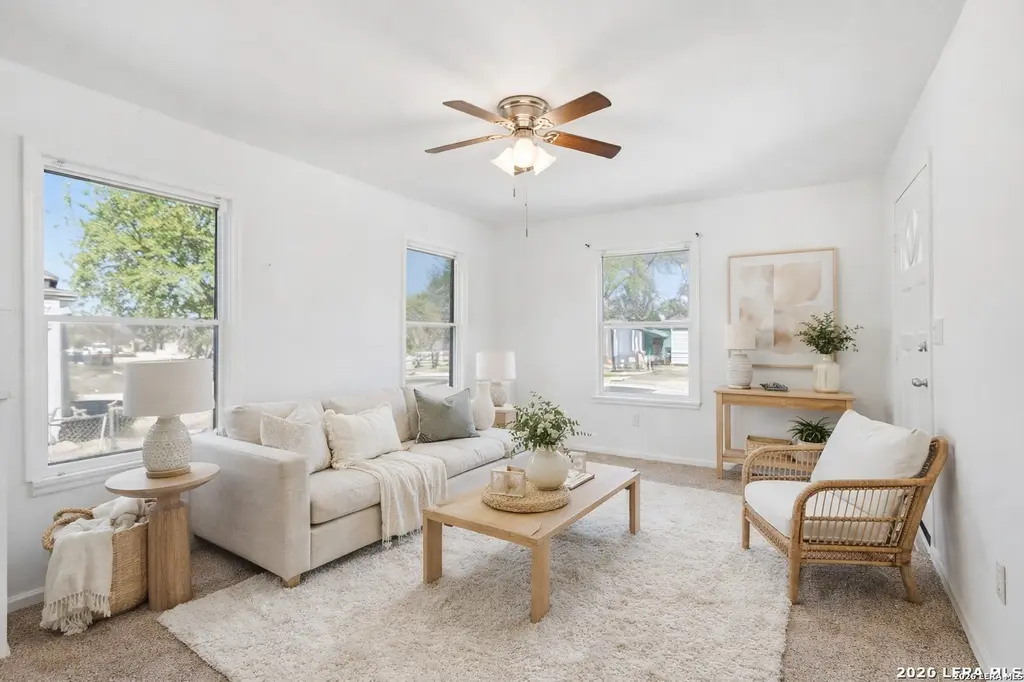
Located in the San Antonio ISD school district, 863 Cavalier offers a great opportunity for first-time homebuyers or investors. This home features a bright interior with natural light, and a functional layout that makes everyday living comfortable. With comfortable bedrooms and a dedicated dining space, the layout offers flexibility for families, roommates, or rental potential. Conveniently located near downtown San Antonio, schools, parks, shopping, dining, and major highways, this property combines location, affordability, and opportunity. Schedule a showing today.
Key facts
- 7,100 sq ft lot
- Built 1944
- Listed 97 days
Tags
Neighborhood map
What this means for you Summary
Snapshot
- This is a 2-bed/1.0-bath single-family listed at $120k.
Deal economics
- At list price, monthly cash flow is $14 ($173/yr) — positive.
- The deal already cash-flows at list — no discount required.
- To meet the 1% rule (rent ≥ 1% of price), the offer needs to be $116k (3.2% below list).
- Recommended offer: $109k (9.0% below list) — sets the bar for market timing.
- Cap rate 6.4% vs local median 3.8% in San Antonio — top-decile yield for the area; either an underpriced asset or a hidden risk that comps aren't pricing in. Stress-test before assuming the spread holds.
Location & tenants
- Location reads 80/100 on livability (#31 in TX, #1,616 nationally) — a professional / high-income tenant draw. Strengths: amenities A+, commute A+, cost of living A+; Watch: schools C-, crime F.
- San Antonio ISD (urban): math 12% / reading 22% proficiency, ranked #805 of 826 in TX (top 98%) — low school quality limits family demand, transient renter base, plan for 1-2y turnover; 80% free/reduced lunch — lower-income household profile, screen leases tightly.
- Market conditions: 36 active listings in the ZIP; 18 comparable units currently listed for rent nearby; rentals at typical pace (median 24d on market — plan ~3-4 weeks tenant-placement turnaround); 8,308 units permitted in Bexar County in 2024 (2,506 in 5+ unit buildings).
Forward outlook
- In year one you build about $5k of equity ($830 loan paydown + $5k appreciation (3.8% local appreciation)).
- Bexar County population projected at +50% by 2050 — long-run rental-demand tailwind backs the buy-and-hold thesis.
- At projected returns (3.8% appreciation + 3.0% rent growth), your $34k cash investment doubles in ~6 years — after that, you're playing with house money.
- By year 7, paydown + projected appreciation supports a ~$34k cash-out refi (75% LTV) — recoverable capital for the next deal without selling this one.
Negotiation context
- It's been on market 97 days — a 9% lower offer ($109k) is reasonable based on typical stale-listing flexibility.
Risks & watch-outs
- Watch-outs: built in 1944 — expect roof / HVAC / electrical / plumbing capex.
- Climate carrying-cost: major wind risk, 78% chance of damaging wind over 30y; extreme-heat days projected 7→20/yr by 2055 (HVAC capex compounding) — expect insurance premiums to compound above CPI over the hold.
Questions for the listing agent
- It's been on market 97 days. Have you received any prior offers? Is the seller open to a 9% concession, seller financing, or rate buy-down credit?
- Built in 1944 — when were the roof, HVAC, electrical panel, plumbing, and water heater last replaced?
- Why hasn't it sold? Are there any deal-killer items the seller is aware of (foundation, flood, title, zoning, code violations)?
- Is there a deadline driving the sale (1031 exchange, divorce, estate, relocation)? That informs how much negotiation room exists.
- Crime grade is F in this area — have there been break-ins, vandalism, or insurance claims at this property in the last 3 years? What carrier currently insures it and at what premium?
- What's the average days-on-market for RENTAL listings here right now (not sales)? A rising rental-DOM trend means longer vacancies and softer asking-rent achievability than the comps imply.
- What's the recent tenant-quality profile in this submarket — average credit score on applications, eviction rate, late-payment / NSF rate, and stable-employment percentage? A property-management company in the area should have these aggregated.
- How much new for-sale + rental construction is in the pipeline within 1–3 miles? Heavy new supply typically softens prices + rents 12–24 months out; constrained supply supports both.
Investment metrics
- 1% rule
- 0.97% ✗
- Cap rate
- 6.44%
- Cash-on-cash
- 0.52%
- DSCR
- 1.02
- GRM
- 8.6
CMA / ARV
- ARV (median comp)
- $137,642
- List price
- $120,000
- Delta
- -12.82%
- Verdict
- UNDERPRICED
- Comps
- 20 within 1.0 mi
Show comp detail 12 sales within ~0.75 mi
| Address | Dist | Beds/Ba | Sqft | Sold | Price | $/sf | Match |
|---|---|---|---|---|---|---|---|
| 539 Humble Ave | 0.14mi | 2/1.0 | 820 (+2%) | 12mo | $145,000 | $177 | 80 |
| 115 Elmo | 0.30mi | 2/1.0 | 816 (+1%) | 5mo | $99,550 | $122 | 80 |
| 834 Jennings | 0.10mi | 2/1.0 | 756 (-6%) | 8mo | $125,000 | $165 | 78 |
| 113 Ross | 0.40mi | 2/1.5 | 800 (-1%) | 10mo | $155,000 | $194 | 69 |
| 426 Royston | 0.38mi | 2/1.0 | 852 (+5%) | 5mo | $124,975 | $147 | 69 |
| 2215 Calle Estrella | 0.39mi | 3/1.0 (+1) | 840 (+4%) | 14mo | $130,000 | $155 | 58 |
| 347 Carroll St | 0.70mi | 2/1.0 | 792 (-2%) | 8mo | $106,000 | $134 | 58 |
| 418 Linares St | 0.40mi | 3/1.0 (+1) | 860 (+6%) | 13mo | $110,000 | $128 | 55 |
| 117 Ross | 0.40mi | 2/1.0 | 896 (+11%) | 13mo | $115,000 | $128 | 52 |
| 557 Barrett | 0.68mi | 2/1.0 | 748 (-7%) | 8mo | $129,900 | $174 | 49 |
| 1114 Sims Ave | 0.63mi | 2/1.0 | 875 (+8%) | 14mo | $150,000 | $171 | 45 |
| 351 Linares St | 0.47mi | 3/1.0 (+1) | 922 (+14%) | 15mo | $205,000 | $222 | 37 |
Match score weights: distance 35% · size 25% · config 20% · recency 20%. Top-matched comps best support the ARV.
Projected returns pro-forma
3.81% appreciation · 3.0% rent growth · sell at horizon
- IRR
- 10.2%
- Equity multiple
- 1.61×
- Total profit
- $20,645
- Equity at exit
- $59,496
- IRR
- 12.2%
- Equity multiple
- 2.97×
- Total profit
- $66,087
- Equity at exit
- $96,252
Cash invested: $33,600 (down + closing). Projections, not guarantees.
Landlord ↔ Tenant lean methodology
- Overall (STATE)
- 87 Strongly Landlord-Friendly
- State Texas
- 87 Strongly Landlord-Friendly · R+5
- County
- — inherits STATE
- City
- — inherits STATE
ZIP-level market 78225
- Home prices YoY
- 1.5%
- Active inventory
- 36
- Price-to-rent
- 8.6×
Monthly cashflow live
- Estimated rent
- $1,161 high interval (Pro) →
- Mortgage (P&I)
- −$629
- Tax from tax record
- −$224 /mo · $2,685/yr
- Insurance
- −$50
- HOA
- −$0
- Vacancy / Maint / Mgmt
- −$244
- Net cashflow
- $14
Break-even live
UW: 25.0% down · 7.5% · 30yr · 1.5% tax · 5.0% vac · 8.0% maint · 8.0% mgmt
Financing live
Cash to close
- Down payment
- $30,000
- Closing costs
- $3,600
- Reserves months
- —
- Total cash needed
- —
Loan-product check · same deal, 3 products live
Conventional
25% down · 7.5% · 30yr
- Down + closing
- —
- Monthly P&I
- —
- Monthly cashflow
- —
- DSCR
- —
- Eligible?
- —
Personal DTI + credit; lowest rate.
DSCR
20% down · 8.5% · 30yr
- Down + closing
- —
- Monthly P&I
- —
- Monthly cashflow
- —
- DSCR
- —
- Eligible?
- —
No personal income docs; deal must DSCR.
Hard money
10% down · 12.0% · 12mo
- Down + closing
- —
- Monthly P&I
- —
- Monthly cashflow
- —
- DSCR
- —
- Eligible?
- —
Short-term bridge; refi at stabilization.
Rent comps 18 comps
| Address | Beds | Baths | Sqft | Rent | $/sqft | DOM | Units | Dist |
|---|---|---|---|---|---|---|---|---|
| 515 Humble Ave San Antonio, TX | 1.0 | 1.0 | 700 | $810 | $1.16 | 43d | 1 | 0.12mi |
| 3103 Neptune St San Antonio, TX | 3.0 | 2.0 | 1008 | $1,350 | $1.34 | 43d | 1 | 0.37mi |
| 626 Kirk Pl San Antonio, TX | 2.0 | 1.0 | 912 | $1,100 | $1.21 | 20d | 1 | 0.70mi |
| 450 Taft Blvd San Antonio, TX | 3.0 | 1.0 | 883 | $1,295 | $1.47 | 43d | 1 | 0.81mi |
| 150 Hearne San Antonio, TX | 2.0 | 1.0 | 1044 | $1,400 | $1.34 | 24d | 1 | 0.81mi |
| 350 Barrett Pl San Antonio, TX | 2.0 | 1.0 | 616 | $1,225 | $1.99 | 4d | 1 | 0.90mi |
| 329 Taft Blvd San Antonio, TX | 2.0 | 2.0 | 862 | $2,200 | $2.55 | 1d | 1 | 0.97mi |
| 1202 Division Ave San Antonio, TX | 1.0 | 1.0 | 550 | $1,100 | $2.00 | 24d | 1 | 1.00mi |
| 843 Brady Blvd San Antonio, TX | 3.0 | 2.0 | 864 | $1,650 | $1.91 | 24d | 1 | 1.00mi |
| 2003 S Zarzamora St San Antonio, TX | 1.0–4.0 | 1.0–2.0 | 1028 | $1,120 | $1.09 | 24d | 1 | 1.20mi |
| 1222 Brighton Ave Unit B San Antonio, TX | 3.0 | 1.0 | 725 | $999 | $1.38 | 17d | 1 | 1.21mi |
| 1938 S Zarzamora St Unit 710 San Antonio, TX | 2.0 | 2.0 | 955 | $1,102 | $1.15 | 3d | 1 | 1.24mi |
| 1938 S Zarzamora St Unit 610 San Antonio, TX | 1.0 | 1.0 | 744 | $915 | $1.23 | 3d | 1 | 1.24mi |
| 834 Division Ave San Antonio, TX | 2.0 | 1.0 | 700 | $1,050 | $1.50 | 24d | 1 | 1.31mi |
| 834 Division Ave Unit 2 San Antonio, TX | 2.0 | 1.0 | 936 | $950 | $1.01 | 4d | 1 | 1.31mi |
| 416 Collingsworth Unit 2 San Antonio, TX | 2.0 | 1.0 | 570 | $1,100 | $1.93 | 43d | 1 | 1.33mi |
| 319 Noria St San Antonio, TX | 3.0 | 1.0 | 1002 | $1,100 | $1.10 | 24d | 1 | 1.35mi |
| 815 Ripford St San Antonio, TX | 2.0 | 1.0 | 728 | $1,300 | $1.79 | 4d | 1 | 1.39mi |
Listing history 20 events
-
2026-06-18days on market $120,000 Active 97 DOM
-
2026-06-17days on market $120,000 Active 96 DOM
-
2026-06-16days on market $120,000 Active 95 DOM
-
2026-06-15days on market $120,000 Active 94 DOM
-
2026-06-13days on market $120,000 Active 92 DOM
-
2026-06-09days on market $120,000 Active 88 DOM
-
2026-06-08days on market $120,000 Active 87 DOM
-
2026-06-07days on market $120,000 Active 86 DOM
-
2026-06-04days on market $120,000 Active 83 DOM
-
2026-06-03days on market $120,000 Active 82 DOM
-
2026-06-02days on market $120,000 Active 81 DOM
-
2026-06-01days on market $120,000 Active 80 DOM
-
2026-05-31days on market $120,000 Active 79 DOM
-
2026-05-15price $120,000 573-char remark
Show marketing remark (573 chars)
Located in the San Antonio ISD school district, 863 Cavalier offers a great opportunity for first-time homebuyers or investors. This home features a bright interior with natural light, and a functional layout that makes everyday living comfortable. With comfortable bedrooms and a dedicated dining space, the layout offers flexibility for families, roommates, or rental potential. Conveniently located near downtown San Antonio, schools, parks, shopping, dining, and major highways, this property combines location, affordability, and opportunity. Schedule a showing today.
-
2026-03-13$150,000 New 573-char remark
Show marketing remark (573 chars)
Located in the San Antonio ISD school district, 863 Cavalier offers a great opportunity for first-time homebuyers or investors. This home features a bright interior with natural light, and a functional layout that makes everyday living comfortable. With comfortable bedrooms and a dedicated dining space, the layout offers flexibility for families, roommates, or rental potential. Conveniently located near downtown San Antonio, schools, parks, shopping, dining, and major highways, this property combines location, affordability, and opportunity. Schedule a showing today.
-
2023-10-20soldstatus
-
2022-01-18soldstatus
-
2019-04-12soldstatus
-
2016-08-31soldstatus
-
2016-05-10soldstatus
ⓘ Source: listings_history table (triggers on properties + properties_extension) + one-shot
backfill from property_details.listing_events for pre-trigger history.
Tax reassessment forecast TX · Resets to sale price
- Current annual tax
- $2,685 · $224/mo
- Projected year-2 tax
- $2,685 · $224/mo
- Expected delta
- $0/yr ($0/mo · 0.0%)
ⓘ Screening estimate from a state-policy table — verify with the county assessor before closing.
Climate risk First Street
- Flood 1/10 Low FEMA zone X (unshaded) · 0% chance over 30 yrs
- Wildfire 1/10 Low
- Heat 8/10 Severe 7 d/yr ≥108°F today · 20 d/yr by 30 yrs out
- Wind 7/10 Severe 78% chance of damaging wind over 30 yrs
- Air quality 2/10 Low 1 unhealthy d/yr today · 2 by 30 yrs out
Nearby sold comps map
Loading sold comps map…
Walkable amenities ~0.75 mi
Loading nearby amenities…
Taxation est. · year 1
- Rental income
- $13,936
- − Mortgage interest
- −$6,722
- − Property taxes
- −$2,685
- − Insurance
- −$600
- − Repairs & maintenance
- −$1,115
- − Management
- −$1,115
- − Depreciation
- −$3,491
- Taxable loss
- −$1,791
- Est. tax savings @ 24.0%
- +$430
- After-tax cash flow
- $603/yr
For passive investors: Depreciation is non-cash, so a rental often shows a tax loss while cash-flowing — sheltering income. Rental losses are passive: they offset passive income freely, and up to $25,000/yr can offset ordinary (W-2) income if you actively participate and your MAGI is under $100k (phasing out to $0 by $150k); unused losses carry forward. On sale, claimed depreciation is recaptured at up to 25%, and gains may owe capital-gains tax (a 1031 exchange can defer both). Figures are a year-1 estimate at your 24.0% rate — not tax advice; consult a CPA.
Schools (NCES district)
- District
- San Antonio ISD
- NCES district ID
- 4838730
- Math proficiency
- 12% ▼ -21.00%
- Reading proficiency
- 22% ▼ -7.00%
- Median HH income
- $30,952
- Composite
- 13.57/100
- National rank
- #9512
- State rank
- #805 of 826 in TX
Livability — San Antonio
- Score
- 80/100
- State rank
- #31
- US rank
- #1616
Category grades
Schools grade is shown separately in the Schools card above.
Census & demographics
- Census place
- San Antonio, TX
- County
- Bexar County · 1,990,555 people
- City population
- 1,806,925
- Metro
- San Antonio-New Braunfels, TX
- Population (ZIP)
- 13,104
- Household income
- $46,955
- Rent vs Own
- Severe rent burden
- 381.0
Population outlook (Bexar County) Hauer SSP2
- Today (2025)
- 2,336,851 people
- By 2030
- 2,560,728 · +9.6%
- By 2040
- 3,020,569 · +29.3%
- By 2050
- 3,493,522 · +49.5%
- By 2075
- 4,668,459 · +99.8%
- By 2100
- 5,533,242 · +136.8%
Race, ethnicity, and origin ACS 2023
- Neighborhood character
- Predominantly Hispanic (91%)
- Race & ethnicity
- Hispanic / Latino 91% Two or more races 41% White 5% Black 4% Native American 3%
- Hispanic origin (detail)
- Mexican 85%
- Foreign-born
- 13% · Canada
- Languages at home
- 35% English-only · Spanish 65%
Political lean MEDSL · Bexar
- 2024 margin
- Lean D (+9.8) · D 54.3% · R 44.6% · Other 1.1%
- 2008→2024 swing
- +4.2pp toward D · 2008: 5.6pp · 2024: 9.8pp
- All cycles
- 2024: D+9.8 2020: D+18.2 2016: D+13.5 2012: D+4.6 2008: D+5.6
Not yet ingested
- Civics
- —
Market trends
- HPI YoY
- ▲ 3.81%
- Current HPI
- 264.2018
- Rent YoY
- —
- Metro
- San Antonio-New Braunfels, TX
- State GDP YoY
- ▲ 3.95%
- F500 in state
- 110
Industry mix (Fortune 500 HQ in TX)
| Industry | F500 HQs | Revenue |
|---|---|---|
| Energy | 16 | $1,198B |
|
||
| Technology | 5 | $198B |
|
||
| Engineering / Construction | 4 | $72B |
|
||
| Energy Services | 3 | $60B |
|
||
| Utilities | 3 | $41B |
|
||
| Healthcare | 2 | $330B |
|
||
Price history
-20.0% since first listed7 events — show timeline
- 2026-05-15 Price Changed $120,000 LERA
- 2026-03-13 Listed $150,000 LERA
- 2023-10-20 Sold (Public Records) — Public Records
- 2022-01-18 Sold (Public Records) — Public Records
- 2019-04-12 Sold (Public Records) — Public Records
- 2016-08-31 Sold (Public Records) — Public Records
- 2016-05-10 Sold (Public Records) — Public Records
Property tax history
+8.3%/yrLatest (2025): $2,685 · -3.5% YoY. Source: county tax records.
Cash-flow waterfall
monthlySold comps — $/sqft
last 12 mo · ≤1 miLoading sold comps…