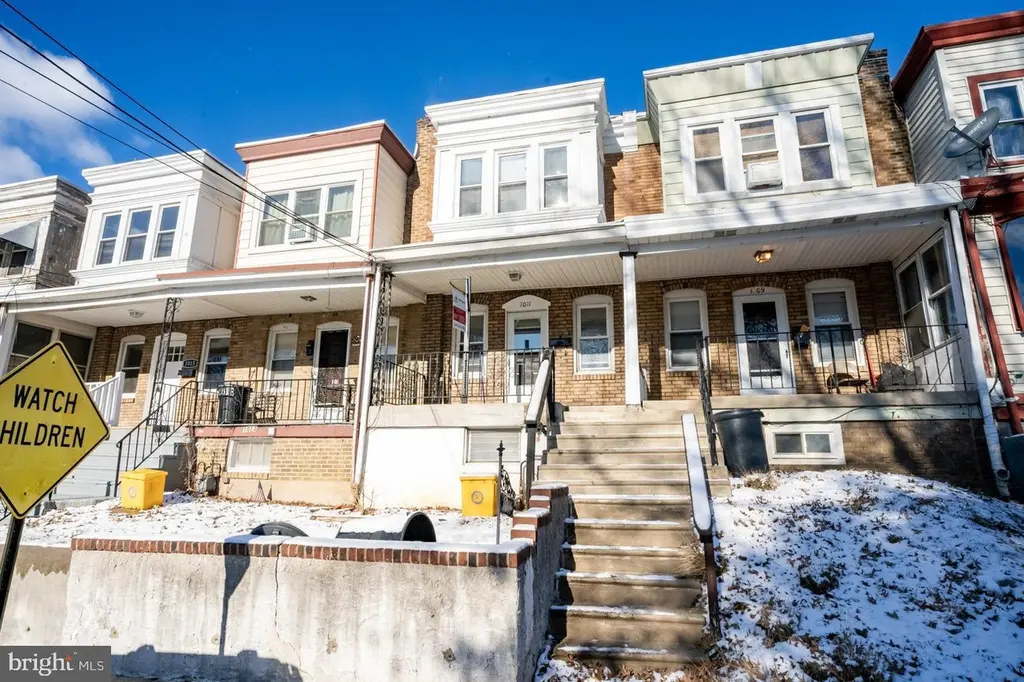
1011 Andrews Ave · Collingdale, PA
Flood risk 1/10 · Minimal
- FEMA flood zone
- X (unshaded)
- Chance of flooding over 30 yrs
- 0.0%
- Est. flood insurance / yr
- $473 – $860
Fire risk 1/10 · Minimal
- Est. fire insurance / yr
- $511 – $949
Heat risk 6/10 · Moderate
- Hot days now (above 103°F)
- 7 days/yr
- Hot days in 30 yrs
- 15 days/yr
Wind risk 6/10 · Moderate
- Chance of severe wind over 30 yrs
- 27.0%
Air-quality risk 4/10 · Minor
- Unhealthy air days now
- 3 days/yr
- Unhealthy air days in 30 yrs
- 6 days/yr
Risk factors via First Street. Map © Google.
Why this score? — see what drove the C grade
The composite is a weighted blend of 9 inputs, each scored 0–100. Each bar is that input's sub-score; the figure is the points it added to the 100-point composite (weight × sub-score).
- Cash flow +19.1/30.0
- ARV discount +15.0/15.0
- DSCR +6.0/10.0
- 1% rule +5.8/10.0
- Rent growth +5.0/5.0
- Livability +4.2/5.0
- Condition / age +2.5/5.0
- Schools +2.0/10.0
- Appreciation +0.0/10.0
$175,000
🖨 Deal sheet 📄 Offer letter ✓ Due diligence
Listing remarks MLS
This property is currently tenant-occupied and rents for $1650.00 per month. This tenant's lease runs from 4/3/2025 through 4/2/2026. Great opportunity for a first-time home buyer or an investor! This Collingdale home is conveniently situated near public transportation and Macdade Blvd for all your shopping needs. Plus, it offers easy access from the alley in the back. Buyer is responsible for obtaining the Use and Occupancy Certificate.
Key facts
- Built 1925
- Listed 105 days
Tags
Neighborhood map
What this means for you Summary
Snapshot
- This is a 3-bed/1.0-bath townhouse listed at $175k.
Deal economics
- At list price, monthly cash flow is $186 ($2k/yr) — positive.
- The deal already cash-flows at list — no discount required.
- Meets the 1% rule at list price ($2k rent vs $175k).
- Recommended offer: $159k (9.0% below list) — sets the bar for market timing.
- Cap rate 7.6% vs local median 6.0% in Collingdale — meaningfully above typical; check what's discounted (condition, days-on-market, listing class) to confirm the premium yield is real.
Location & tenants
- Location reads 84/100 on livability (#105 in PA, #781 nationally) — a professional / high-income tenant draw. Strengths: commute A+, cost of living A+, housing A+; Watch: employment C-, amenities D.
- Southeast Delco SD (suburban): math 13% / reading 33% proficiency, ranked #478 of 539 in PA (top 89%) — low school quality limits family demand, transient renter base, plan for 1-2y turnover; 63% free/reduced lunch — lower-income household profile, screen leases tightly.
- Market conditions: Rents rising fast (+13.1%/yr); 99 active listings in the ZIP; 40 comparable units currently listed for rent nearby; rentals at typical pace (median 25d on market — plan ~3-4 weeks tenant-placement turnaround); 299 units permitted in Delaware County in 2024 (5 in 5+ unit buildings).
- At $1,882/mo this rent would consume 49% of the median local household income ($46k/yr) (locally 1468% of renters already pay >50% of income on rent) — very limited rent-growth headroom before tenants either downsize or default.
Forward outlook
- Local home prices are declining (-3.0%/yr); year-one equity from $1k of loan paydown is wiped out by about $5k of value loss. Plan a longer hold.
- At projected returns (-3.0% appreciation + 8.0% rent growth), your $49k cash investment doubles in ~9 years — after that, you're playing with house money.
Negotiation context
- It's been on market 106 days — a 9% lower offer ($159k) is reasonable based on typical stale-listing flexibility.
- 5 sale attempts since 9y ago with the ask held roughly flat each time — persistent listings suggest the price (not the market) is what's stuck; bring a comps-based counter.
- Current owner paid $40k; list at $175k implies a 339% gain — meaningful room to come down on a strong offer.
Risks & watch-outs
- Watch-outs: built in 1925 — expect roof / HVAC / electrical / plumbing capex.
- Climate carrying-cost: major wind risk, 27% chance of damaging wind over 30y; extreme-heat days projected 7→15/yr by 2055 (HVAC capex compounding) — expect insurance premiums to compound above CPI over the hold.
Questions for the listing agent
- It's been on market 106 days. Have you received any prior offers? Is the seller open to a 9% concession, seller financing, or rate buy-down credit?
- Built in 1925 — when were the roof, HVAC, electrical panel, plumbing, and water heater last replaced?
- Why hasn't it sold? Are there any deal-killer items the seller is aware of (foundation, flood, title, zoning, code violations)?
- Is there a deadline driving the sale (1031 exchange, divorce, estate, relocation)? That informs how much negotiation room exists.
- What's the average days-on-market for RENTAL listings here right now (not sales)? A rising rental-DOM trend means longer vacancies and softer asking-rent achievability than the comps imply.
- What's the recent tenant-quality profile in this submarket — average credit score on applications, eviction rate, late-payment / NSF rate, and stable-employment percentage? A property-management company in the area should have these aggregated.
- How much new for-sale + rental construction is in the pipeline within 1–3 miles? Heavy new supply typically softens prices + rents 12–24 months out; constrained supply supports both.
Investment metrics
- 1% rule
- 1.08% ✓
- Cap rate
- 7.57%
- Cash-on-cash
- 4.56%
- DSCR
- 1.20
- GRM
- 7.8
CMA / ARV
- ARV (median comp)
- $212,178
- List price
- $175,000
- Delta
- -17.52%
- Verdict
- UNDERPRICED
- Comps
- 20 within 1.0 mi
Show comp detail 12 sales within ~0.75 mi
| Address | Dist | Beds/Ba | Sqft | Sold | Price | $/sf | Match |
|---|---|---|---|---|---|---|---|
| 306 Pine St | 0.48mi | 3/2.0 | 1,120 (+2%) | 0mo | $259,000 | $231 | 70 |
| 118 Juliana Ter | 0.39mi | 3/1.0 | 1,020 (-7%) | 2mo | $145,000 | $142 | 69 |
| 304 Pine St | 0.48mi | 3/2.0 | 1,120 (+2%) | 2mo | $250,000 | $223 | 68 |
| 614 Rively Ave | 0.59mi | 3/1.0 | 1,152 (+5%) | 1mo | $255,000 | $221 | 64 |
| 520 Rively Ave | 0.58mi | 3/1.0 | 1,152 (+5%) | 3mo | $245,000 | $213 | 62 |
| 622 Magnolia Ave | 0.69mi | 3/1.5 | 1,120 (+2%) | 3mo | $255,000 | $228 | 60 |
| 71 Burnside Ave | 0.50mi | 3/1.0 | 1,240 (+13%) | 3mo | $95,001 | $77 | 52 |
| 412 Pusey Ave | 0.67mi | 3/1.0 | 1,202 (+10%) | 1mo | $245,000 | $204 | 52 |
| 419 Custer Ave | 0.71mi | 3/2.0 | 1,178 (+8%) | 2mo | $219,900 | $187 | 48 |
| 5 S Wells Ave | 0.70mi | 3/1.5 | 1,210 (+10%) | 2mo | $245,000 | $202 | 46 |
| 216 Ridley Ave | 0.68mi | 3/2.0 | 1,248 (+14%) | 1mo | $296,694 | $238 | 40 |
| 401 Custer Ave | 0.72mi | 3/1.0 | 1,255 (+14%) | 3mo | $290,000 | $231 | 40 |
Match score weights: distance 35% · size 25% · config 20% · recency 20%. Top-matched comps best support the ARV.
Projected returns pro-forma
-3.0% appreciation · 8.0% rent growth · sell at horizon
- IRR
- -3.3%
- Equity multiple
- 0.87×
- Total profit
- $-6,470
- Equity at exit
- $26,093
- IRR
- 11.5%
- Equity multiple
- 2.13×
- Total profit
- $55,238
- Equity at exit
- $15,131
Cash invested: $49,000 (down + closing). Projections, not guarantees.
Landlord ↔ Tenant lean methodology
- Overall (STATE)
- 62 Landlord-Friendly
- State Pennsylvania
- 62 Landlord-Friendly · EVEN
- County
- — inherits STATE
- City
- — inherits STATE
ZIP-level market 19023
- Rents YoY
- 13.1%
- Active inventory
- 99
- Price-to-rent
- 7.8×
Monthly cashflow live
- Estimated rent
- $1,882 high interval (Pro) →
- Mortgage (P&I)
- −$918
- Tax from tax record
- −$310 /mo · $3,715/yr
- Insurance
- −$73
- HOA
- −$0
- Vacancy / Maint / Mgmt
- −$395
- Net cashflow
- $186
Break-even live
UW: 25.0% down · 7.5% · 30yr · 1.5% tax · 5.0% vac · 8.0% maint · 8.0% mgmt
Financing live
Cash to close
- Down payment
- $43,750
- Closing costs
- $5,250
- Reserves months
- —
- Total cash needed
- —
Loan-product check · same deal, 3 products live
Conventional
25% down · 7.5% · 30yr
- Down + closing
- —
- Monthly P&I
- —
- Monthly cashflow
- —
- DSCR
- —
- Eligible?
- —
Personal DTI + credit; lowest rate.
DSCR
20% down · 8.5% · 30yr
- Down + closing
- —
- Monthly P&I
- —
- Monthly cashflow
- —
- DSCR
- —
- Eligible?
- —
No personal income docs; deal must DSCR.
Hard money
10% down · 12.0% · 12mo
- Down + closing
- —
- Monthly P&I
- —
- Monthly cashflow
- —
- DSCR
- —
- Eligible?
- —
Short-term bridge; refi at stabilization.
Rent comps 40 comps
| Address | Beds | Baths | Sqft | Rent | $/sqft | DOM | Units | Dist |
|---|---|---|---|---|---|---|---|---|
| 66 Folcroft Ave Folcroft, PA | 3.0 | 1.0 | 1224 | $1,895 | $1.55 | 3d | 1 | 0.40mi |
| 112 Juliana Ter Darby, PA | 3.0 | 1.0 | 1020 | $2,350 | $2.30 | 44d | 1 | 0.43mi |
| 112 Juliana Ter Darby, PA | 3.0 | 1.0 | 1020 | $2,450 | $2.40 | 24d | 1 | 0.43mi |
| 1201 Bartram Ave Darby, PA | 2.0 | 1.0 | 700 | $1,350 | $1.93 | 11d | 1 | 0.44mi |
| 118 Felton Ave Darby, PA | 3.0 | 1.0 | 1152 | $1,750 | $1.52 | 22d | 1 | 0.46mi |
| 304 Pine St Glenolden, PA | 3.0 | 2.0 | 1120 | $2,400 | $2.14 | 43d | 1 | 0.48mi |
| 306 Pine St Glenolden, PA | 3.0 | 2.0 | 1120 | $2,400 | $2.14 | 4d | 1 | 0.48mi |
| 132 Folcroft Ave Folcroft, PA | 2.0 | 1.0 | 725 | $1,679 | $2.32 | 2d | 3 | 0.54mi |
| 1074 N Academy Ave Glenolden, PA | 3.0 | 1.0 | 1152 | $1,850 | $1.61 | 5d | 1 | 0.60mi |
| 100 S Oak Ave Glenolden, PA | 1.0–2.0 | 1.0–2.0 | 830 | $1,500 | $1.81 | 24d | 3 | 0.69mi |
| 1512 Elmwood Ave Folcroft, PA | 2.0 | 1.0 | 850 | $1,499 | $1.76 | 24d | 1 | 0.77mi |
| 145 Isabel Ave Unit 145B Glenolden, PA | 2.0 | 1.0 | 890 | $1,525 | $1.71 | 43d | 1 | 0.78mi |
| 1505 Elmwood Ave Unit 5 Folcroft, PA | 2.0 | 1.0 | 850 | $1,499 | $1.76 | 24d | 1 | 0.79mi |
| 902 Maple Ave Glenolden, PA | 3.0 | 1.0 | 1152 | $1,745 | $1.51 | 43d | 1 | 0.79mi |
| 1503 Elmwood Ave Folcroft, PA | 3.0 | 1.0 | 850 | $1,799 | $2.12 | 43d | 1 | 0.80mi |
| 1503 Elmwood Ave Folcroft, PA | 3.0 | 1.0 | 1025 | $1,699 | $1.66 | 24d | 1 | 0.80mi |
| 1513 Elmwood Ave Unit 5 Folcroft, PA | 3.0 | 1.0 | 850 | $1,799 | $2.12 | 43d | 1 | 0.80mi |
| 1513 Elmwood Ave Unit 4 Folcroft, PA | 3.0 | 1.0 | 1025 | $1,699 | $1.66 | 24d | 1 | 0.80mi |
| 925 Maple Ave Glenolden, PA | 3.0 | 2.0 | 1152 | $2,800 | $2.43 | 22d | 1 | 0.80mi |
| 1511 Elmwood Ave Folcroft, PA | 1.0–3.0 | 1.0 | 725 | $1,649 | $2.27 | 24d | 3 | 0.80mi |
| 29 Logan Ave Unit 11 Glenolden, PA | 2.0 | 1.0 | 850 | $1,350 | $1.59 | 24d | 1 | 0.88mi |
| 201 Westbridge Rd Glenolden, PA | 3.0 | 1.5 | 1224 | $2,350 | $1.92 | 24d | 1 | 0.92mi |
| 2 Winthrop Rd Darby, PA | 3.0 | 1.5 | 1224 | $1,900 | $1.55 | 22d | 1 | 0.94mi |
| 926 Green Ln Secane, PA | 2.0 | 1.0 | 862 | $2,185 | $2.53 | 43d | 1 | 0.95mi |
| 820 Greenhill Rd Sharon Hill, PA | 4.0 | 2.0 | 1184 | $2,600 | $2.20 | 5d | 1 | 1.05mi |
| 601 Poplar St Sharon Hill, PA | 1.0–2.0 | 1.0 | 787 | $1,599 | $2.03 | 15d | 5 | 1.06mi |
| 350 S Scott Ave Unit 1 Glenolden, PA | 2.0 | 1.0 | 715 | $1,700 | $2.38 | 24d | 1 | 1.14mi |
| 909 Springfield Rd Unit D Darby, PA | 4.0 | 1.0 | 900 | $1,600 | $1.78 | 43d | 1 | 1.15mi |
| 1 Jefferson St Unit 413D Clifton Heights, PA | 3.0 | 1.0 | 800 | $1,529 | $1.91 | 43d | 1 | 1.18mi |
| 209 Hamilton Ave Darby, PA | 4.0 | 1.0 | 1400 | $1,595 | $1.14 | 15d | 1 | 1.19mi |
| 100 E Glenolden Ave Glenolden, PA | 1.0–4.0 | 1.0–2.0 | 920 | $2,167 | $2.36 | 1d | 4 | 1.21mi |
| 1300 Main St Unit Basement Darby, PA | 2.0 | 1.0 | 800 | $1,450 | $1.81 | 11d | 1 | 1.23mi |
| 1300 Main St Unit Basement Darby, PA | 2.0 | 1.0 | 1000 | $1,450 | $1.45 | 24d | 1 | 1.23mi |
| 319 S Church St Clifton Heights, PA | 3.0 | 1.0 | 1152 | $1,900 | $1.65 | 43d | 1 | 1.24mi |
| 432 S Chester Pike Glenolden, PA | 2.0 | 1.0 | 792 | $1,325 | $1.67 | 44d | 1 | 1.25mi |
| 304 Christopher Pl Unit 1st Floor Primos, PA | 2.0 | 1.0 | 875 | $1,400 | $1.60 | 3d | 1 | 1.25mi |
| 137 W Maryland Ave Unit 2nd Flr Aldan, PA | 2.0 | 1.0 | 800 | $1,400 | $1.75 | 5d | 1 | 1.27mi |
| 640 South Ave Secane, PA | 1.0–2.0 | 1.0–1.5 | 742 | $1,600 | $2.16 | 12d | 5 | 1.27mi |
| 216 Borough Rd Unit A Primos, PA | 2.0 | 2.0 | 800 | $1,500 | $1.88 | 24d | 1 | 1.28mi |
| 96 E Berkley Ave Clifton Heights, PA | 2.0 | 1.5 | 1352 | $1,850 | $1.37 | 18d | 1 | 1.28mi |
Listing history 32 events
-
2026-06-18days on market $175,000 Active 106 DOM
-
2026-06-17days on market $175,000 Active 105 DOM
-
2026-06-16days on market $175,000 Active 104 DOM
-
2026-06-15days on market $175,000 Active 103 DOM
-
2026-06-13days on market $175,000 Active 101 DOM
-
2026-06-13days on market $175,000 Active 100 DOM
-
2026-06-09days on market $175,000 Active 97 DOM
-
2026-06-08days on market $175,000 Active 96 DOM
-
2026-06-07days on market $175,000 Active 95 DOM
-
2026-06-04days on market $175,000 Active 92 DOM
-
2026-06-03days on market $175,000 Active 91 DOM
-
2026-06-02days on market $175,000 Active 90 DOM
-
2026-06-01days on market $175,000 Active 89 DOM
-
2026-05-31days on market $175,000 Active 88 DOM
-
2026-03-04$175,000 Active 441-char remark
Show marketing remark (441 chars)
This property is currently tenant-occupied and rents for $1650.00 per month. This tenant's lease runs from 4/3/2025 through 4/2/2026. Great opportunity for a first-time home buyer or an investor! This Collingdale home is conveniently situated near public transportation and Macdade Blvd for all your shopping needs. Plus, it offers easy access from the alley in the back. Buyer is responsible for obtaining the Use and Occupancy Certificate.
-
2025-12-30historical
-
2025-11-01price $170,000
-
2025-07-15price $175,000
-
2025-05-31$180,000 Active
-
2025-03-21historical
-
2024-09-26price $180,000
-
2024-08-28price $190,000
-
2024-08-07price $200,000
-
2024-07-16price $210,000
-
2024-07-15$190,000 Active
-
2022-03-16price $1,400
-
2017-05-18soldstatus $39,900
-
2017-05-12soldstatus $39,900 Sold
-
2017-05-12soldstatus $39,900
-
2017-03-09status Under Contract
-
2017-02-25$39,900 Active
-
2017-02-16$39,900
ⓘ Source: listings_history table (triggers on properties + properties_extension) + one-shot
backfill from property_details.listing_events for pre-trigger history.
Tax reassessment forecast PA · Partial reset (capped growth)
- Current annual tax
- $3,715 · $310/mo
- Projected year-2 tax
- $3,715 · $310/mo
- Expected delta
- $0/yr ($0/mo · 0.0%)
ⓘ Screening estimate from a state-policy table — verify with the county assessor before closing.
Climate risk First Street
- Flood 1/10 Low FEMA zone X (unshaded) · 0% chance over 30 yrs
- Wildfire 1/10 Low
- Heat 6/10 Major 7 d/yr ≥103°F today · 15 d/yr by 30 yrs out
- Wind 6/10 Major 27% chance of damaging wind over 30 yrs
- Air quality 4/10 Moderate 3 unhealthy d/yr today · 6 by 30 yrs out
Nearby sold comps map
Loading sold comps map…
Walkable amenities ~0.75 mi
Loading nearby amenities…
Taxation est. · year 1
- Rental income
- $22,579
- − Mortgage interest
- −$9,803
- − Property taxes
- −$3,715
- − Insurance
- −$875
- − Repairs & maintenance
- −$1,806
- − Management
- −$1,806
- − Depreciation
- −$5,091
- Taxable loss
- −$518
- Est. tax savings @ 24.0%
- +$124
- After-tax cash flow
- $2,359/yr
For passive investors: Depreciation is non-cash, so a rental often shows a tax loss while cash-flowing — sheltering income. Rental losses are passive: they offset passive income freely, and up to $25,000/yr can offset ordinary (W-2) income if you actively participate and your MAGI is under $100k (phasing out to $0 by $150k); unused losses carry forward. On sale, claimed depreciation is recaptured at up to 25%, and gains may owe capital-gains tax (a 1031 exchange can defer both). Figures are a year-1 estimate at your 24.0% rate — not tax advice; consult a CPA.
Schools (NCES district)
- District
- Southeast Delco SD
- NCES district ID
- 4222400
- Math proficiency
- 13% ▼ -8.00%
- Reading proficiency
- 33% ▼ -9.00%
- Median HH income
- $49,309
- Composite
- 20.25/100
- National rank
- #8623
- State rank
- #478 of 539 in PA
Livability — Collingdale
- Score
- 84/100
- State rank
- #105
- US rank
- #781
Category grades
Schools grade is shown separately in the Schools card above.
Census & demographics
- Census place
- Collingdale, PA
- County
- Delaware County · 399,863 people
- City population
- 22,247
- Metro
- Philadelphia-Camden-Wilmington, PA-NJ-DE-MD
- Population (ZIP)
- 22,247
- Household income
- $46,463
- Rent vs Own
- Severe rent burden
- 1468.0
Population outlook (Delaware County) Hauer SSP2
- Today (2025)
- 577,490 people
- By 2030
- 581,243 · +0.6%
- By 2040
- 584,700 · +1.2%
- By 2050
- 586,581 · +1.6%
- By 2075
- 598,706 · +3.7%
- By 2100
- 590,823 · +2.3%
Race, ethnicity, and origin ACS 2023
- Neighborhood character
- Predominantly Black (76%)
- Race & ethnicity
- Black 76% White 15% Two or more races 5% Hispanic / Latino 3% Asian 2%
- Common ancestry
- Swiss 5% Hispanic 1% Romanian 1%
- Foreign-born
- 18% · Canada
- Languages at home
- 84% English-only · French/Haitian/Cajun 4% Spanish 3% Other Asian/Pacific 1%
Political lean MEDSL · Delaware
- 2024 margin
- Strong D (+23.7) · D 61.4% · R 37.6% · Other 1.0%
- 2008→2024 swing
- +2.3pp toward D · 2008: 21.4pp · 2024: 23.7pp
- All cycles
- 2024: D+23.7 2020: D+26.7 2016: D+22.0 2012: D+21.8 2008: D+21.4
Not yet ingested
- Civics
- —
Market trends
- HPI YoY
- ▼ -190.50%
- Current HPI
- 277.7034
- Rent YoY
- ▲ 13.10%
- Metro
- Philadelphia-Camden-Wilmington, PA-NJ-DE-MD
- State GDP YoY
- ▲ 1.68%
- F500 in state
- 34
Industry mix (Fortune 500 HQ in PA)
| Industry | F500 HQs | Revenue |
|---|---|---|
| Healthcare | 2 | $309B |
|
||
| Insurance | 2 | $27B |
|
||
| Telecommunications / Media | 1 | $124B |
|
||
| Industrial Distribution | 1 | $22B |
|
||
| Financial Services | 1 | $20B |
|
||
| Chemicals / Materials | 1 | $18B |
|
||
Price history
+338.6% since first listed18 events — show timeline
- 2026-03-04 Listed $175,000 BRIGHT MLS
- 2025-12-30 Listing Removed — BRIGHT MLS
- 2025-11-01 Price Changed $170,000 BRIGHT MLS
- 2025-07-15 Price Changed $175,000 BRIGHT MLS
- 2025-05-31 Listed $180,000 BRIGHT MLS
- 2025-03-21 Listing Removed — BRIGHT MLS
- 2024-09-26 Price Changed $180,000 BRIGHT MLS
- 2024-08-28 Price Changed $190,000 BRIGHT MLS
- 2024-08-07 Price Changed $200,000 BRIGHT MLS
- 2024-07-16 Price Changed $210,000 BRIGHT MLS
- 2024-07-15 Listed $190,000 BRIGHT MLS
- 2022-03-16 Price Changed $1,400 RENT.
- 2017-05-18 Sold (Public Records) $39,900 Public Records
- 2017-05-12 Sold (MLS) $39,900 BRIGHT MLS
- 2017-05-12 Sold (MLS) $39,900 TREND
- 2017-03-09 Pending — TREND
- 2017-02-25 Listed $39,900 TREND
- 2017-02-16 Listed $39,900 BRIGHT MLS
Property tax history
+2.3%/yrLatest (2026): $3,715 · -5.9% YoY. Source: county tax records.
Cash-flow waterfall
monthlySold comps — $/sqft
last 12 mo · ≤1 miLoading sold comps…