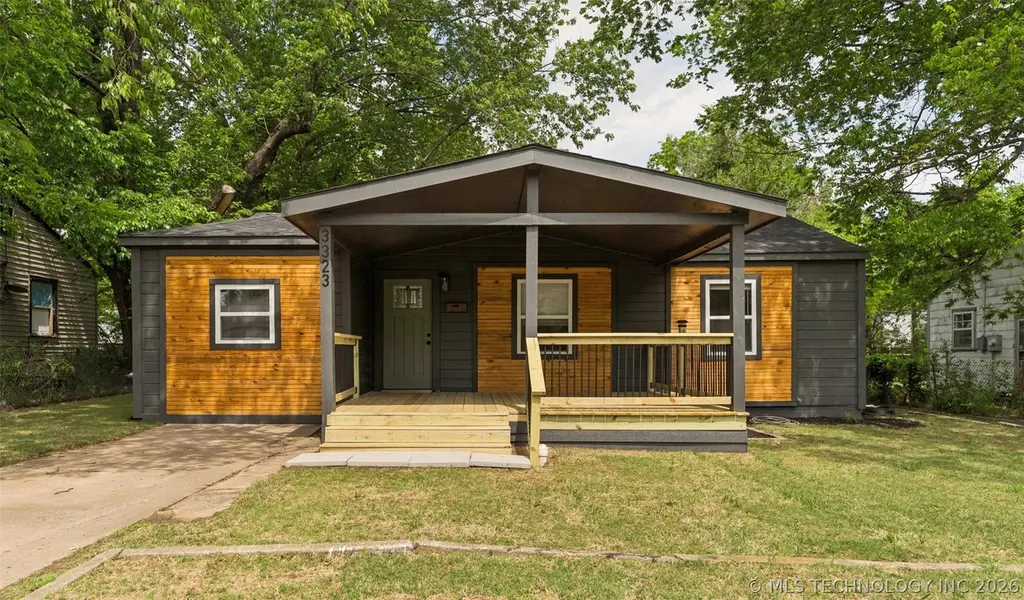
3323 E Xyler St · Tulsa, OK
Flood risk 1/10 · Minimal
- FEMA flood zone
- X (unshaded)
- Chance of flooding over 30 yrs
- 0.0%
- Est. flood insurance / yr
- $507 – $1,088
Fire risk 1/10 · Minimal
- Est. fire insurance / yr
- $2,463 – $4,575
Heat risk 6/10 · Moderate
- Hot days now (above 110°F)
- 7 days/yr
- Hot days in 30 yrs
- 18 days/yr
Wind risk 2/10 · Minimal
- Chance of severe wind over 30 yrs
- 4.0%
Air-quality risk 3/10 · Minor
- Unhealthy air days now
- 2 days/yr
- Unhealthy air days in 30 yrs
- 3 days/yr
Risk factors via First Street. Map © Google.
Why this score? — see what drove the D grade
The composite is a weighted blend of 9 inputs, each scored 0–100. Each bar is that input's sub-score; the figure is the points it added to the 100-point composite (weight × sub-score).
- Cash flow +16.6/30.0
- ARV discount +7.5/15.0
- DSCR +5.2/10.0
- Livability +3.8/5.0
- Rent growth +3.6/5.0
- 1% rule +3.4/10.0
- Condition / age +2.5/5.0
- Schools +0.8/10.0
- Appreciation +0.0/10.0
$139,900
🖨 Deal sheet (PDF) 📄 Offer letter ✓ Due diligence
Listing remarks MLS
PC1334 NEAT & CLEAN 2 BDRM W/ FENCED FRONT & BACK, NEWER WINDOW UNIT, STORM WINDOWS, STOVE & REFRIGERATOR STAY. EAT IN KITCHEN, BOTH BEDROOMS ARE GOOD SIZE - VACANT - GO SHOW
Key facts
- New hvac
- New flooring
- Fresh interior paint
Tags
Neighborhood map
What this means for you Summary
Snapshot
- This is a 3-bed/1.0-bath single-family listed at $140k.
Deal economics
- At list price, monthly cash flow is $85 ($1k/yr) — positive.
- The deal already cash-flows at list — no discount required.
- To meet the 1% rule (rent ≥ 1% of price), the offer needs to be $118k (15.8% below list).
- Recommended offer: $118k (15.8% below list) — sets the bar for 1% rule.
- Cap rate 7.0% vs local median 3.8% in Tulsa — top-decile yield for the area; either an underpriced asset or a hidden risk that comps aren't pricing in. Stress-test before assuming the spread holds.
Location & tenants
- Location reads 75/100 on livability (#13 in OK, #4,058 nationally) — a middle-class / working-renter tenant base. Strengths: amenities A+, commute A+, cost of living A+; Watch: crime F, employment D-.
- Tulsa (urban): math 7% / reading 12% proficiency, ranked #250 of 270 in OK (top 93%) — low school quality limits family demand, transient renter base, plan for 1-2y turnover; 76% free/reduced lunch — lower-income household profile, screen leases tightly.
- Zoned schools: Project Accept Traice Es (math 10% / reading 10%, grade F, #695 of 845 statewide, top 84%, 558 students, 0% FRL); Monroe Demonstration Ms (math 0% / reading 2%, grade F, #344 of 345 statewide, top 100%, 688 students, 0% FRL); Booker T. Washington Hs (math 41% / reading 61%, grade D+, #2 of 447 statewide, top 0%, 1,280 students, 0% FRL) — zoned schools average 0% FRL vs 76% district-wide (76 pts lower); this property's tenant base skews higher-income than the district average.
- Market conditions: Rents rising fast (+4.6%/yr); 89 active listings in the ZIP; 10 comparable units currently listed for rent nearby; rentals at typical pace (median 26d on market — plan ~3-4 weeks tenant-placement turnaround); lower-income renter base — watch delinquency; 2,818 units permitted in Tulsa County in 2024 (518 in 5+ unit buildings).
- This rent runs 32% of the median local income ($45k/yr) — at the standard rent-burdened threshold; future hikes will face affordability resistance.
Forward outlook
- Local home prices are declining (-3.0%/yr); year-one equity from $967 of loan paydown is wiped out by about $4k of value loss. Plan a longer hold.
- Tulsa County population projected at +30% by 2050 — long-run rental-demand tailwind backs the buy-and-hold thesis.
Negotiation context
- Only 2 days on market — expect competitive offers; lowballing is unlikely to land.
- 2 sale attempts since 26y ago with the ask held roughly flat each time — persistent listings suggest the price (not the market) is what's stuck; bring a comps-based counter.
- Current owner paid $26k; list at $140k implies a 438% gain — meaningful room to come down on a strong offer.
Risks & watch-outs
- Watch-outs: built in 1950 — expect roof / HVAC / electrical / plumbing capex.
- Climate carrying-cost: extreme-heat days projected 7→18/yr by 2055 (HVAC capex compounding) — expect insurance premiums to compound above CPI over the hold.
Questions for the listing agent
- Built in 1950 — when were the roof, HVAC, electrical panel, plumbing, and water heater last replaced?
- Is there a deadline driving the sale (1031 exchange, divorce, estate, relocation)? That informs how much negotiation room exists.
- Schools are F-rated, which usually means shorter tenancies and higher turnover. Who's the typical renter profile here, and what's been the actual vacancy rate?
- Crime grade is F in this area — have there been break-ins, vandalism, or insurance claims at this property in the last 3 years? What carrier currently insures it and at what premium?
- The area grade is low — what's the realistic commute time and amenity access for the typical tenant pool here? Any planned neighborhood developments (good or bad) we should know about?
- What's the average days-on-market for RENTAL listings here right now (not sales)? A rising rental-DOM trend means longer vacancies and softer asking-rent achievability than the comps imply.
- What's the recent tenant-quality profile in this submarket — average credit score on applications, eviction rate, late-payment / NSF rate, and stable-employment percentage? A property-management company in the area should have these aggregated.
- How much new for-sale + rental construction is in the pipeline within 1–3 miles? Heavy new supply typically softens prices + rents 12–24 months out; constrained supply supports both.
Investment metrics
- 1% rule
- 0.84% ✗
- Cap rate
- 7.02%
- Cash-on-cash
- 2.59%
- DSCR
- 1.12
- GRM
- 9.9
CMA / ARV
- ARV (on-the-fly)
- $92,964
- Comps found
- 12
Show comp detail 12 sales within ~0.75 mi
| Address | Dist | Beds/Ba | Sqft | Sold | Price | $/sf | Match |
|---|---|---|---|---|---|---|---|
| 3546 E Xyler St | 0.18mi | 3/1.0 | 864 (+13%) | 8mo | $56,000 | $65 | 63 |
| 2211 N Knoxville Ave | 0.20mi | 3/1.0 | 864 (+13%) | 7mo | $105,000 | $122 | 62 |
| 1942 N Florence Ave | 0.42mi | 2/1.0 (-1) | 780 (+2%) | 16mo | $119,000 | $153 | 58 |
| 3343 E Virgin Pl | 0.19mi | 2/1.0 (-1) | 822 (+8%) | 19mo | $70,000 | $85 | 57 |
| 1820 N Oswego Ave | 0.54mi | 3/1.0 | 864 (+13%) | 4mo | $138,000 | $160 | 49 |
| 2918 E Woodrow St | 0.43mi | 2/1.0 (-1) | 876 (+15%) | 2mo | $62,500 | $71 | 49 |
| 1804 N Louisville Ave | 0.49mi | 3/1.0 | 840 (+10%) | 17mo | $84,000 | $100 | 46 |
| 1830 N New Haven Ave | 0.49mi | 2/1.0 (-1) | 840 (+10%) | 13mo | $155,000 | $185 | 44 |
| 1576 N Knoxville Ave | 0.54mi | 2/1.0 (-1) | 816 (+7%) | 17mo | $90,000 | $110 | 44 |
| 4220 E Young Pl | 0.59mi | 2/1.0 (-1) | 864 (+13%) | 4mo | $78,900 | $91 | 42 |
| 3913 E Xyler St | 0.37mi | 2/1.0 (-1) | 860 (+13%) | 20mo | $105,000 | $122 | 40 |
| 1526 N Oswego Ave | 0.72mi | 2/1.0 (-1) | 840 (+10%) | 16mo | $133,500 | $159 | 31 |
Match score weights: distance 35% · size 25% · config 20% · recency 20%. Top-matched comps best support the ARV.
Projected returns pro-forma
-3.0% appreciation · 4.57% rent growth · sell at horizon
- IRR
- -10.7%
- Equity multiple
- 0.61×
- Total profit
- $-15,447
- Equity at exit
- $20,860
- IRR
- 0.4%
- Equity multiple
- 1.03×
- Total profit
- $1,271
- Equity at exit
- $12,096
Cash invested: $39,172 (down + closing). Projections, not guarantees.
Landlord ↔ Tenant lean methodology
- Overall (STATE)
- 83 Strongly Landlord-Friendly
- State Oklahoma
- 83 Strongly Landlord-Friendly · R+20
- County
- — inherits STATE
- City
- — inherits STATE
ZIP-level market 74115
- Home prices YoY
- -9.7%
- Rents YoY
- 4.6%
- Active inventory
- 89
- Price-to-rent
- 9.9×
Monthly cashflow live
- Estimated rent
- $1,179 high interval (Pro) →
- Mortgage (P&I)
- −$734
- Tax from tax record
- −$55 /mo · $655/yr
- Insurance
- −$58
- HOA
- −$0
- Vacancy / Maint / Mgmt
- −$248
- Net cashflow
- $85
Break-even live
Sensitivity live
| Price | -10% $164 | -5% $124 | +0% $85 | +5% $45 | +10% $5 |
|---|---|---|---|---|---|
| Rent | -10% $-9 | -5% $38 | +0% $85 | +5% $131 | +10% $178 |
| Rate | -1.0pp $155 | -0.5pp $120 | base $85 | +0.5pp $48 | +1.0pp $11 |
UW: 25.0% down · 7.5% · 30yr · 1.5% tax · 5.0% vac · 8.0% maint · 8.0% mgmt
Financing live
Cash to close
- Down payment
- $34,975
- Closing costs
- $4,197
- Reserves months
- —
- Total cash needed
- —
Loan-product check · same deal, 3 products live
Conventional
25% down · 7.5% · 30yr
- Down + closing
- —
- Monthly P&I
- —
- Monthly cashflow
- —
- DSCR
- —
- Eligible?
- —
Personal DTI + credit; lowest rate.
DSCR
20% down · 8.5% · 30yr
- Down + closing
- —
- Monthly P&I
- —
- Monthly cashflow
- —
- DSCR
- —
- Eligible?
- —
No personal income docs; deal must DSCR.
Hard money
10% down · 12.0% · 12mo
- Down + closing
- —
- Monthly P&I
- —
- Monthly cashflow
- —
- DSCR
- —
- Eligible?
- —
Short-term bridge; refi at stabilization.
Rent comps 10 comps
| Address | Beds | Baths | Sqft | Rent | $/sqft | DOM | Units | Dist |
|---|---|---|---|---|---|---|---|---|
| 4008 E Virgin St Tulsa, OK | 3.0 | 1.0 | 1125 | $1,400 | $1.24 | 5d | 1 | 0.48mi |
| 1830 N New Haven Ave Tulsa, OK | 2.0 | 1.0 | 840 | $1,295 | $1.54 | 25d | 1 | 0.50mi |
| 1816 N Delaware Pl Tulsa, OK | 3.0 | 1.0 | 990 | $950 | $0.96 | 5d | 1 | 0.72mi |
| 1928 N Columbia Pl Tulsa, OK | 2.0 | 1.0 | 888 | $1,000 | $1.13 | 17d | 1 | 0.77mi |
| 1507 N Florence Ave Tulsa, OK | 3.0 | 1.0 | 1000 | $1,100 | $1.10 | 25d | 1 | 0.77mi |
| 1807 N Atlanta Ave Tulsa, OK | 3.0 | 1.0 | 812 | $995 | $1.23 | 25d | 1 | 1.08mi |
| 1623 N Atlanta Ave Tulsa, OK | 3.0 | 1.0 | 975 | $1,175 | $1.21 | 5d | 1 | 1.14mi |
| 3326 E Marshall St Unit 1 Tulsa, OK | 2.0 | 1.0 | 700 | $825 | $1.18 | 25d | 1 | 1.15mi |
| 3326 E Marshall St Apt 4 Tulsa, OK | 2.0 | 1.0 | 750 | $925 | $1.23 | 25d | 1 | 1.15mi |
| 4703 E Latimer Pl Tulsa, OK | 2.0 | 1.0 | 1103 | $1,290 | $1.17 | 5d | 1 | 1.43mi |
Listing history 7 events
-
2026-04-20status Pending
-
2026-04-17soldstatus Closed
-
2026-04-16status Pending
-
2026-04-14$139,900 Active
-
2001-04-01soldstatus $26,000 192-char remark
Show marketing remark (192 chars)
PC1334 NEAT & CLEAN 2 BDRM W/ FENCED FRONT & BACK, NEWER WINDOW UNIT, STORM WINDOWS, STOVE & REFRIGERATOR STAY. EAT IN KITCHEN, BOTH BEDROOMS ARE GOOD SIZE - VACANT - GO SHOW
-
2001-03-16historical 192-char remark
Show marketing remark (192 chars)
PC1334 NEAT & CLEAN 2 BDRM W/ FENCED FRONT & BACK, NEWER WINDOW UNIT, STORM WINDOWS, STOVE & REFRIGERATOR STAY. EAT IN KITCHEN, BOTH BEDROOMS ARE GOOD SIZE - VACANT - GO SHOW
-
2000-10-03$29,900 192-char remark
Show marketing remark (192 chars)
PC1334 NEAT & CLEAN 2 BDRM W/ FENCED FRONT & BACK, NEWER WINDOW UNIT, STORM WINDOWS, STOVE & REFRIGERATOR STAY. EAT IN KITCHEN, BOTH BEDROOMS ARE GOOD SIZE - VACANT - GO SHOW
ⓘ Source: listings_history table (triggers on properties + properties_extension) + one-shot
backfill from property_details.listing_events for pre-trigger history.
Tax reassessment forecast OK · Resets to sale price
- Current annual tax
- $655 · $55/mo
- Projected year-2 tax
- $1,259 · $105/mo
- Expected delta
- +$604/yr (+$50/mo · 92.2%)
ⓘ Screening estimate from a state-policy table — verify with the county assessor before closing.
Climate risk First Street
- Flood 1/10 Low FEMA zone X (unshaded) · 0% chance over 30 yrs
- Wildfire 1/10 Low
- Heat 6/10 Major 7 d/yr ≥110°F today · 18 d/yr by 30 yrs out
- Wind 2/10 Low 4% chance of damaging wind over 30 yrs
- Air quality 3/10 Moderate 2 unhealthy d/yr today · 3 by 30 yrs out
Nearby sold comps map
Loading sold comps map…
Walkable amenities ~0.75 mi
Loading nearby amenities…
Taxation est. · year 1
- Rental income
- $14,144
- − Mortgage interest
- −$7,837
- − Property taxes
- −$655
- − Insurance
- −$700
- − Repairs & maintenance
- −$1,131
- − Management
- −$1,131
- − Depreciation
- −$4,070
- Taxable loss
- −$1,380
- Est. tax savings @ 24.0%
- +$331
- After-tax cash flow
- $1,346/yr
For passive investors: Depreciation is non-cash, so a rental often shows a tax loss while cash-flowing — sheltering income. Rental losses are passive: they offset passive income freely, and up to $25,000/yr can offset ordinary (W-2) income if you actively participate and your MAGI is under $100k (phasing out to $0 by $150k); unused losses carry forward. On sale, claimed depreciation is recaptured at up to 25%, and gains may owe capital-gains tax (a 1031 exchange can defer both). Figures are a year-1 estimate at your 24.0% rate — not tax advice; consult a CPA.
Schools (NCES district)
- District
- Tulsa
- NCES district ID
- 4030240
- Math proficiency
- 7% ▼ -9.00%
- Reading proficiency
- 12% ▼ -7.00%
- Median HH income
- $37,895
- Composite
- 8.04/100
- National rank
- #9919
- State rank
- #250 of 270 in OK
Livability — Tulsa
- Score
- 75/100
- State rank
- #13
- US rank
- #4058
Category grades
Schools grade is shown separately in the Schools card above.
Census & demographics
- Census place
- Tulsa, OK
- County
- Tulsa County · 640,811 people
- City population
- 389,418
- Metro
- Tulsa, OK
- Population (ZIP)
- 24,297
- Household income
- $44,608
- Rent vs Own
- Severe rent burden
- 805.0
Population outlook (Tulsa County) Hauer SSP2
- Today (2025)
- 723,846 people
- By 2030
- 766,033 · +5.8%
- By 2040
- 851,386 · +17.6%
- By 2050
- 938,389 · +29.6%
- By 2075
- 1,166,011 · +61.1%
- By 2100
- 1,350,277 · +86.5%
Race, ethnicity, and origin ACS 2023
- Neighborhood character
- Diverse neighborhood (Simpson 0.68)
- Race & ethnicity
- Hispanic / Latino 44% White 33% Two or more races 19% Black 13% Native American 5%
- Hispanic origin (detail)
- Mexican 39%
- Common ancestry
- Italian 1% Slovak 1% Lithuanian 1%
- Foreign-born
- 19% · Canada
- Languages at home
- 57% English-only · Spanish 42%
Political lean MEDSL · Tulsa
- 2024 margin
- R (+15.2) · D 41.3% · R 56.5% · Other 2.2%
- 2008→2024 swing
- +9.2pp toward D · 2008: -24.5pp · 2024: -15.2pp
- All cycles
- 2024: R+15.2 2020: R+15.6 2016: R+22.9 2012: R+27.4 2008: R+24.5
Not yet ingested
- Civics
- —
Market trends
- HPI YoY
- ▼ -26.82%
- Current HPI
- 251.0869
- Rent YoY
- ▲ 4.57%
- Metro
- Tulsa, OK
- State GDP YoY
- ▲ 1.55%
- F500 in state
- 6
Industry mix (Fortune 500 HQ in OK)
| Industry | F500 HQs | Revenue |
|---|---|---|
| Energy | 3 | $48B |
|
||
Price history
+367.9% since first listed7 events — show timeline
- 2026-04-20 Pending — MLS Technology, Inc.
- 2026-04-17 Sold (MLS) — MLS Technology, Inc.
- 2026-04-16 Pending — MLS Technology, Inc.
- 2026-04-14 Listed $139,900 MLS Technology, Inc.
- 2001-04-01 Sold (MLS) $26,000 MLS Technology, Inc.
- 2001-03-16 Listing Removed — MLS Technology, Inc.
- 2000-10-03 Listed $29,900 MLS Technology, Inc.
Property tax history
+1.4%/yrLatest (2025): $655 · +8.6% YoY. Source: county tax records.
Cash-flow waterfall
monthlySold comps — $/sqft
last 12 mo · ≤1 miLoading sold comps…