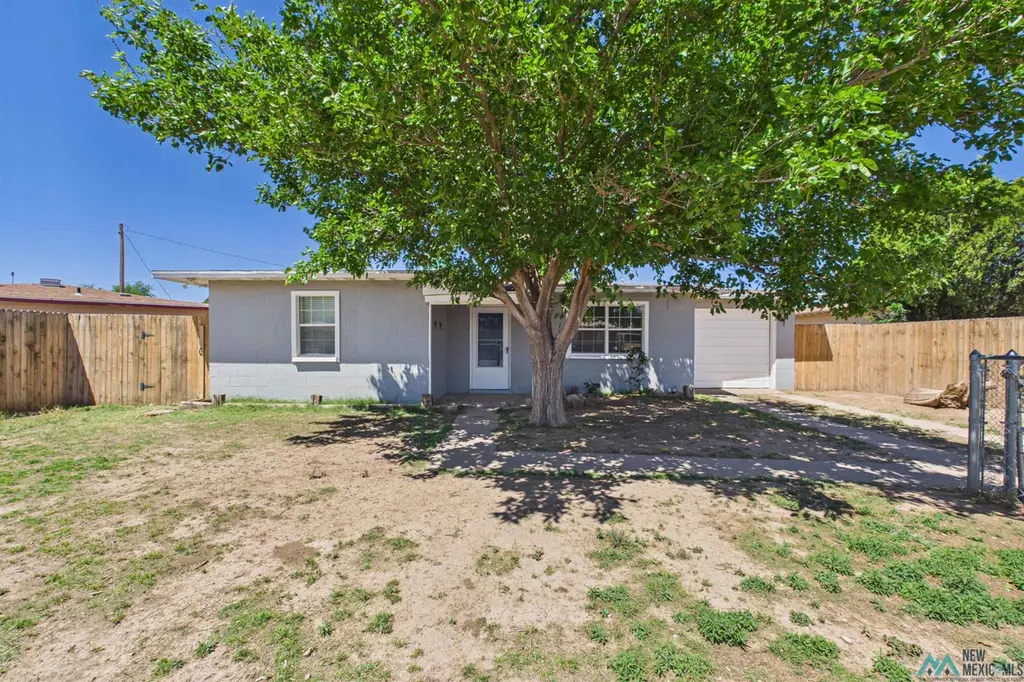
64 E St · Roswell, NM
Flood risk 1/10 · Minimal
- FEMA flood zone
- X (unshaded)
- Chance of flooding over 30 yrs
- 0.0%
- Est. flood insurance / yr
- $507 – $1,088
Fire risk 6/10 · Moderate
- Est. fire insurance / yr
- $706 – $1,312
Heat risk 5/10 · Moderate
- Hot days now (above 99°F)
- 7 days/yr
- Hot days in 30 yrs
- 19 days/yr
Wind risk 2/10 · Minimal
- Chance of severe wind over 30 yrs
- —
Air-quality risk 1/10 · Minimal
- Unhealthy air days now
- 0 days/yr
- Unhealthy air days in 30 yrs
- 0 days/yr
Risk factors via First Street. Map © Google.
Why this score? — see what drove the B- grade
The composite is a weighted blend of 9 inputs, each scored 0–100. Each bar is that input's sub-score; the figure is the points it added to the 100-point composite (weight × sub-score).
- Cash flow +30.0/30.0
- DSCR +10.0/10.0
- 1% rule +8.6/10.0
- ARV discount +7.5/15.0
- Livability +3.8/5.0
- Schools +2.6/10.0
- Rent growth +2.5/5.0
- Condition / age +2.5/5.0
- Appreciation +0.0/10.0
$110,500
🖨 Deal sheet (PDF) 📄 Offer letter ✓ Due diligence
Listing remarks
Come see this adorable little home offering 3 bedrooms, 1 bath plus a 1 car garage. Featuring a spacious living area, tile throughout and a sunroom/laundry area that leads to the garage. Inside the fenced front yard, with a locking privacy gate, offers beautiful flowerbeds surrounding the porch giving just the right touch for a nice added curb appeal. The huge fully fenced back yard, with 6ft wood and chain fencing, offers endless possibilities for outdoor entertainment, gardening, pets and even a chicken coop. Call to schedule a tour of this Home Sweet Home TODAY! Fall in Love, Make an Offer & Let's Buy a House!
Key facts
- Fenced front yard
- Locking privacy gate
- Chicken coop
Tags
Property features AI
Exterior
- Parking: Attached garage (1 covered parking space, 1 total parking space)
- Utilities: Water: connected; Sewer: connected; Power: connected
- Home design: Single-family residence; Residential property
- Construction: Block construction; Shingle roof; Built area approximately 1272
- Exterior features: Fenced yard with front and back yard areas; Chain link and wood fencing
Interior
- Kitchen: Free-standing range; Refrigerator
- Flooring: Tile
- Bathrooms: 1 full bathroom
- Heating & cooling: Wall furnace heating; Evaporative cooling
- Interior features: Free-standing range; Refrigerator; Water heater
- Laundry & utility: Water heater
Neighborhood map
What this means for you Summary
Snapshot
- This is a 3-bed/1.0-bath single-family listed at $110k.
Deal economics
- At list price, monthly cash flow is $531 ($6k/yr) — positive.
- The deal already cash-flows at list — no discount required.
- Meets the 1% rule at list price ($2k rent vs $110k).
Location & tenants
- Location reads 75/100 on livability (#8 in NM, #4,339 nationally) — a middle-class / working-renter tenant base. Strengths: commute A+, cost of living A+, housing A+; Watch: employment D, schools F, crime F.
- Roswell Independent Schools (town): math 11% / reading 52% proficiency, ranked #16 of 29 in NM (top 55%) — families likely to look elsewhere, expect single-tenant / working-renter base with shorter leases; 75% free/reduced lunch — lower-income household profile, screen leases tightly.
- Market conditions: 181 active listings in the ZIP; 1 comparable units currently listed for rent nearby; lower-income renter base — watch delinquency; 88 units permitted in Chaves County in 2024 (0 in 5+ unit buildings).
- This rent runs 43% of the median local income ($42k/yr) — at the standard rent-burdened threshold; future hikes will face affordability resistance.
Forward outlook
- Local home prices are declining (-3.0%/yr); year-one equity from $764 of loan paydown is wiped out by about $3k of value loss. Plan a longer hold.
- At projected returns (-3.0% appreciation + 3.0% rent growth), your $31k cash investment doubles in ~6 years — after that, you're playing with house money.
Negotiation context
- Only 3 days on market — expect competitive offers; lowballing is unlikely to land.
- 2 sale attempts with the ask held roughly flat each time — persistent listings suggest the price (not the market) is what's stuck; bring a comps-based counter.
Risks & watch-outs
- Climate carrying-cost: major wildfire risk; extreme-heat days projected 7→19/yr by 2055 (HVAC capex compounding) — expect insurance premiums to compound above CPI over the hold.
Questions for the listing agent
- Built in 1974 — when were the roof, HVAC, electrical panel, plumbing, and water heater last replaced?
- Is there a deadline driving the sale (1031 exchange, divorce, estate, relocation)? That informs how much negotiation room exists.
- Schools are F-rated, which usually means shorter tenancies and higher turnover. Who's the typical renter profile here, and what's been the actual vacancy rate?
- Crime grade is F in this area — have there been break-ins, vandalism, or insurance claims at this property in the last 3 years? What carrier currently insures it and at what premium?
- What's the average days-on-market for RENTAL listings here right now (not sales)? A rising rental-DOM trend means longer vacancies and softer asking-rent achievability than the comps imply.
- What's the recent tenant-quality profile in this submarket — average credit score on applications, eviction rate, late-payment / NSF rate, and stable-employment percentage? A property-management company in the area should have these aggregated.
- How much new for-sale + rental construction is in the pipeline within 1–3 miles? Heavy new supply typically softens prices + rents 12–24 months out; constrained supply supports both.
Investment metrics
- 1% rule
- 1.36% ✓
- Cap rate
- 12.06%
- Cash-on-cash
- 20.59%
- DSCR
- 1.92
- GRM
- 6.1
CMA / ARV
No comps found within radius.
Projected returns pro-forma
-3.0% appreciation · 3.0% rent growth · sell at horizon
- IRR
- 12.9%
- Equity multiple
- 1.51×
- Total profit
- $15,857
- Equity at exit
- $16,476
- IRR
- 21.7%
- Equity multiple
- 2.85×
- Total profit
- $57,159
- Equity at exit
- $9,554
Cash invested: $30,940 (down + closing). Projections, not guarantees.
Landlord ↔ Tenant lean methodology
- Overall (STATE)
- 55 Moderately Landlord-Leaning
- State New Mexico
- 55 Moderately Landlord-Leaning · D+3
- County
- — inherits STATE
- City
- — inherits STATE
ZIP-level market 88203
- Home prices YoY
- -34.1%
- Active inventory
- 181
- Price-to-rent
- 6.1×
Monthly cashflow live
- Estimated rent
- $1,500 medium interval (Pro) →
- Mortgage (P&I)
- −$579
- Tax from tax record
- −$28 /mo · $342/yr
- Insurance
- −$46
- HOA
- −$0
- Vacancy / Maint / Mgmt
- −$315
- Net cashflow
- $531
Break-even live
Sensitivity live
| Price | -10% $593 | -5% $562 | +0% $531 | +5% $500 | +10% $468 |
|---|---|---|---|---|---|
| Rent | -10% $412 | -5% $472 | +0% $531 | +5% $590 | +10% $649 |
| Rate | -1.0pp $586 | -0.5pp $559 | base $531 | +0.5pp $502 | +1.0pp $473 |
UW: 25.0% down · 7.5% · 30yr · 1.5% tax · 5.0% vac · 8.0% maint · 8.0% mgmt
Financing live
Cash to close
- Down payment
- $27,625
- Closing costs
- $3,315
- Reserves months
- —
- Total cash needed
- —
Loan-product check · same deal, 3 products live
Conventional
25% down · 7.5% · 30yr
- Down + closing
- —
- Monthly P&I
- —
- Monthly cashflow
- —
- DSCR
- —
- Eligible?
- —
Personal DTI + credit; lowest rate.
DSCR
20% down · 8.5% · 30yr
- Down + closing
- —
- Monthly P&I
- —
- Monthly cashflow
- —
- DSCR
- —
- Eligible?
- —
No personal income docs; deal must DSCR.
Hard money
10% down · 12.0% · 12mo
- Down + closing
- —
- Monthly P&I
- —
- Monthly cashflow
- —
- DSCR
- —
- Eligible?
- —
Short-term bridge; refi at stabilization.
Rent comps 1 comps
| Address | Beds | Baths | Sqft | Rent | $/sqft | DOM | Units | Dist |
|---|---|---|---|---|---|---|---|---|
| 23 W Eyman St Roswell, NM | 4.0 | 2.0 | 1450 | $1,500 | $1.03 | 45d | 1 | 0.41mi |
Listing history 5 events
-
2026-05-11status Pending
-
2026-05-08$110,500 Active
-
2025-04-03historical $950
-
2025-03-18$950
-
2008-08-25soldstatus
ⓘ Source: listings_history table (triggers on properties + properties_extension) + one-shot
backfill from property_details.listing_events for pre-trigger history.
Tax reassessment forecast NM · Resets to sale price
- Current annual tax
- $342 · $28/mo
- Projected year-2 tax
- $884 · $74/mo
- Expected delta
- +$542/yr (+$45/mo · 158.5%)
ⓘ Screening estimate from a state-policy table — verify with the county assessor before closing.
Climate risk First Street
- Flood 1/10 Low FEMA zone X (unshaded) · 0% chance over 30 yrs
- Wildfire 6/10 Major
- Heat 5/10 Major 7 d/yr ≥99°F today · 19 d/yr by 30 yrs out
- Wind 2/10 Low
- Air quality 1/10 Low 0 unhealthy d/yr today · 0 by 30 yrs out
Nearby sold comps map
Loading sold comps map…
Walkable amenities ~0.75 mi
Loading nearby amenities…
Taxation est. · year 1
- Rental income
- $17,997
- − Mortgage interest
- −$6,190
- − Property taxes
- −$342
- − Insurance
- −$552
- − Repairs & maintenance
- −$1,440
- − Management
- −$1,440
- − Depreciation
- −$3,215
- Taxable income
- $4,819
- Est. tax owed @ 24.0%
- −$1,157
- After-tax cash flow
- $5,213/yr
For passive investors: Depreciation is non-cash, so a rental often shows a tax loss while cash-flowing — sheltering income. Rental losses are passive: they offset passive income freely, and up to $25,000/yr can offset ordinary (W-2) income if you actively participate and your MAGI is under $100k (phasing out to $0 by $150k); unused losses carry forward. On sale, claimed depreciation is recaptured at up to 25%, and gains may owe capital-gains tax (a 1031 exchange can defer both). Figures are a year-1 estimate at your 24.0% rate — not tax advice; consult a CPA.
Schools (NCES district)
- District
- Roswell Independent Schools
- NCES district ID
- 3502250
- Math proficiency
- 11% ▼ -9.00%
- Reading proficiency
- 52% ▲ 23.00%
- Median HH income
- $38,848
- Composite
- 26.21/100
- National rank
- #7262
- State rank
- #16 of 29 in NM
Livability — Roswell
- Score
- 75/100
- State rank
- #8
- US rank
- #4339
Category grades
Schools grade is shown separately in the Schools card above.
Census & demographics
- Census place
- Roswell, NM
- County
- Chaves County · 56,277 people
- City population
- 56,277
- Metro
- Roswell, NM
- Population (ZIP)
- 28,753
- Household income
- $42,207
- Rent vs Own
- Severe rent burden
- 995.0
Population outlook (Chaves County) Hauer SSP2
- Today (2025)
- 66,122 people
- By 2030
- 66,351 · +0.3%
- By 2040
- 66,818 · +1.1%
- By 2050
- 66,928 · +1.2%
- By 2075
- 65,474 · -1.0%
- By 2100
- 58,943 · -10.9%
Race, ethnicity, and origin ACS 2023
- Neighborhood character
- Predominantly Hispanic (65%)
- Race & ethnicity
- Hispanic / Latino 65% White 31% Two or more races 22% Black 2% Native American 1%
- Hispanic origin (detail)
- Mexican 58%
- Common ancestry
- Slovak 1% Serbian 1% Lithuanian 1%
- Foreign-born
- 12% · Canada
- Languages at home
- 62% English-only · Spanish 38%
Political lean MEDSL · Chaves
- 2024 margin
- Solid R (+44.8) · D 26.8% · R 71.6% · Other 1.6%
- 2008→2024 swing
- -20.2pp toward R · 2008: -24.7pp · 2024: -44.8pp
- All cycles
- 2024: R+44.8 2020: R+41.3 2016: R+36.4 2012: R+32.4 2008: R+24.7
Not yet ingested
- Civics
- —
Market trends
- HPI YoY
- ▼ -78.30%
- Current HPI
- 151.1401
- Rent YoY
- —
- Metro
- Roswell, NM
- State GDP YoY
- —
- F500 in state
- 0
Price history
5 events — show timeline
- 2026-05-11 Pending — NMMLS
- 2026-05-08 Listed $110,500 NMMLS
- 2025-04-03 Rental Removed $950 APPFOLIO
- 2025-03-18 Listed for Rent $950 APPFOLIO
- 2008-08-25 Sold (Public Records) — Public Records
Property tax history
-1.6%/yrLatest (2025): $342 · -0.9% YoY. Source: county tax records.
Cash-flow waterfall
monthlySold comps — $/sqft
last 12 mo · ≤1 miLoading sold comps…