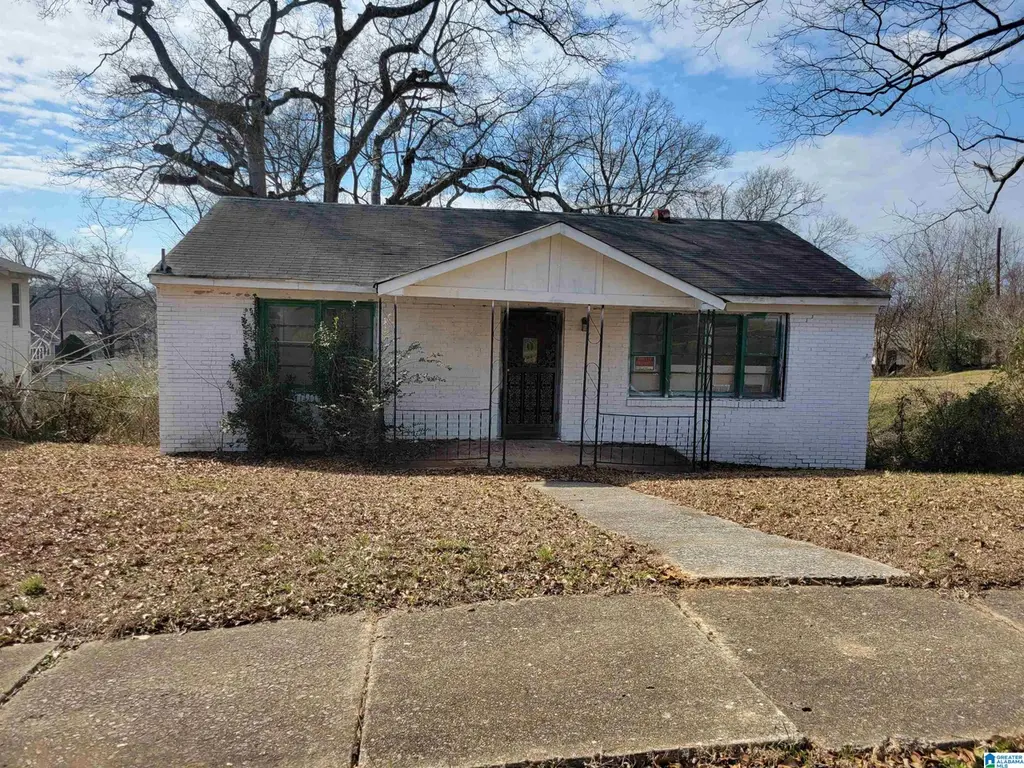
16 Norwood Cir · Birmingham, AL
Flood risk 1/10 · Minimal
- FEMA flood zone
- X (unshaded)
- Chance of flooding over 30 yrs
- 0.0%
- Est. flood insurance / yr
- $473 – $860
Fire risk 1/10 · Minimal
- Est. fire insurance / yr
- $916 – $1,700
Heat risk 6/10 · Moderate
- Hot days now (above 106°F)
- 7 days/yr
- Hot days in 30 yrs
- 17 days/yr
Wind risk 6/10 · Moderate
- Chance of severe wind over 30 yrs
- 27.0%
Air-quality risk 4/10 · Minor
- Unhealthy air days now
- 6 days/yr
- Unhealthy air days in 30 yrs
- 8 days/yr
Risk factors via First Street. Map © Google.
Why this score? — see what drove the B- grade
The composite is a weighted blend of 9 inputs, each scored 0–100. Each bar is that input's sub-score; the figure is the points it added to the 100-point composite (weight × sub-score).
- Cash flow +30.0/30.0
- 1% rule +10.0/10.0
- DSCR +10.0/10.0
- ARV discount +7.5/15.0
- Livability +3.4/5.0
- Rent growth +2.5/5.0
- Condition / age +2.5/5.0
- Schools +0.9/10.0
- Appreciation +0.1/10.0
$42,900
🖨 Deal sheet (PDF) 📄 Offer letter ✓ Due diligence
Listing remarks MLS
Calling all investors. Have you been looking for a project in the Norwood area, well look no more. Here is one ready for you to coming with your imagination and turn it into a nice home.
Key facts
- 8,712 sq ft lot
- Garage
- Built 1955
Neighborhood map
What this means for you Summary
Snapshot
- This is a 3-bed/1.0-bath single-family listed at $43k.
Deal economics
- At list price, monthly cash flow is $490 ($6k/yr) — positive.
- The deal already cash-flows at list — no discount required.
- Meets the 1% rule at list price ($1k rent vs $43k).
- Recommended offer: $38k (12.0% below list) — sets the bar for market timing.
- Cap rate 20.0% vs local median 6.2% in Birmingham — top-decile yield for the area; either an underpriced asset or a hidden risk that comps aren't pricing in. Stress-test before assuming the spread holds.
Location & tenants
- Location reads 67/100 on livability (#78 in AL) — a middle-class / working-renter tenant base. Strengths: commute A+, cost of living A+, housing A+; Watch: amenities C-, schools F, crime F.
- Birmingham City (urban): math 4% / reading 20% proficiency, ranked #116 of 129 in AL (top 90%) — low school quality limits family demand, transient renter base, plan for 1-2y turnover; 82% free/reduced lunch — lower-income household profile, screen leases tightly.
- Market conditions: 54 active listings in the ZIP; 31 comparable units currently listed for rent nearby; rentals at typical pace (median 26d on market — plan ~3-4 weeks tenant-placement turnaround); 2,114 units permitted in Jefferson County in 2024 (556 in 5+ unit buildings).
Forward outlook
- Local home prices are declining (-3.0%/yr); year-one equity from $297 of loan paydown is wiped out by about $1k of value loss. Plan a longer hold.
- Jefferson County population projected to shrink 4% by 2050 — rents likely to lag national; underwrite the cash flow, not the appreciation.
- At projected returns (-3.0% appreciation + 3.0% rent growth), your $12k cash investment doubles in ~3 years — after that, you're playing with house money.
Negotiation context
- It's been on market 136 days — a 12% lower offer ($38k) is reasonable based on typical stale-listing flexibility.
- 2 sale attempts since 3y ago; this cycle's ask has dropped $23k (35%) from the opening price — seller is motivated, your offer sets the floor, not the list.
Risks & watch-outs
- Watch-outs: built in 1955 — expect roof / HVAC / electrical / plumbing capex.
- Climate carrying-cost: major wind risk, 27% chance of damaging wind over 30y; extreme-heat days projected 7→17/yr by 2055 (HVAC capex compounding) — expect insurance premiums to compound above CPI over the hold.
Questions for the listing agent
- It's been on market 136 days. Have you received any prior offers? Is the seller open to a 12% concession, seller financing, or rate buy-down credit?
- Built in 1955 — when were the roof, HVAC, electrical panel, plumbing, and water heater last replaced?
- Why hasn't it sold? Are there any deal-killer items the seller is aware of (foundation, flood, title, zoning, code violations)?
- Is there a deadline driving the sale (1031 exchange, divorce, estate, relocation)? That informs how much negotiation room exists.
- Schools are F-rated, which usually means shorter tenancies and higher turnover. Who's the typical renter profile here, and what's been the actual vacancy rate?
- Crime grade is F in this area — have there been break-ins, vandalism, or insurance claims at this property in the last 3 years? What carrier currently insures it and at what premium?
- What's the average days-on-market for RENTAL listings here right now (not sales)? A rising rental-DOM trend means longer vacancies and softer asking-rent achievability than the comps imply.
- What's the recent tenant-quality profile in this submarket — average credit score on applications, eviction rate, late-payment / NSF rate, and stable-employment percentage? A property-management company in the area should have these aggregated.
- How much new for-sale + rental construction is in the pipeline within 1–3 miles? Heavy new supply typically softens prices + rents 12–24 months out; constrained supply supports both.
Investment metrics
- 1% rule
- 2.40% ✓
- Cap rate
- 20.00%
- Cash-on-cash
- 48.95%
- DSCR
- 3.18
- GRM
- 3.5
CMA / ARV
- ARV (median comp)
- $111,963
- List price
- $42,900
- Delta
- -61.68%
- Verdict
- UNDERPRICED
- Comps
- 15 within 1.0 mi
Show comp detail 3 sales within ~0.75 mi
| Address | Dist | Beds/Ba | Sqft | Sold | Price | $/sf | Match |
|---|---|---|---|---|---|---|---|
| 3509 Norwood Blvd | 0.13mi | 2/1.0 (-1) | 943 (-2%) | 19mo | $135,000 | $143 | 70 |
| 3606 Norwood Blvd | 0.20mi | 2/2.0 (-1) | 1,026 (+7%) | 15mo | $230,000 | $224 | 58 |
| 2878 Norwood Blvd | 0.61mi | 3/1.0 | 875 (-9%) | 15mo | $100,000 | $114 | 44 |
Match score weights: distance 35% · size 25% · config 20% · recency 20%. Top-matched comps best support the ARV.
Projected returns pro-forma
-3.0% appreciation · 3.0% rent growth · sell at horizon
- IRR
- 46.6%
- Equity multiple
- 3.02×
- Total profit
- $24,291
- Equity at exit
- $6,397
- IRR
- 52.3%
- Equity multiple
- 6.12×
- Total profit
- $61,473
- Equity at exit
- $3,709
Cash invested: $12,012 (down + closing). Projections, not guarantees.
Landlord ↔ Tenant lean methodology
- Overall (STATE)
- 90 Strongly Landlord-Friendly
- State Alabama
- 90 Strongly Landlord-Friendly · R+15
- County
- — inherits STATE
- City
- — inherits STATE
ZIP-level market 35234
- Home prices YoY
- -3.8%
- Active inventory
- 54
- Price-to-rent
- 3.5×
Monthly cashflow live
- Estimated rent
- $1,032 high interval (Pro) →
- Mortgage (P&I)
- −$225
- Tax from tax record
- −$82 /mo · $985/yr
- Insurance
- −$18
- HOA
- −$0
- Vacancy / Maint / Mgmt
- −$217
- Net cashflow
- $490
Break-even live
Sensitivity live
| Price | -10% $514 | -5% $502 | +0% $490 | +5% $478 | +10% $466 |
|---|---|---|---|---|---|
| Rent | -10% $409 | -5% $449 | +0% $490 | +5% $531 | +10% $572 |
| Rate | -1.0pp $512 | -0.5pp $501 | base $490 | +0.5pp $479 | +1.0pp $468 |
UW: 25.0% down · 7.5% · 30yr · 1.5% tax · 5.0% vac · 8.0% maint · 8.0% mgmt
Financing live
Cash to close
- Down payment
- $10,725
- Closing costs
- $1,287
- Reserves months
- —
- Total cash needed
- —
Loan-product check · same deal, 3 products live
Conventional
25% down · 7.5% · 30yr
- Down + closing
- —
- Monthly P&I
- —
- Monthly cashflow
- —
- DSCR
- —
- Eligible?
- —
Personal DTI + credit; lowest rate.
DSCR
20% down · 8.5% · 30yr
- Down + closing
- —
- Monthly P&I
- —
- Monthly cashflow
- —
- DSCR
- —
- Eligible?
- —
No personal income docs; deal must DSCR.
Hard money
10% down · 12.0% · 12mo
- Down + closing
- —
- Monthly P&I
- —
- Monthly cashflow
- —
- DSCR
- —
- Eligible?
- —
Short-term bridge; refi at stabilization.
Rent comps 31 comps
| Address | Beds | Baths | Sqft | Rent | $/sqft | DOM | Units | Dist |
|---|---|---|---|---|---|---|---|---|
| 3509 Norwood Blvd Birmingham, AL | 2.0 | 1.0 | 943 | $1,100 | $1.17 | 5d | 1 | 0.11mi |
| 1405 33rd St N Birmingham, AL | 3.0 | 1.0 | 952 | $990 | $1.04 | 25d | 1 | 0.13mi |
| 3311 16th Ave N Unit 3323 Birmingham, AL | 2.0 | 1.0 | 750 | $850 | $1.13 | 3d | 1 | 0.32mi |
| 3311 16th Ave N Unit 3321 Birmingham, AL | 2.0 | 1.0 | 750 | $850 | $1.13 | 25d | 1 | 0.32mi |
| 3311 16th Ave N Unit 3317 Birmingham, AL | 2.0 | 1.0 | 750 | $850 | $1.13 | 45d | 1 | 0.32mi |
| 1444 31st St N Birmingham, AL | 4.0 | 1.0 | 1014 | $1,295 | $1.28 | 25d | 1 | 0.36mi |
| 3001 Norwood Blvd Birmingham, AL | 2.0 | 2.0 | 1092 | $1,500 | $1.37 | 5d | 1 | 0.51mi |
| 2413 14th Ave N Birmingham, AL | 2.0 | 1.0 | 720 | $675 | $0.94 | 3d | 3 | 0.92mi |
| 2608 20th Ave N Unit 5 Birmingham, AL | 2.0 | 1.0 | 750 | $875 | $1.17 | 45d | 1 | 0.94mi |
| 2608 20th Ave N Birmingham, AL | 2.0 | 1.0 | 750 | $895 | $1.19 | 45d | 1 | 0.94mi |
| 1017 Cahaba St Birmingham, AL | 2.0 | 2.0 | 1035 | $1,350 | $1.30 | 5d | 1 | 0.96mi |
| 2129 30th Pl N Birmingham, AL | 3.0 | 1.0 | 1042 | $1,000 | $0.96 | 25d | 1 | 1.02mi |
| 2400 19th Ave N Unit B Birmingham, AL | 2.0 | 1.0 | 750 | $850 | $1.13 | 23d | 1 | 1.06mi |
| 2428 21st Ave N Birmingham, AL | 2.0 | 1.0 | 700 | $975 | $1.39 | 3d | 1 | 1.10mi |
| 2428 21st Ave N Birmingham, AL | 2.0 | 1.0 | 700 | $975 | $1.39 | 4d | 1 | 1.10mi |
| 2428 21st Ave N Birmingham, AL | 2.0 | 1.0 | 700 | $975 | $1.39 | 12d | 1 | 1.10mi |
| 1911 19th Ct N Apt 1 Birmingham, AL | 2.0 | 1.0 | 750 | $845 | $1.13 | 13d | 1 | 1.19mi |
| 2000 Stouts Rd Birmingham, AL | 2.0 | 1.0 | 700 | $880 | $1.26 | 45d | 2 | 1.21mi |
| 4108 7th Ave N Birmingham, AL | 3.0 | 1.0 | 1100 | $1,350 | $1.23 | 25d | 1 | 1.21mi |
| 2300 21st Ave N Birmingham, AL | 2.0 | 1.0 | 700 | $880 | $1.26 | 45d | 2 | 1.21mi |
| 600 24th St N Birmingham, AL | 1.0–3.0 | 1.0–2.0 | 1098 | $1,499 | $1.36 | 3d | 13 | 1.26mi |
| 1428 F L Shuttlesworth Dr Fl Shuttlesworth Birmingham, AL | 2.0 | 1.0 | 803 | $825 | $1.03 | 25d | 3 | 1.26mi |
| 1117 42nd Pl N Birmingham, AL | 3.0 | 1.0 | 1026 | $900 | $0.88 | 45d | 1 | 1.27mi |
| 3376 34th Ave N Birmingham, AL | 3.0 | 2.0 | 928 | $1,200 | $1.29 | 4d | 1 | 1.28mi |
| 1576 20th St N Apt D Birmingham, AL | 2.0 | 1.0 | 900 | $725 | $0.81 | 45d | 1 | 1.29mi |
| 3373 33rd Pl N Birmingham, AL | 3.0 | 1.0 | 912 | $1,150 | $1.26 | 5d | 1 | 1.32mi |
| 3376 34th St N Birmingham, AL | 3.0 | 1.0 | 928 | $1,200 | $1.29 | 13d | 1 | 1.32mi |
| 3376 34th St N Birmingham, AL | 3.0 | 2.0 | 928 | $1,200 | $1.29 | 25d | 1 | 1.32mi |
| 1217 43rd St N Birmingham, AL | 2.0 | 1.0 | 750 | $850 | $1.13 | 45d | 1 | 1.37mi |
| 3016 33rd Ct N Birmingham, AL | 3.0 | 1.0 | 1012 | $1,100 | $1.09 | 45d | 1 | 1.40mi |
| 1909 18th St N Unit 1909 Birmingham, AL | 2.0 | 1.0 | 900 | $799 | $0.89 | 16d | 1 | 1.44mi |
Listing history 34 events
-
2026-06-21days on market $42,900 Active 136 DOM
-
2026-06-18days on market $42,900 Active 133 DOM
-
2026-06-17days on market $42,900 Active 132 DOM
-
2026-06-16days on market $42,900 Active 131 DOM
-
2026-06-15remarks 498-char remark
-
2026-06-15days on market $42,900 Active 130 DOM
-
2026-06-13days on market $42,900 Active 128 DOM
-
2026-06-10days on market $42,900 Active 125 DOM
-
2026-06-09days on market $42,900 Active 124 DOM
-
2026-06-08days on market $42,900 Active 123 DOM
-
2026-06-07days on market $42,900 Active 122 DOM
-
2026-06-03days on market $42,900 Active 118 DOM
-
2026-06-02days on market $42,900 Active 117 DOM
-
2026-06-01days on market $42,900 Active 116 DOM
-
2026-05-31days on market $42,900 Active 115 DOM
-
2026-05-14price $42,900 186-char remark
Show marketing remark (186 chars)
Calling all investors. Have you been looking for a project in the Norwood area, well look no more. Here is one ready for you to coming with your imagination and turn it into a nice home.
-
2026-04-04price $50,900 186-char remark
Show marketing remark (186 chars)
Calling all investors. Have you been looking for a project in the Norwood area, well look no more. Here is one ready for you to coming with your imagination and turn it into a nice home.
-
2026-02-26price $55,900 186-char remark
Show marketing remark (186 chars)
Calling all investors. Have you been looking for a project in the Norwood area, well look no more. Here is one ready for you to coming with your imagination and turn it into a nice home.
-
2026-02-02$65,900 Active 186-char remark
Show marketing remark (186 chars)
Calling all investors. Have you been looking for a project in the Norwood area, well look no more. Here is one ready for you to coming with your imagination and turn it into a nice home.
-
2025-10-29price $65,900
-
2025-09-25price $69,900
-
2025-08-02price $74,900
-
2025-06-23price $84,900
-
2025-05-21price $94,900
-
2025-04-16price $104,900
-
2025-03-18price $114,900
-
2025-02-15price $124,900
-
2025-01-16price $129,900
-
2024-04-15soldstatus $90,000
-
2024-04-12soldstatus $90,000 Sold
-
2024-03-20historical Contingent
-
2023-10-06price $109,900
-
2023-08-23$119,900 Active
-
2023-08-22historical $119,900
ⓘ Source: listings_history table (triggers on properties + properties_extension) + one-shot
backfill from property_details.listing_events for pre-trigger history.
Tax reassessment forecast AL · Resets to sale price
- Current annual tax
- $985 · $82/mo
- Projected year-2 tax
- $985 · $82/mo
- Expected delta
- $0/yr ($0/mo · 0.0%)
ⓘ Screening estimate from a state-policy table — verify with the county assessor before closing.
Climate risk First Street
- Flood 1/10 Low FEMA zone X (unshaded) · 0% chance over 30 yrs
- Wildfire 1/10 Low
- Heat 6/10 Major 7 d/yr ≥106°F today · 17 d/yr by 30 yrs out
- Wind 6/10 Major 27% chance of damaging wind over 30 yrs
- Air quality 4/10 Moderate 6 unhealthy d/yr today · 8 by 30 yrs out
Nearby sold comps map
Loading sold comps map…
Walkable amenities ~0.75 mi
Loading nearby amenities…
Taxation est. · year 1
- Rental income
- $12,378
- − Mortgage interest
- −$2,403
- − Property taxes
- −$985
- − Insurance
- −$214
- − Repairs & maintenance
- −$990
- − Management
- −$990
- − Depreciation
- −$1,248
- Taxable income
- $5,548
- Est. tax owed @ 24.0%
- −$1,331
- After-tax cash flow
- $4,549/yr
For passive investors: Depreciation is non-cash, so a rental often shows a tax loss while cash-flowing — sheltering income. Rental losses are passive: they offset passive income freely, and up to $25,000/yr can offset ordinary (W-2) income if you actively participate and your MAGI is under $100k (phasing out to $0 by $150k); unused losses carry forward. On sale, claimed depreciation is recaptured at up to 25%, and gains may owe capital-gains tax (a 1031 exchange can defer both). Figures are a year-1 estimate at your 24.0% rate — not tax advice; consult a CPA.
Schools (NCES district)
- District
- Birmingham City
- NCES district ID
- 0100390
- Math proficiency
- 4% ▼ -17.00%
- Reading proficiency
- 20% ▼ -4.00%
- Median HH income
- $31,988
- Composite
- 9.49/100
- National rank
- #9850
- State rank
- #116 of 129 in AL
Livability — Birmingham
- Score
- 67/100
- State rank
- #78
- US rank
- #10412
Category grades
Schools grade is shown separately in the Schools card above.
Census & demographics
- Census place
- Birmingham, AL
- City population
- 210,422
- Population (ZIP)
- 3,828
Population outlook (Jefferson County) Hauer SSP2
- Today (2025)
- 669,185 people
- By 2030
- 669,694 · +0.1%
- By 2040
- 661,388 · -1.2%
- By 2050
- 643,086 · -3.9%
- By 2075
- 577,267 · -13.7%
- By 2100
- 474,758 · -29.1%
Race, ethnicity, and origin ACS 2023
- Neighborhood character
- Predominantly Black (80%)
- Race & ethnicity
- Black 80% White 15% Hispanic / Latino 3% Two or more races 1%
- Common ancestry
- Slovak 1% Romanian 1%
- Foreign-born
- 1% · Canada
- Languages at home
- 97% English-only · Spanish 3%
Political lean MEDSL · Jefferson
- 2024 margin
- D (+10.4) · D 54.6% · R 44.2% · Other 1.2%
- 2008→2024 swing
- +5.4pp toward D · 2008: 5.1pp · 2024: 10.4pp
- All cycles
- 2024: D+10.4 2020: D+13.2 2016: D+7.2 2012: D+6.0 2008: D+5.1
Not yet ingested
- Civics
- —
Market trends
- HPI YoY
- ▼ -9.89%
- Current HPI
- 250.4724
- Rent YoY
- —
- Metro
- —
- State GDP YoY
- ▲ 2.94%
- F500 in state
- 4
Industry mix (Fortune 500 HQ in AL)
| Industry | F500 HQs | Revenue |
|---|---|---|
| Financial Services | 1 | $8B |
|
||
| Healthcare | 1 | $5B |
|
||
Price history
-64.2% since first listed19 events — show timeline
- 2026-05-14 Price Changed $42,900 Greater Alabama MLS
- 2026-04-04 Price Changed $50,900 Greater Alabama MLS
- 2026-02-26 Price Changed $55,900 Greater Alabama MLS
- 2026-02-02 Listed $65,900 Greater Alabama MLS
- 2025-10-29 Price Changed $65,900 Greater Alabama MLS
- 2025-09-25 Price Changed $69,900 Greater Alabama MLS
- 2025-08-02 Price Changed $74,900 Greater Alabama MLS
- 2025-06-23 Price Changed $84,900 Greater Alabama MLS
- 2025-05-21 Price Changed $94,900 Greater Alabama MLS
- 2025-04-16 Price Changed $104,900 Greater Alabama MLS
- 2025-03-18 Price Changed $114,900 Greater Alabama MLS
- 2025-02-15 Price Changed $124,900 Greater Alabama MLS
- 2025-01-16 Price Changed $129,900 Greater Alabama MLS
- 2024-04-15 Sold (Public Records) $90,000 Public Records
- 2024-04-12 Sold (MLS) $90,000 Greater Alabama MLS
- 2024-03-20 Contingent — Greater Alabama MLS
- 2023-10-06 Price Changed $109,900 Greater Alabama MLS
- 2023-08-23 Listed $119,900 Greater Alabama MLS
- 2023-08-22 Coming Soon $119,900 Greater Alabama MLS
Property tax history
+2.1%/yrLatest (2025): $985 · +3.0% YoY. Source: county tax records.
Cash-flow waterfall
monthlySold comps — $/sqft
last 12 mo · ≤1 miLoading sold comps…