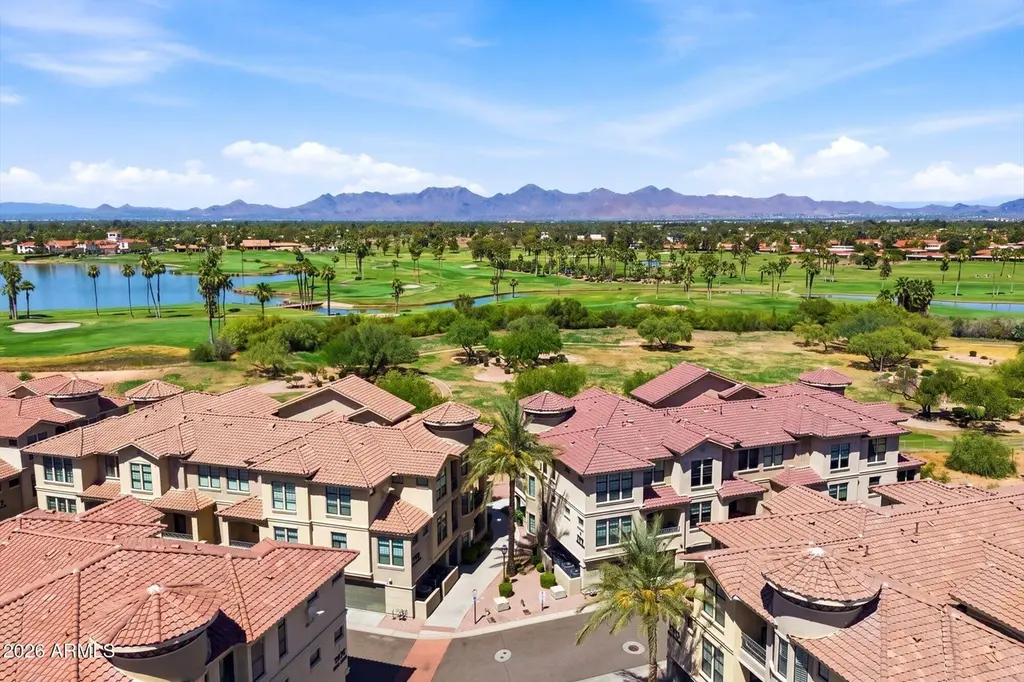
7291 N Scottsdale Rd #3013 · Scottsdale, AZ
Flood risk 6/10 · Moderate
- FEMA flood zone
- X (shaded)
- Chance of flooding over 30 yrs
- 0.71%
- Est. flood insurance / yr
- $507 – $1,088
Fire risk 3/10 · Minor
- Est. fire insurance / yr
- $610 – $1,132
Heat risk 9/10 · Severe
- Hot days now (above 111°F)
- 7 days/yr
- Hot days in 30 yrs
- 19 days/yr
Wind risk 1/10 · Minimal
- Chance of severe wind over 30 yrs
- —
Air-quality risk 3/10 · Minor
- Unhealthy air days now
- 2 days/yr
- Unhealthy air days in 30 yrs
- 3 days/yr
Risk factors via First Street. Map © Google.
Why this score? — see what drove the D- grade
The composite is a weighted blend of 9 inputs, each scored 0–100. Each bar is that input's sub-score; the figure is the points it added to the 100-point composite (weight × sub-score).
- Appreciation +10.0/10.0
- ARV discount +7.5/15.0
- Cash flow +5.0/30.0
- Schools +4.8/10.0
- Rent growth +4.7/5.0
- Livability +4.0/5.0
- Condition / age +2.5/5.0
- 1% rule +1.4/10.0
- DSCR +0.0/10.0
$540,000
🖨 Deal sheet 📄 Offer letter ✓ Due diligence
Listing remarks
Experience elevated PV & Scottsdale living in Artesia, a sought-after gated community in McCormick Ranch near Old Town, Kierland, golf, dining, shopping, and entertainment. This rare third-floor 2-bedroom, 2-bath condo offers 1,244 sq ft with beautiful golf course and mountain views. Inside, travertine flooring, granite countertops, high ceilings, and a gas fireplace create warmth and timeless appeal, while the 2023 HVAC with Airscrubber system adds modern comfort. The scenic primary suite feels peaceful and private, and the balcony is the perfect place to enjoy Arizona sunsets, mountain backdrops, and fireworks when McCormick Ranch hosts events. With two assigned garage spaces, gated
Key facts
- Gated community
- Travertine flooring
- Gas fireplace
Tags
Property features AI
Finance
- Other: Community amenities include pool, spa, golf, biking/walking paths
- Financial info: Conventional financing available
- HOA & community: HOA fees include roof repair and replacement, insurance, sewer, grounds maintenance, trash, water, and exterior maintenance; Monthly association fee; Additional annual association fee
Exterior
- Parking: Covered parking for 2; Assigned gated parking in a community structure; 2-car garage
- Security: Gated community; Fire sprinkler system
- Utilities: City water; Public sewer
- Home design: Condominium (attached apartment)
- Construction: Stucco and wood-frame construction; Tile roof
- Exterior features: Balcony; Private streets; Adjacent to wash; On golf course; Golf and mountain views
Interior
- Kitchen: Refrigerator; Dishwasher; Garbage disposal; Water purifier; Built-in microwave; Kitchen island
- Bedrooms: 2 bedrooms
- Flooring: Carpet; Stone
- Bathrooms: 2 full bathrooms
- Heating & cooling: Natural gas heating; Central air; Ceiling fans; Other cooling
- Interior features: High-speed internet; Granite counters; Double vanity in primary bath; Breakfast bar; 9+ foot flat ceilings; Elevator access; Furnished (see remarks); No interior steps; Kitchen island; Primary bedroom with full bath; Separate shower and tub; Dual-pane windows; Living room gas fireplace
- Laundry & utility: Laundry inside unit
Neighborhood map
What this means for you Summary
Snapshot
- This is a 2-bed/3.0-bath condo listed at $540k.
Deal economics
- At list price, monthly cash flow is $-1k ($-15k/yr) — negative.
- To cash-flow at today's rent, offer at most $314k (41.9% below list).
- To meet the 1% rule (rent ≥ 1% of price), the offer needs to be $344k (36.3% below list).
- Recommended offer: $314k (41.9% below list) — sets the bar for cash-flow.
- Cap rate 3.4% vs local median 2.5% in Scottsdale — top-decile yield for the area; either an underpriced asset or a hidden risk that comps aren't pricing in. Stress-test before assuming the spread holds.
Location & tenants
- Location reads 80/100 on livability (#4 in AZ, #1,756 nationally) — a professional / high-income tenant draw. Strengths: amenities A+, commute A+, employment A+; Watch: health & safety C-, cost of living F.
- Scottsdale Unified District (4240) (urban): math 53% / reading 55% proficiency, ranked #30 of 249 in AZ (top 12%) — acceptable for families but not a draw, mixed tenant base, ~2y average lease.
- Zoned schools: Kiva Elementary School (math 66% / reading 67%, grade B+, #79 of 1,109 statewide, top 7%, 527 students, 10% FRL); Mohave Middle School (math 45% / reading 48%, grade D+, #43 of 218 statewide, top 20%, 799 students, 31% FRL); Saguaro High School (math 37% / reading 41%, grade F, #78 of 381 statewide, top 20%, 1,466 students, 25% FRL) — zoned schools at 22% FRL track the district average.
- Market conditions: Rents rising fast (+8.6%/yr); 349 active listings in the ZIP; 40 comparable units currently listed for rent nearby; rentals at typical pace (median 24d on market — plan ~3-4 weeks tenant-placement turnaround); 42% of comp listings sitting > 30 days — soft ceiling on asking rent; high-income renter base; 36,011 units permitted in Maricopa County in 2024 (12,801 in 5+ unit buildings).
Forward outlook
- In year one you build about $58k of equity ($4k loan paydown + $54k appreciation (10.0% local appreciation)).
- Maricopa County population projected at +38% by 2050 — long-run rental-demand tailwind backs the buy-and-hold thesis.
- By year 2, paydown + projected appreciation supports a ~$93k cash-out refi (75% LTV) — recoverable capital for the next deal without selling this one.
Negotiation context
- It's been on market 27 days — a 2% lower offer ($532k) is reasonable based on typical stale-listing flexibility.
Risks & watch-outs
- Watch-outs: HOA is 22% of rent.
- Climate carrying-cost: major flood risk; extreme-heat days projected 7→19/yr by 2055 (HVAC capex compounding) — expect insurance premiums to compound above CPI over the hold.
Questions for the listing agent
- What do current leases actually rent for vs. the listed asking? Can we see a recent rent roll and the last 12 months of T-12 income?
- What does the HOA fee cover, when was the last increase, and are there any pending special assessments or reserve-fund shortfalls?
- Any open or pending special assessments — roof, HVAC, plumbing, elevator, façade? What's the per-unit balance and payoff schedule, and is the seller paying it off at close or rolling it to the buyer?
- Is there a deadline driving the sale (1031 exchange, divorce, estate, relocation)? That informs how much negotiation room exists.
- Schools are A-rated — typically a magnet for longer-tenancy family renters. What's the average tenant stay here, and is there a school-zone premium baked into asking?
- The area grade is low — what's the realistic commute time and amenity access for the typical tenant pool here? Any planned neighborhood developments (good or bad) we should know about?
- What's the average days-on-market for RENTAL listings here right now (not sales)? A rising rental-DOM trend means longer vacancies and softer asking-rent achievability than the comps imply.
- What's the recent tenant-quality profile in this submarket — average credit score on applications, eviction rate, late-payment / NSF rate, and stable-employment percentage? A property-management company in the area should have these aggregated.
- How much new apartment / multifamily construction is in the pipeline within 1–3 miles? Heavy new supply (>2% of stock underway) typically softens rents 12–24 months out; light construction supports rent growth.
Investment metrics
- 1% rule
- 0.64% ✗
- Cap rate
- 3.45%
- Cash-on-cash
- -10.16%
- DSCR
- 0.55
- GRM
- 13.1
CMA / ARV
No comps found within radius.
Projected returns pro-forma
10.0% appreciation · 8.0% rent growth · sell at horizon
- IRR
- 18.5%
- Equity multiple
- 2.53×
- Total profit
- $230,934
- Equity at exit
- $486,475
- IRR
- 18.3%
- Equity multiple
- 6.22×
- Total profit
- $789,654
- Equity at exit
- $1,049,101
Cash invested: $151,200 (down + closing). Projections, not guarantees.
Landlord ↔ Tenant lean methodology
- Overall (STATE)
- 87 Strongly Landlord-Friendly
- State Arizona
- 87 Strongly Landlord-Friendly · R+3
- County
- — inherits STATE
- City
- — inherits STATE
ZIP-level market 85253
- Home prices YoY
- 4.2%
- Rents YoY
- 8.6%
- Active inventory
- 349
- Price-to-rent
- 13.1×
Monthly cashflow live
- Estimated rent
- $3,439 high interval (Pro) →
- Mortgage (P&I)
- −$2,832
- Tax from tax record
- −$199 /mo · $2,385/yr
- Insurance
- −$225
- HOA
- −$742
- Vacancy / Maint / Mgmt
- −$722
- Net cashflow
- $-1,280
Break-even live
UW: 25.0% down · 7.5% · 30yr · 1.5% tax · 5.0% vac · 8.0% maint · 8.0% mgmt
Financing live
Cash to close
- Down payment
- $135,000
- Closing costs
- $16,200
- Reserves months
- —
- Total cash needed
- —
Loan-product check · same deal, 3 products live
Conventional
25% down · 7.5% · 30yr
- Down + closing
- —
- Monthly P&I
- —
- Monthly cashflow
- —
- DSCR
- —
- Eligible?
- —
Personal DTI + credit; lowest rate.
DSCR
20% down · 8.5% · 30yr
- Down + closing
- —
- Monthly P&I
- —
- Monthly cashflow
- —
- DSCR
- —
- Eligible?
- —
No personal income docs; deal must DSCR.
Hard money
10% down · 12.0% · 12mo
- Down + closing
- —
- Monthly P&I
- —
- Monthly cashflow
- —
- DSCR
- —
- Eligible?
- —
Short-term bridge; refi at stabilization.
Rent comps 40 comps
| Address | Beds | Baths | Sqft | Rent | $/sqft | DOM | Units | Dist |
|---|---|---|---|---|---|---|---|---|
| 7291 N Scottsdale Rd Paradise Valley, AZ | 1.0–2.0 | 1.0–2.5 | 1287 | $4,200 | $3.26 | 7d | 7 | 0.04mi |
| 7291 N Scottsdale Rd Paradise Valley, AZ | 1.0–2.0 | 1.0–2.5 | 1287 | $4,200 | $3.26 | 44d | 6 | 0.04mi |
| 7291 N Scottsdale Rd Paradise Valley, AZ | 1.0–2.0 | 1.0–2.5 | 1287 | $4,200 | $3.26 | 16d | 6 | 0.04mi |
| 7575 E Indian Bend Rd Unit 709 Scottsdale, AZ | 2.0 | 2.0 | 1070 | $2,800 | $2.62 | 24d | 1 | 0.56mi |
| 7575 E Indian Bend Rd Scottsdale, AZ | 1.0–3.0 | 1.0–2.0 | 980 | $2,375 | $2.42 | 16d | 4 | 0.56mi |
| 7575 E Indian Bend Rd Scottsdale, AZ | 1.0–3.0 | 1.0–2.0 | 980 | $3,125 | $3.19 | 4d | 3 | 0.56mi |
| 7575 E Indian Bend Rd Scottsdale, AZ | 2.0–3.0 | 2.0 | 1151 | $3,200 | $2.78 | 7d | 2 | 0.56mi |
| 7575 E Indian Bend Rd Scottsdale, AZ | 2.0–3.0 | 2.0 | 1151 | $2,345 | $2.04 | 11d | 3 | 0.56mi |
| 7601 E Indian Bend Rd #1039 Scottsdale, AZ | 2.0 | 2.0 | 1364 | $3,495 | $2.56 | 11d | 1 | 0.65mi |
| 7609 E Indian Bend Rd Scottsdale, AZ | 2.0 | 2.0–2.5 | 1184 | $2,975 | $2.51 | 11d | 2 | 0.68mi |
| 7609 E Indian Bend Rd #1015 Scottsdale, AZ | 2.0 | 2.0 | 1184 | $4,000 | $3.38 | 43d | 1 | 0.69mi |
| 7641 E Indian Bend Rd Scottsdale, AZ | 3.0 | 3.0 | 1387 | $2,750 | $1.98 | 21d | 1 | 0.72mi |
| 7224 N Via Camello Del Norte #15 Scottsdale, AZ | 3.0 | 2.0 | 1364 | $9,800 | $7.18 | 43d | 1 | 0.72mi |
| 7100 E Lincoln Dr Paradise Valley, AZ | 2.0 | 1.0–2.0 | 878 | $2,802 | $3.19 | 1d | 18 | 0.72mi |
| 7729 E Joshua Tree Ln Scottsdale, AZ | 2.0 | 2.5 | 1366 | $5,800 | $4.25 | 43d | 1 | 0.74mi |
| 7833 E Foxmore Ln Unit 1545809P Scottsdale, AZ | 2.0 | 2.0 | 1496 | $3,710 | $2.48 | 14d | 1 | 0.79mi |
| 8651 E Royal Palm Rd Scottsdale, AZ | 1.0–2.0 | 1.0–2.0 | 1109 | $2,495 | $2.25 | 2d | 4 | 0.79mi |
| 8651 E Royal Palm Rd Scottsdale, AZ | 1.0–2.0 | 1.0–2.0 | 1109 | $2,495 | $2.25 | 14d | 4 | 0.79mi |
| 7344 N Via Camello Del Norte Unit 227 Scottsdale, AZ | 3.0 | 2.0 | 1364 | $3,250 | $2.38 | 19d | 1 | 0.80mi |
| 7000 N Via Camello Del Sur #34 Scottsdale, AZ | 3.0 | 2.0 | 1335 | $8,000 | $5.99 | 43d | 1 | 0.82mi |
| 7316 N Via Camello del Norte Scottsdale, AZ | 2.0 | 2.0 | 1238 | $3,000 | $2.42 | 43d | 1 | 0.82mi |
| 7340 N Via Camello del Norte #234 Scottsdale, AZ | 2.0 | 2.0 | 1238 | $6,000 | $4.85 | 43d | 1 | 0.83mi |
| 7340 N Via Camello del Norte #234 Scottsdale, AZ | 2.0 | 2.0 | 1238 | $2,900 | $2.34 | 24d | 1 | 0.83mi |
| 7818 E Via Camello #53 Scottsdale, AZ | 3.0 | 2.0 | 1335 | $2,500 | $1.87 | 14d | 1 | 0.85mi |
| 7356 N Via Camello del Norte #208 Scottsdale, AZ | 3.0 | 2.0 | 1364 | $2,500 | $1.83 | 43d | 1 | 0.85mi |
| 7356 N Via Camello Del Norte Unit 210 Scottsdale, AZ | 2.0 | 2.0 | 1278 | $5,500 | $4.30 | 43d | 1 | 0.85mi |
| 7001 N Via Camello Del Sur Scottsdale, AZ | 3.0 | 2.0 | 1335 | $2,600 | $1.95 | 43d | 1 | 0.86mi |
| 7901 E Joshua Tree Ln Scottsdale, AZ | 2.0 | 2.0 | 1432 | $6,100 | $4.26 | 17d | 1 | 0.87mi |
| 7575 E Indian Bend Rd Scottsdale, AZ | 1.0 | 1.0 | 731 | $1,550 | $2.12 | 13d | 1 | 0.87mi |
| 7424 N Via Camello del Norte #185 Scottsdale, AZ | 2.0 | 2.0 | 1238 | $9,500 | $7.67 | 1d | 1 | 0.87mi |
| 7424 N Via Camello Del Norte Unit 190 Scottsdale, AZ | 3.0 | 2.0 | 1321 | $2,795 | $2.12 | 43d | 1 | 0.87mi |
| 7341 N Via Camello del Norte #131 Scottsdale, AZ | 3.0 | 2.0 | 1329 | $3,500 | $2.63 | 24d | 1 | 0.88mi |
| 7341 N Via Camello del Norte #131 Scottsdale, AZ | 3.0 | 2.0 | 1329 | $2,975 | $2.24 | 19d | 1 | 0.88mi |
| 7360 N Via Camello Del Norte #201 Scottsdale, AZ | 3.0 | 2.0 | 1364 | $4,600 | $3.37 | 43d | 1 | 0.88mi |
| 7428 N Via Camello del Norte #178 Scottsdale, AZ | 2.0 | 2.0 | 1238 | $7,500 | $6.06 | 43d | 1 | 0.90mi |
| 7428 N Via Camello del Norte #183 Scottsdale, AZ | 2.0 | 2.0 | 1238 | $9,500 | $7.67 | 43d | 1 | 0.90mi |
| 7800 E Lincoln Dr Scottsdale, AZ | 2.0 | 2.0 | 1314 | $4,348 | $3.31 | 43d | 2 | 0.93mi |
| 6466 N 77th Pl Scottsdale, AZ | 3.0 | 2.0 | 1256 | $4,200 | $3.34 | 43d | 1 | 0.96mi |
| 6459 N 77th Way Scottsdale, AZ | 2.0 | 2.0 | 1070 | $2,795 | $2.61 | 43d | 1 | 1.00mi |
| 6350 N 78th St #277 Scottsdale, AZ | 3.0 | 2.0 | 1256 | $2,295 | $1.83 | 21d | 1 | 1.11mi |
HOA detail condo
- Monthly dues
- $742 · $8,904/yr
- Likely covers
- gassecurity
- Assessments
- None detected in remarks — confirm with the listing agent.
Listing history 15 events
-
2026-06-18days on market $540,000 Active 27 DOM
-
2026-06-17days on market $540,000 Active 26 DOM
-
2026-06-16days on market $540,000 Active 25 DOM
-
2026-06-15days on market $540,000 Active 24 DOM
-
2026-06-13days on market $540,000 Active 22 DOM
-
2026-06-13days on market $540,000 Active 21 DOM
-
2026-06-09days on market $540,000 Active 18 DOM
-
2026-06-08days on market $540,000 Active 17 DOM
-
2026-06-07days on market $540,000 Active 16 DOM
-
2026-06-04days on market $540,000 Active 13 DOM
-
2026-06-03days on market $540,000 Active 12 DOM
-
2026-06-02days on market $540,000 Active 11 DOM
-
2026-06-01days on market $540,000 Active 10 DOM
-
2026-05-31days on market $540,000 Active 9 DOM
-
2026-05-22$540,000 Active
ⓘ Source: listings_history table (triggers on properties + properties_extension) + one-shot
backfill from property_details.listing_events for pre-trigger history.
Tax reassessment forecast AZ · Resets to sale price
- Current annual tax
- $2,385 · $199/mo
- Projected year-2 tax
- $3,564 · $297/mo
- Expected delta
- +$1,179/yr (+$98/mo · 49.4%)
ⓘ Screening estimate from a state-policy table — verify with the county assessor before closing.
Climate risk First Street
- Flood 6/10 Major FEMA zone X (shaded) · 71% chance over 30 yrs
- Wildfire 3/10 Moderate
- Heat 9/10 Extreme 7 d/yr ≥111°F today · 19 d/yr by 30 yrs out
- Wind 1/10 Low
- Air quality 3/10 Moderate 2 unhealthy d/yr today · 3 by 30 yrs out
Nearby sold comps map
Loading sold comps map…
Walkable amenities ~0.75 mi
Loading nearby amenities…
Taxation est. · year 1
- Rental income
- $41,272
- − Mortgage interest
- −$30,248
- − Property taxes
- −$2,385
- − Insurance
- −$2,700
- − Repairs & maintenance
- −$3,302
- − Management
- −$3,302
- − HOA
- −$8,904
- − Depreciation
- −$15,709
- Taxable loss
- −$25,278
- Est. tax savings @ 24.0%
- +$6,067
- After-tax cash flow
- $-9,299/yr
For passive investors: Depreciation is non-cash, so a rental often shows a tax loss while cash-flowing — sheltering income. Rental losses are passive: they offset passive income freely, and up to $25,000/yr can offset ordinary (W-2) income if you actively participate and your MAGI is under $100k (phasing out to $0 by $150k); unused losses carry forward. On sale, claimed depreciation is recaptured at up to 25%, and gains may owe capital-gains tax (a 1031 exchange can defer both). Figures are a year-1 estimate at your 24.0% rate — not tax advice; consult a CPA.
Schools (NCES district)
- District
- Scottsdale Unified District (4240)
- NCES district ID
- 0407570
- Math proficiency
- 53% ▼ -10.00%
- Reading proficiency
- 55% ▼ -8.00%
- Median HH income
- $70,139
- Composite
- 48.02/100
- National rank
- #2196
- State rank
- #30 of 249 in AZ
Livability — Scottsdale
- Score
- 80/100
- State rank
- #4
- US rank
- #1756
Category grades
Schools grade is shown separately in the Schools card above.
Census & demographics
- Census place
- Scottsdale, AZ
- County
- Maricopa County · 4,537,380 people
- City population
- 290,846
- Metro
- Phoenix-Mesa-Chandler, AZ
- Population (ZIP)
- 17,904
- Household income
- $184,979
- Rent vs Own
- Severe rent burden
- 298.0
Population outlook (Maricopa County) Hauer SSP2
- Today (2025)
- 4,979,203 people
- By 2030
- 5,378,229 · +8.0%
- By 2040
- 6,156,598 · +23.6%
- By 2050
- 6,872,376 · +38.0%
- By 2075
- 8,401,270 · +68.7%
- By 2100
- 9,247,439 · +85.7%
Race, ethnicity, and origin ACS 2023
- Neighborhood character
- Predominantly White (78%)
- Race & ethnicity
- White 78% Hispanic / Latino 11% Two or more races 9% Asian 5% Pacific Islander 2%
- Hispanic origin (detail)
- Mexican 8%
- Common ancestry
- Scotch-Irish 4% Romanian 3% Slovak 3%
- Foreign-born
- 15% · Canada, China
- Languages at home
- 85% English-only · Spanish 5% Other Indo-European 4% Other Asian/Pacific 2%
Political lean MEDSL · Maricopa
- 2024 margin
- Toss-up / Even · D 47.7% · R 51.2% · Other 1.1%
- 2008→2024 swing
- +7.1pp toward D · 2008: -10.6pp · 2024: -3.5pp
- All cycles
- 2024: R+3.5 2020: D+2.2 2016: R+3.5 2012: R+12.0 2008: R+10.6
Not yet ingested
- Civics
- —
Market trends
- HPI YoY
- ▲ 16.95%
- Current HPI
- 416.0855
- Rent YoY
- ▲ 8.63%
- Metro
- Phoenix-Mesa-Chandler, AZ
- State GDP YoY
- ▲ 4.54%
- F500 in state
- 20
Industry mix (Fortune 500 HQ in AZ)
| Industry | F500 HQs | Revenue |
|---|---|---|
| Technology | 2 | $13B |
|
||
| Mining / Metals | 1 | $23B |
|
||
| Environmental Services | 1 | $16B |
|
||
| Metals / Steel | 1 | $14B |
|
||
| Technology Distribution | 1 | $9B |
|
||
| Homebuilding | 1 | $8B |
|
||
Price history
1 event — show timeline
- 2026-05-22 Listed $540,000 ARMLS
Property tax history
+13.6%/yrLatest (2025): $2,385 · +4.4% YoY. Source: county tax records.
Cash-flow waterfall
monthlySold comps — $/sqft
last 12 mo · ≤1 miLoading sold comps…