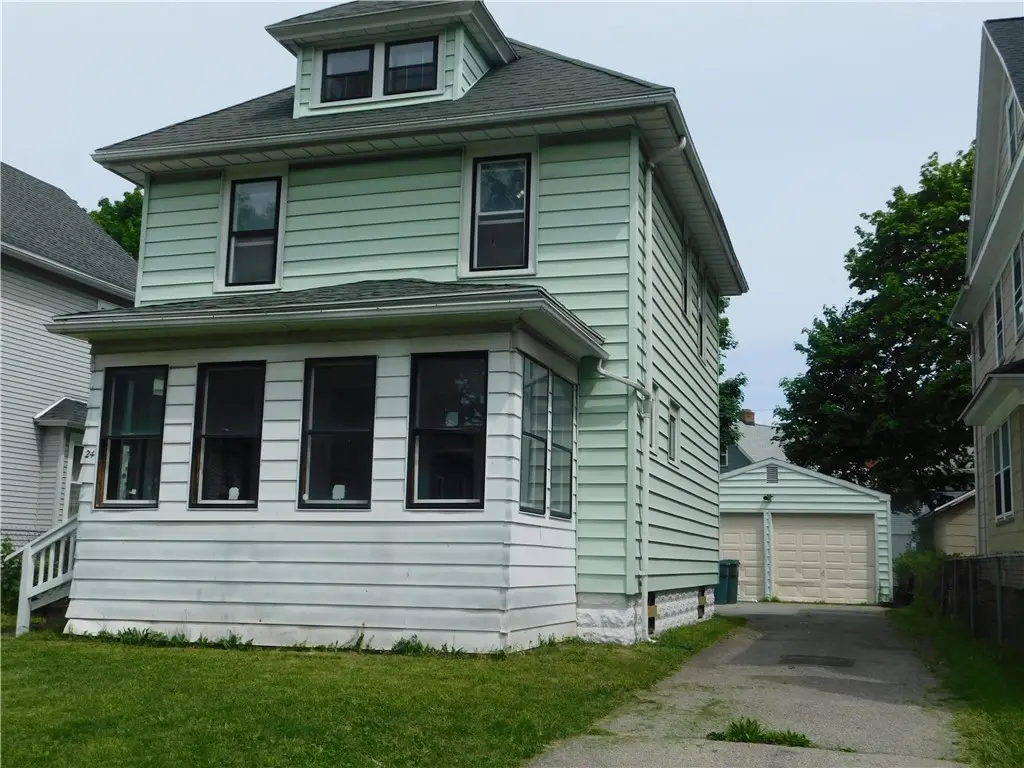
24 Bardin St · Rochester, NY
Flood risk 3/10 · Minor
- FEMA flood zone
- X (unshaded)
- Chance of flooding over 30 yrs
- 0.2%
- Est. flood insurance / yr
- $473 – $860
Fire risk 4/10 · Minor
- Est. fire insurance / yr
- $691 – $1,283
Heat risk 2/10 · Minimal
- Hot days now (above 96°F)
- 7 days/yr
- Hot days in 30 yrs
- 15 days/yr
Wind risk 1/10 · Minimal
- Chance of severe wind over 30 yrs
- —
Air-quality risk 2/10 · Minimal
- Unhealthy air days now
- 1 days/yr
- Unhealthy air days in 30 yrs
- 2 days/yr
Risk factors via First Street. Map © Google.
Why this score? — see what drove the B grade
The composite is a weighted blend of 9 inputs, each scored 0–100. Each bar is that input's sub-score; the figure is the points it added to the 100-point composite (weight × sub-score).
- Cash flow +30.0/30.0
- ARV discount +15.0/15.0
- DSCR +10.0/10.0
- 1% rule +9.0/10.0
- Livability +3.8/5.0
- Rent growth +2.5/5.0
- Condition / age +2.5/5.0
- Schools +1.9/10.0
- Appreciation +0.0/10.0
$115,000
🖨 Deal sheet 📄 Offer letter ✓ Due diligence
Listing remarks MLS
Fabulous 3 Bedroom home located in City Maplewood Neighborhood. Living Room, Formal and Eat-in Kitchen. Huge 2-Car Garage, Fenced yard and more. Call listing agent for appointment. Short Sale.
Key facts
- Enclosed balcony
- Kitchen cabinets
- Full walk-up attic
Tags
Property features AI
Exterior
- Parking: Detached garage; 2 garage spaces
- Utilities: Public water (connected); Sewer connected
- Home design: 2 stories; Existing (previously built); Vinyl siding; Asphalt roof
- Construction: Block foundation; Attic/crawl hatchway(s) insulated
- Exterior features: Blacktop driveway; Rectangular residential lot; City street frontage
Interior
- Kitchen: Eat-in kitchen
- Bedrooms: Total of 6 rooms (includes living space)
- Flooring: Hardwood; Laminate; Varies
- Bathrooms: 1 full bathroom
- Heating & cooling: Gas forced-air heating
- Interior features: Eat-in kitchen; Separate/formal living room; Combined living and dining area; Full basement
- Laundry & utility: Gas water heater
Neighborhood map
What this means for you Summary
Snapshot
- This is a 3-bed/1.0-bath single-family listed at $115k.
Deal economics
- At list price, monthly cash flow is $532 ($6k/yr) — positive.
- The deal already cash-flows at list — no discount required.
- Meets the 1% rule at list price ($2k rent vs $115k).
- Cap rate 11.8% vs local median 9.3% in Rochester — meaningfully above typical; check what's discounted (condition, days-on-market, listing class) to confirm the premium yield is real.
Location & tenants
- Location reads 76/100 on livability (#222 in NY, #3,482 nationally) — a middle-class / working-renter tenant base. Strengths: commute A+, cost of living A+, housing A+; Watch: schools D+, crime F, employment F.
- Rochester City School District (urban): math 21% / reading 26% proficiency, ranked #589 of 590 in NY (top 100%) — low school quality limits family demand, transient renter base, plan for 1-2y turnover; 82% free/reduced lunch — lower-income household profile, screen leases tightly.
- Market conditions: 74 active listings in the ZIP; 13 comparable units currently listed for rent nearby; rentals at typical pace (median 14d on market — plan ~3-4 weeks tenant-placement turnaround); 1,169 units permitted in Monroe County in 2024 (591 in 5+ unit buildings).
- This rent runs 38% of the median local income ($51k/yr) — at the standard rent-burdened threshold; future hikes will face affordability resistance.
Forward outlook
- Local home prices are declining (-3.0%/yr); year-one equity from $795 of loan paydown is wiped out by about $3k of value loss. Plan a longer hold.
- Monroe County population projected to shrink 6% by 2050 — rents likely to lag national; underwrite the cash flow, not the appreciation.
- At projected returns (-3.0% appreciation + 3.0% rent growth), your $32k cash investment doubles in ~7 years — after that, you're playing with house money.
Negotiation context
- Only 10 days on market — expect competitive offers; lowballing is unlikely to land.
- 2 sale attempts since 14y ago with the ask held roughly flat each time — persistent listings suggest the price (not the market) is what's stuck; bring a comps-based counter.
- Current owner paid $35k; list at $115k implies a 229% gain — meaningful room to come down on a strong offer.
Risks & watch-outs
- Watch-outs: built in 1918 — expect roof / HVAC / electrical / plumbing capex.
Questions for the listing agent
- Built in 1918 — when were the roof, HVAC, electrical panel, plumbing, and water heater last replaced?
- Is there a deadline driving the sale (1031 exchange, divorce, estate, relocation)? That informs how much negotiation room exists.
- Schools are D-rated, which usually means shorter tenancies and higher turnover. Who's the typical renter profile here, and what's been the actual vacancy rate?
- Crime grade is F in this area — have there been break-ins, vandalism, or insurance claims at this property in the last 3 years? What carrier currently insures it and at what premium?
- What's the average days-on-market for RENTAL listings here right now (not sales)? A rising rental-DOM trend means longer vacancies and softer asking-rent achievability than the comps imply.
- What's the recent tenant-quality profile in this submarket — average credit score on applications, eviction rate, late-payment / NSF rate, and stable-employment percentage? A property-management company in the area should have these aggregated.
- How much new for-sale + rental construction is in the pipeline within 1–3 miles? Heavy new supply typically softens prices + rents 12–24 months out; constrained supply supports both.
Investment metrics
- 1% rule
- 1.40% ✓
- Cap rate
- 11.84%
- Cash-on-cash
- 19.82%
- DSCR
- 1.88
- GRM
- 6.0
CMA / ARV
- ARV (on-the-fly)
- $153,780
- Comps found
- 12
Show comp detail 12 sales within ~0.75 mi
| Address | Dist | Beds/Ba | Sqft | Sold | Price | $/sf | Match |
|---|---|---|---|---|---|---|---|
| 45 W Ridge Rd | 0.29mi | 3/1.5 | 1,384 (-1%) | 5mo | $210,000 | $152 | 79 |
| 262 Pullman Ave | 0.22mi | 4/1.5 (+1) | 1,350 (-3%) | 4mo | $159,100 | $118 | 74 |
| 165 Clay Ave | 0.26mi | 3/1.0 | 1,334 (-5%) | 8mo | $125,000 | $94 | 74 |
| 42 Ridgeway Ave | 0.12mi | 3/1.0 | 1,246 (-11%) | 7mo | $50,000 | $40 | 71 |
| 267 Flower City Park | 0.17mi | 3/1.0 | 1,224 (-12%) | 5mo | $195,000 | $159 | 67 |
| 45 Lapham St | 0.25mi | 3/1.5 | 1,510 (+8%) | 8mo | $170,000 | $113 | 66 |
| 571 Flower City Park | 0.46mi | 3/1.5 | 1,302 (-7%) | 4mo | $100,000 | $77 | 62 |
| 273 Electric Ave | 0.56mi | 3/1.5 | 1,327 (-5%) | 3mo | $150,000 | $113 | 61 |
| 198 Steko Ave | 0.64mi | 3/1.5 | 1,360 (-3%) | 8mo | $150,000 | $110 | 56 |
| 232 Alameda St | 0.58mi | 3/1.5 | 1,542 (+10%) | 3mo | $160,000 | $104 | 51 |
| 118 Rand St | 0.55mi | 3/1.0 | 1,226 (-12%) | 6mo | $77,000 | $63 | 49 |
| 392 Clay Ave | 0.48mi | 3/1.5 | 1,578 (+13%) | 7mo | $158,000 | $100 | 48 |
Match score weights: distance 35% · size 25% · config 20% · recency 20%. Top-matched comps best support the ARV.
Projected returns pro-forma
-3.0% appreciation · 3.0% rent growth · sell at horizon
- IRR
- 11.9%
- Equity multiple
- 1.47×
- Total profit
- $15,231
- Equity at exit
- $17,147
- IRR
- 20.9%
- Equity multiple
- 2.77×
- Total profit
- $56,842
- Equity at exit
- $9,943
Cash invested: $32,200 (down + closing). Projections, not guarantees.
Landlord ↔ Tenant lean methodology
- Overall (STATE)
- 15 Strongly Tenant-Friendly
- State New York
- 15 Strongly Tenant-Friendly · D+10
- County
- — inherits STATE
- City
- — inherits STATE
ZIP-level market 14615
- Home prices YoY
- -11.7%
- Active inventory
- 74
- Price-to-rent
- 6.0×
Monthly cashflow live
- Estimated rent
- $1,608 high interval (Pro) →
- Mortgage (P&I)
- −$603
- Tax from tax record
- −$88 /mo · $1,054/yr
- Insurance
- −$48
- HOA
- −$0
- Vacancy / Maint / Mgmt
- −$338
- Net cashflow
- $532
Break-even live
UW: 25.0% down · 7.5% · 30yr · 1.5% tax · 5.0% vac · 8.0% maint · 8.0% mgmt
Financing live
Cash to close
- Down payment
- $28,750
- Closing costs
- $3,450
- Reserves months
- —
- Total cash needed
- —
Loan-product check · same deal, 3 products live
Conventional
25% down · 7.5% · 30yr
- Down + closing
- —
- Monthly P&I
- —
- Monthly cashflow
- —
- DSCR
- —
- Eligible?
- —
Personal DTI + credit; lowest rate.
DSCR
20% down · 8.5% · 30yr
- Down + closing
- —
- Monthly P&I
- —
- Monthly cashflow
- —
- DSCR
- —
- Eligible?
- —
No personal income docs; deal must DSCR.
Hard money
10% down · 12.0% · 12mo
- Down + closing
- —
- Monthly P&I
- —
- Monthly cashflow
- —
- DSCR
- —
- Eligible?
- —
Short-term bridge; refi at stabilization.
Rent comps 13 comps
| Address | Beds | Baths | Sqft | Rent | $/sqft | DOM | Units | Dist |
|---|---|---|---|---|---|---|---|---|
| 116 Ridgeway Ave Rochester, NY | 3.0 | 2.0 | 1032 | $1,650 | $1.60 | 2d | 1 | 0.07mi |
| 248 Flower City Park Rochester, NY | 3.0 | 1.0 | 1350 | $1,800 | $1.33 | 3d | 1 | 0.14mi |
| 230 Pullman Ave Unit 1 Rochester, NY | 2.0 | 1.0 | 900 | $1,100 | $1.22 | 14d | 1 | 0.19mi |
| 45 Clay Ave Rochester, NY | 3.0 | 1.0 | 1000 | $1,700 | $1.70 | 14d | 1 | 0.26mi |
| 287 Electric Ave Rochester, NY | 3.0 | 1.5 | 1297 | $1,500 | $1.16 | 2d | 1 | 0.59mi |
| 1902 Dewey Ave Unit 1896 Rochester, NY | 2.0 | 1.0 | 900 | $1,150 | $1.28 | 23d | 1 | 0.62mi |
| 1097 Dewey Ave Unit B Rochester, NY | 2.0 | 1.0 | 1008 | $1,150 | $1.14 | 14d | 1 | 0.72mi |
| 1016 Lake Ave Unit 1 Rochester, NY | 3.0 | 1.0 | 1300 | $1,600 | $1.23 | 43d | 1 | 0.75mi |
| 83 Navarre Rd Rochester, NY | 3.0 | 2.0 | 1322 | $2,250 | $1.70 | 2d | 1 | 0.87mi |
| 493 Hollenbeck St Rochester, NY | 2.0 | 1.5 | 936 | $1,275 | $1.36 | 14d | 1 | 0.92mi |
| 254 Lexington Ave Rochester, NY | 3.0 | 1.0 | 950 | $1,350 | $1.42 | 2d | 1 | 1.09mi |
| 28-30 Carthage Dr Unit 28 Rochester, NY | 3.0 | 1.0 | 1415 | $1,600 | $1.13 | 23d | 1 | 1.14mi |
| 100 Andover St Rochester, NY | 2.0 | 1.0 | 750 | $1,795 | $2.39 | 2d | 63 | 1.39mi |
Listing history 11 events
-
2026-06-09statusdays on market $115,000 Pending 10 DOM
-
2026-06-07days on market $115,000 Active 9 DOM
-
2026-06-05days on market $115,000 Active 6 DOM
-
2026-06-03days on market $115,000 Active 5 DOM
-
2026-06-03days on market $115,000 Active 4 DOM
-
2026-06-01days on market $115,000 Active 3 DOM
-
2026-05-31days on market $115,000 Active 2 DOM
-
2026-05-29$115,000 Active
-
2013-07-25soldstatus $35,000 192-char remark
Show marketing remark (192 chars)
Fabulous 3 Bedroom home located in City Maplewood Neighborhood. Living Room, Formal and Eat-in Kitchen. Huge 2-Car Garage, Fenced yard and more. Call listing agent for appointment. Short Sale.
-
2012-10-08$39,900 192-char remark
Show marketing remark (192 chars)
Fabulous 3 Bedroom home located in City Maplewood Neighborhood. Living Room, Formal and Eat-in Kitchen. Huge 2-Car Garage, Fenced yard and more. Call listing agent for appointment. Short Sale.
-
2004-08-19soldstatus $44,900
ⓘ Source: listings_history table (triggers on properties + properties_extension) + one-shot
backfill from property_details.listing_events for pre-trigger history.
Tax reassessment forecast NY · Partial reset (capped growth)
- Current annual tax
- $1,054 · $88/mo
- Projected year-2 tax
- $1,499 · $125/mo
- Expected delta
- +$445/yr (+$37/mo · 42.2%)
ⓘ Screening estimate from a state-policy table — verify with the county assessor before closing.
Climate risk First Street
- Flood 3/10 Moderate FEMA zone X (unshaded) · 20% chance over 30 yrs
- Wildfire 4/10 Moderate
- Heat 2/10 Low 7 d/yr ≥96°F today · 15 d/yr by 30 yrs out
- Wind 1/10 Low
- Air quality 2/10 Low 1 unhealthy d/yr today · 2 by 30 yrs out
Nearby sold comps map
Loading sold comps map…
Walkable amenities ~0.75 mi
Loading nearby amenities…
Taxation est. · year 1
- Rental income
- $19,302
- − Mortgage interest
- −$6,442
- − Property taxes
- −$1,054
- − Insurance
- −$575
- − Repairs & maintenance
- −$1,544
- − Management
- −$1,544
- − Depreciation
- −$3,345
- Taxable income
- $4,797
- Est. tax owed @ 24.0%
- −$1,151
- After-tax cash flow
- $5,231/yr
For passive investors: Depreciation is non-cash, so a rental often shows a tax loss while cash-flowing — sheltering income. Rental losses are passive: they offset passive income freely, and up to $25,000/yr can offset ordinary (W-2) income if you actively participate and your MAGI is under $100k (phasing out to $0 by $150k); unused losses carry forward. On sale, claimed depreciation is recaptured at up to 25%, and gains may owe capital-gains tax (a 1031 exchange can defer both). Figures are a year-1 estimate at your 24.0% rate — not tax advice; consult a CPA.
Schools (NCES district)
- District
- Rochester City School District
- NCES district ID
- 3624750
- Math proficiency
- 21% ▬ 0.00%
- Reading proficiency
- 26% ▲ 4.00%
- Median HH income
- $30,923
- Composite
- 18.98/100
- National rank
- #8850
- State rank
- #589 of 590 in NY
Livability — Rochester
- Score
- 76/100
- State rank
- #222
- US rank
- #3482
Category grades
Schools grade is shown separately in the Schools card above.
Census & demographics
- Census place
- Rochester, NY
- County
- Monroe County · 674,131 people
- City population
- 432,803
- Metro
- Rochester, NY
- Population (ZIP)
- 17,884
- Household income
- $51,262
- Rent vs Own
- Severe rent burden
- 1245.0
Population outlook (Monroe County) Hauer SSP2
- Today (2025)
- 759,460 people
- By 2030
- 757,154 · -0.3%
- By 2040
- 740,644 · -2.5%
- By 2050
- 714,443 · -5.9%
- By 2075
- 645,883 · -15.0%
- By 2100
- 547,084 · -28.0%
Race, ethnicity, and origin ACS 2023
- Neighborhood character
- Diverse neighborhood (Simpson 0.68)
- Race & ethnicity
- White 45% Black 27% Hispanic / Latino 20% Two or more races 9% Asian 3%
- Hispanic origin (detail)
- Puerto Rican 16% Cuban 2%
- Common ancestry
- Arab 3% Romanian 2% Subsaharan African 2%
- Foreign-born
- 10% · Canada, India, Vietnam
- Languages at home
- 81% English-only · Spanish 11% Arabic 2% Other Indo-European 2%
Political lean MEDSL · Monroe
- 2024 margin
- D (+19.1) · D 59.5% · R 40.5%
- 2008→2024 swing
- +1.4pp toward D · 2008: 17.7pp · 2024: 19.1pp
- All cycles
- 2024: D+19.1 2020: D+21.0 2016: D+14.1 2012: D+17.4 2008: D+17.7
Not yet ingested
- Civics
- —
Market trends
- HPI YoY
- ▼ -31.81%
- Current HPI
- 240.6896
- Rent YoY
- —
- Metro
- Rochester, NY
- State GDP YoY
- ▲ 2.60%
- F500 in state
- 92
Industry mix (Fortune 500 HQ in NY)
| Industry | F500 HQs | Revenue |
|---|---|---|
| Financial Services | 10 | $950B |
|
||
| Consumer Goods | 9 | $162B |
|
||
| Insurance | 4 | $225B |
|
||
| Telecommunications | 2 | $144B |
|
||
| Pharmaceuticals | 2 | $112B |
|
||
| Media / Entertainment | 2 | $69B |
|
||
Price history
+156.1% since first listed4 events — show timeline
- 2026-05-29 Listed $115,000 UNYREIS
- 2013-07-25 Sold (MLS) $35,000 UNYREIS
- 2012-10-08 Listed $39,900 UNYREIS
- 2004-08-19 Sold (Public Records) $44,900 Public Records
Property tax history
+3.7%/yrLatest (2025): $1,054 · +0.0% YoY. Source: county tax records.
Cash-flow waterfall
monthlySold comps — $/sqft
last 12 mo · ≤1 miLoading sold comps…