 Triplex
157 Lexington Ave · Dayton, OH
Flood risk No data
- FEMA flood zone
- —
- Chance of flooding over 30 yrs
- —
- Est. flood insurance / yr
- —
Fire risk No data
- Est. fire insurance / yr
- —
Heat risk No data
- Hot days now (above threshold)
- —
- Hot days in 30 yrs
- —
Wind risk No data
- Chance of severe wind over 30 yrs
- —
Air-quality risk No data
- Unhealthy air days now
- —
- Unhealthy air days in 30 yrs
- —
Risk factors via First Street. Map © Google.
Why this score? — see what drove the B grade
The composite is a weighted blend of 9 inputs, each scored 0–100. Each bar is that input's sub-score; the figure is the points it added to the 100-point composite (weight × sub-score).
- Cash flow +30.0/30.0
- ARV discount +12.6/15.0
- 1% rule +10.0/10.0
- DSCR +10.0/10.0
- Rent growth +3.5/5.0
- Livability +3.2/5.0
- Condition / age +2.5/5.0
- Schools +1.3/10.0
- Appreciation +0.0/10.0
$117,000
🖨 Deal sheet 📄 Offer letter ✓ Due diligence
Multi-family units
County records classify this as Multi-Family (2-4 Unit). Listing-text estimate: 3 units. confirmed
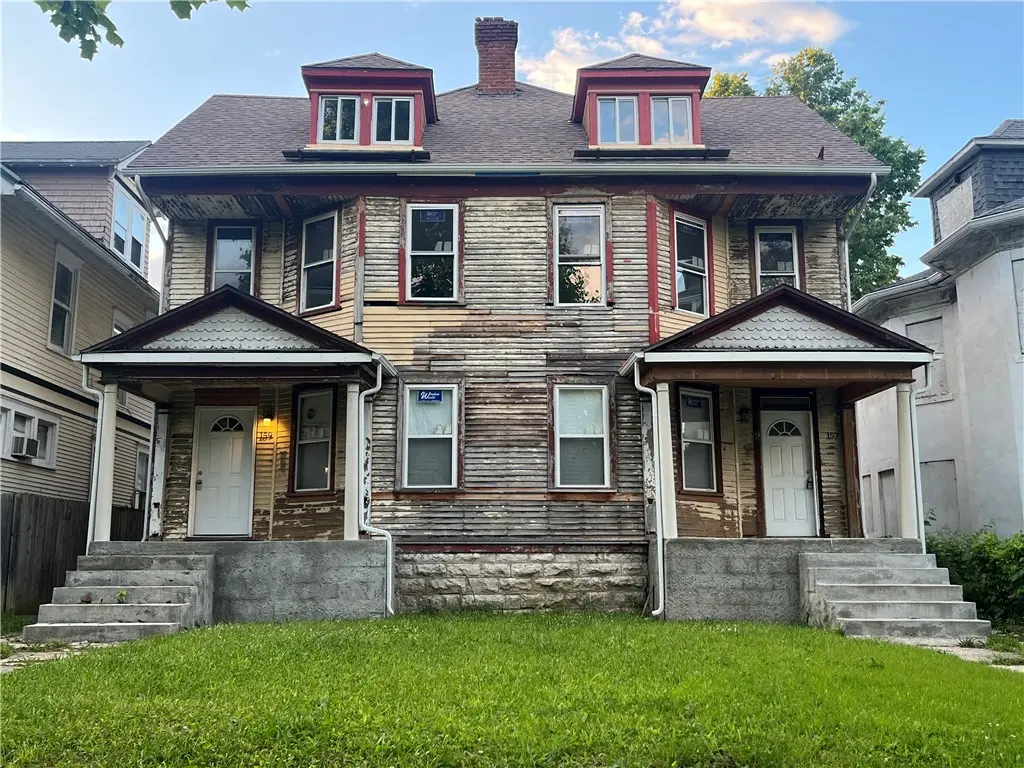
Listing remarks
Bring your vision and your contractor—this historic property is ready for its next chapter. Featuring 10 bedrooms and 4 bathrooms, the interior is already framed, offering a head start on renovation. Major updates have been completed, including new windows, new doors, updated permitted electrical, and permitted plumbing systems. The roof is roughly 10 years old and reported to be in good condition with no known leaks. The remaining work primarily involves drywall installation and interior finishes, allowing you to customize the space to your needs and preferences. Located in the Salem corridor. With its size and layout, the property offers a variety of potential. If you’ve been
Key facts
- Interior framed
- Updated electrical
- Historic property
Tags
Property features AI
Finance
- Financial info: Property is offered for sale
Exterior
- Parking: No garage; parking lot available
- Home design: Three-story building; Cedar exterior
- Construction: Cedar construction
- Exterior features: Residential zoning; Lot approximately 135 x 40 (0.1395 acres)
Interior
- Bathrooms: Five full bathrooms
- Heating & cooling: Forced-air heating
- Interior features: Double-pane windows; Walk-out basement access; Gas water heater
Neighborhood map
What this means for you Summary
Snapshot
- This is a 3 × 2-bed/?-bath units multifamily listed at $117k.
Deal economics
- At list price, monthly cash flow is $2k ($20k/yr) — positive. Per door: $549/mo.
- The deal already cash-flows at list — no discount required.
- Meets the 1% rule at list price ($3k rent vs $117k).
- Recommended offer: $113k (3.0% below list) — sets the bar for market timing.
- Cap rate 23.2% vs local median 7.4% in Dayton — top-decile yield for the area; either an underpriced asset or a hidden risk that comps aren't pricing in. Stress-test before assuming the spread holds.
Location & tenants
- Location reads 65/100 on livability (#716 in OH) — a middle-class / working-renter tenant base. Strengths: cost of living A+, housing A+, health & safety A; Watch: schools C-, amenities C-, crime F.
- Dayton City (urban): math 12% / reading 21% proficiency, ranked #641 of 656 in OH (top 98%) — low school quality limits family demand, transient renter base, plan for 1-2y turnover; 74% free/reduced lunch — lower-income household profile, screen leases tightly.
- Market conditions: Rents rising (+4.0%/yr); 83 active listings in the ZIP; 907 units permitted in Montgomery County in 2024 (416 in 5+ unit buildings).
- At $3,109/mo this rent would consume 77% of the median local household income ($48k/yr) (locally 404% of renters already pay >50% of income on rent) — very limited rent-growth headroom before tenants either downsize or default.
Forward outlook
- Local home prices are declining (-3.0%/yr); year-one equity from $809 of loan paydown is wiped out by about $4k of value loss. Plan a longer hold.
- Montgomery County population projected at -10% by 2050 — secular population decline; favor cash flow + early exit over multi-decade hold.
- At projected returns (-3.0% appreciation + 4.0% rent growth), your $33k cash investment doubles in ~2 years — after that, you're playing with house money.
Negotiation context
- It's been on market 33 days — a 3% lower offer ($113k) is reasonable based on typical stale-listing flexibility.
- 2 sale attempts with the ask held roughly flat each time — persistent listings suggest the price (not the market) is what's stuck; bring a comps-based counter.
- Current owner paid $78k; list at $117k implies a 50% gain — meaningful room to come down on a strong offer.
Risks & watch-outs
- Watch-outs: built in 1903 — expect roof / HVAC / electrical / plumbing capex.
Questions for the listing agent
- It's been on market 33 days. Have you received any prior offers? Is the seller open to a 3% concession, seller financing, or rate buy-down credit?
- Can we see the unit-by-unit rent roll, current vacancy, and any below-market leases? What's the average tenancy length?
- What capital expenditures (roof, boiler, parking lot, exteriors) have been made in the last 5 years, and what's planned in the next 2?
- Built in 1903 — when were the roof, HVAC, electrical panel, plumbing, and water heater last replaced?
- Is there a deadline driving the sale (1031 exchange, divorce, estate, relocation)? That informs how much negotiation room exists.
- Crime grade is F in this area — have there been break-ins, vandalism, or insurance claims at this property in the last 3 years? What carrier currently insures it and at what premium?
- What's the average days-on-market for RENTAL listings here right now (not sales)? A rising rental-DOM trend means longer vacancies and softer asking-rent achievability than the comps imply.
- What's the recent tenant-quality profile in this submarket — average credit score on applications, eviction rate, late-payment / NSF rate, and stable-employment percentage? A property-management company in the area should have these aggregated.
- How much new apartment / multifamily construction is in the pipeline within 1–3 miles? Heavy new supply (>2% of stock underway) typically softens rents 12–24 months out; light construction supports rent growth.
Investment metrics
- 1% rule
- 2.66% ✓
- Cap rate
- 23.19%
- Cash-on-cash
- 60.35%
- DSCR
- 3.69
- GRM
- 3.1
CMA / ARV
- ARV (median comp)
- $131,937
- List price
- $117,000
- Delta
- -11.32%
- Verdict
- UNDERPRICED
- Comps
- 20 within 1.0 mi
Show comp detail 9 sales within ~0.75 mi
| Address | Dist | Beds/Ba | Sqft | Sold | Price | $/sf | Match |
|---|---|---|---|---|---|---|---|
| 18-20 Cambridge Ave | 0.12mi | 6/2.0 | 3,196 (-0%) | 3mo | $130,000 | $41 | 92 |
| 49-51 Cambridge Ave | 0.14mi | 6/2.0 | 3,224 (+1%) | 7mo | $65,000 | $20 | 87 |
| 929 Harvard Blvd | 0.34mi | 6/2.0 | 3,349 (+4%) | 1mo | $80,000 | $24 | 76 |
| 1208 Salem #210 | 0.57mi | 6/— | 3,090 (-4%) | 4mo | $180,000 | $58 | 64 |
| 804 Harvard Blvd | 0.36mi | 6/2.0 | 2,796 (-13%) | 0mo | $65,000 | $23 | 62 |
| 1117-1119 Superior Ave #1117 | 0.39mi | 6/2.0 | 2,870 (-10%) | 4mo | $169,000 | $59 | 60 |
| 950 Harvard Blvd #946 | 0.28mi | 6/2.0 | 2,820 (-12%) | 19mo | $154,500 | $55 | 51 |
| 165 Oxford Ave | 0.19mi | 6/3.5 | 2,784 (-13%) | 22mo | $136,000 | $49 | 44 |
| 802 Ferndale Ave #800 | 0.48mi | 6/2.0 | 3,611 (+13%) | 17mo | $159,000 | $44 | 42 |
Match score weights: distance 35% · size 25% · config 20% · recency 20%. Top-matched comps best support the ARV.
Projected returns pro-forma
-3.0% appreciation · 3.98% rent growth · sell at horizon
- IRR
- 60.2%
- Equity multiple
- 3.72×
- Total profit
- $89,117
- Equity at exit
- $17,445
- IRR
- 65.3%
- Equity multiple
- 7.89×
- Total profit
- $225,868
- Equity at exit
- $10,116
Cash invested: $32,760 (down + closing). Projections, not guarantees.
Landlord ↔ Tenant lean methodology
- Overall (STATE)
- 73 Landlord-Friendly
- State Ohio
- 73 Landlord-Friendly · R+6
- County
- — inherits STATE
- City
- — inherits STATE
ZIP-level market 45402
- Rents YoY
- 4.0%
- Active inventory
- 83
- Price-to-rent
- 9.4×
Monthly cashflow live
- Estimated rent
- $3,109 high interval (Pro) →
- Mortgage (P&I)
- −$614
- Tax est. 1.5%
- −$146 /mo · $1,755/yr
- Insurance
- −$49
- HOA
- −$0
- Vacancy / Maint / Mgmt
- −$653
- Net cashflow
- $1,648
Break-even live
3-unit breakdown (identical units grouped — click to expand)
| Units | Beds | Baths | Est. rent |
|---|---|---|---|
| 3× units | 2 | — | $3,108 |
| #1 | 2 | — | $1,036 |
| #2 | 2 | — | $1,036 |
| #3 | 2 | — | $1,036 |
| Total (3 units) | $3,109 | ||
UW: 25.0% down · 7.5% · 30yr · 1.5% tax · 5.0% vac · 8.0% maint · 8.0% mgmt
Financing live
Cash to close
- Down payment
- $29,250
- Closing costs
- $3,510
- Reserves months
- —
- Total cash needed
- —
Loan-product check · same deal, 3 products live
Conventional
25% down · 7.5% · 30yr
- Down + closing
- —
- Monthly P&I
- —
- Monthly cashflow
- —
- DSCR
- —
- Eligible?
- —
Personal DTI + credit; lowest rate.
DSCR
20% down · 8.5% · 30yr
- Down + closing
- —
- Monthly P&I
- —
- Monthly cashflow
- —
- DSCR
- —
- Eligible?
- —
No personal income docs; deal must DSCR.
Hard money
10% down · 12.0% · 12mo
- Down + closing
- —
- Monthly P&I
- —
- Monthly cashflow
- —
- DSCR
- —
- Eligible?
- —
Short-term bridge; refi at stabilization.
Listing history 19 events
-
2026-06-18days on market $117,000 Active 33 DOM
-
2026-06-17days on market $117,000 Active 32 DOM
-
2026-06-16days on market $117,000 Active 31 DOM
-
2026-06-15days on market $117,000 Active 30 DOM
-
2026-06-14days on market $117,000 Active 28 DOM
-
2026-06-13days on market $117,000 Active 27 DOM
-
2026-06-10days on market $117,000 Active 25 DOM
-
2026-06-09days on market $117,000 Active 24 DOM
-
2026-06-08days on market $117,000 Active 23 DOM
-
2026-06-07days on market $117,000 Active 22 DOM
-
2026-06-05days on market $117,000 Active 19 DOM
-
2026-06-03days on market $117,000 Active 18 DOM
-
2026-06-02days on market $117,000 Active 17 DOM
-
2026-06-01days on market $117,000 Active 16 DOM
-
2026-05-31days on market $117,000 Active 15 DOM
-
2026-05-02status Pending 889-char remark
-
2026-04-29$120,000 Active 889-char remark
-
2000-04-13soldstatus $78,000
-
1996-08-01soldstatus $41,500
ⓘ Source: listings_history table (triggers on properties + properties_extension) + one-shot
backfill from property_details.listing_events for pre-trigger history.
Nearby sold comps map
Loading sold comps map…
Walkable amenities ~0.75 mi
Loading nearby amenities…
Taxation est. · year 1
- Rental income
- $37,308
- − Mortgage interest
- −$6,554
- − Property taxes
- −$1,755
- − Insurance
- −$585
- − Repairs & maintenance
- −$2,985
- − Management
- −$2,985
- − Depreciation
- −$3,404
- Taxable income
- $19,041
- Est. tax owed @ 24.0%
- −$4,570
- After-tax cash flow
- $15,201/yr
For passive investors: Depreciation is non-cash, so a rental often shows a tax loss while cash-flowing — sheltering income. Rental losses are passive: they offset passive income freely, and up to $25,000/yr can offset ordinary (W-2) income if you actively participate and your MAGI is under $100k (phasing out to $0 by $150k); unused losses carry forward. On sale, claimed depreciation is recaptured at up to 25%, and gains may owe capital-gains tax (a 1031 exchange can defer both). Figures are a year-1 estimate at your 24.0% rate — not tax advice; consult a CPA.
Schools (NCES district)
- District
- Dayton City
- NCES district ID
- 3904384
- Math proficiency
- 12% ▼ -12.00%
- Reading proficiency
- 21% ▼ -11.00%
- Median HH income
- $28,688
- Composite
- 12.94/100
- National rank
- #9579
- State rank
- #641 of 656 in OH
Livability — Dayton
- Score
- 65/100
- State rank
- #716
- US rank
- #12895
Category grades
Schools grade is shown separately in the Schools card above.
Census & demographics
- Census place
- Dayton, OH
- County
- Montgomery County · 459,541 people
- City population
- 164,387
- Metro
- Dayton-Kettering, OH
- Population (ZIP)
- 9,407
- Household income
- $48,401
- Rent vs Own
- Severe rent burden
- 404.0
Population outlook (Montgomery County) Hauer SSP2
- Today (2025)
- 523,241 people
- By 2030
- 514,948 · -1.6%
- By 2040
- 493,378 · -5.7%
- By 2050
- 469,639 · -10.2%
- By 2075
- 418,360 · -20.0%
- By 2100
- 353,315 · -32.5%
Race, ethnicity, and origin ACS 2023
- Neighborhood character
- Diverse neighborhood (Simpson 0.57)
- Race & ethnicity
- Black 57% White 32% Two or more races 7% Hispanic / Latino 5%
- Hispanic origin (detail)
- Mexican 1%
- Common ancestry
- Italian 2% Serbian 2% Slovak 1%
- Foreign-born
- 5% · Canada, Vietnam, Jamaica
- Languages at home
- 94% English-only · Spanish 4% Other Asian/Pacific 1% Arabic 1%
Political lean MEDSL · Montgomery
- 2024 margin
- Toss-up / Even · D 49.8% · R 49.3%
- 2008→2024 swing
- -5.8pp toward R · 2008: 6.2pp · 2024: 0.5pp
- All cycles
- 2024: D+0.5 2020: D+2.2 2016: R+1.2 2012: D+3.1 2008: D+6.2
Not yet ingested
- Civics
- —
Market trends
- HPI YoY
- ▼ -81.89%
- Current HPI
- 149.7909
- Rent YoY
- ▲ 3.98%
- Metro
- Dayton-Kettering, OH
- State GDP YoY
- ▲ 1.98%
- F500 in state
- 48
Industry mix (Fortune 500 HQ in OH)
| Industry | F500 HQs | Revenue |
|---|---|---|
| Insurance | 3 | $145B |
|
||
| Industrial Machinery | 3 | $49B |
|
||
| Financial Services | 3 | $24B |
|
||
| Consumer Goods | 2 | $93B |
|
||
| Aerospace / Defense | 2 | $47B |
|
||
| Utilities | 2 | $33B |
|
||
Price history
+181.9% since first listed6 events — show timeline
- 2026-05-27 Price Changed $117,000 Dayton MLS
- 2026-05-19 Relisted — Dayton MLS
- 2026-05-02 Pending — Dayton MLS
- 2026-04-29 Listed $120,000 Dayton MLS
- 2000-04-13 Sold (Public Records) $78,000 Public Records
- 1996-08-01 Sold (Public Records) $41,500 Public Records
Property tax history
-8.2%/yrLatest (2025): $193 · +153.0% YoY. Source: county tax records.
Cash-flow waterfall
monthlySold comps — $/sqft
last 12 mo · ≤1 miLoading sold comps…