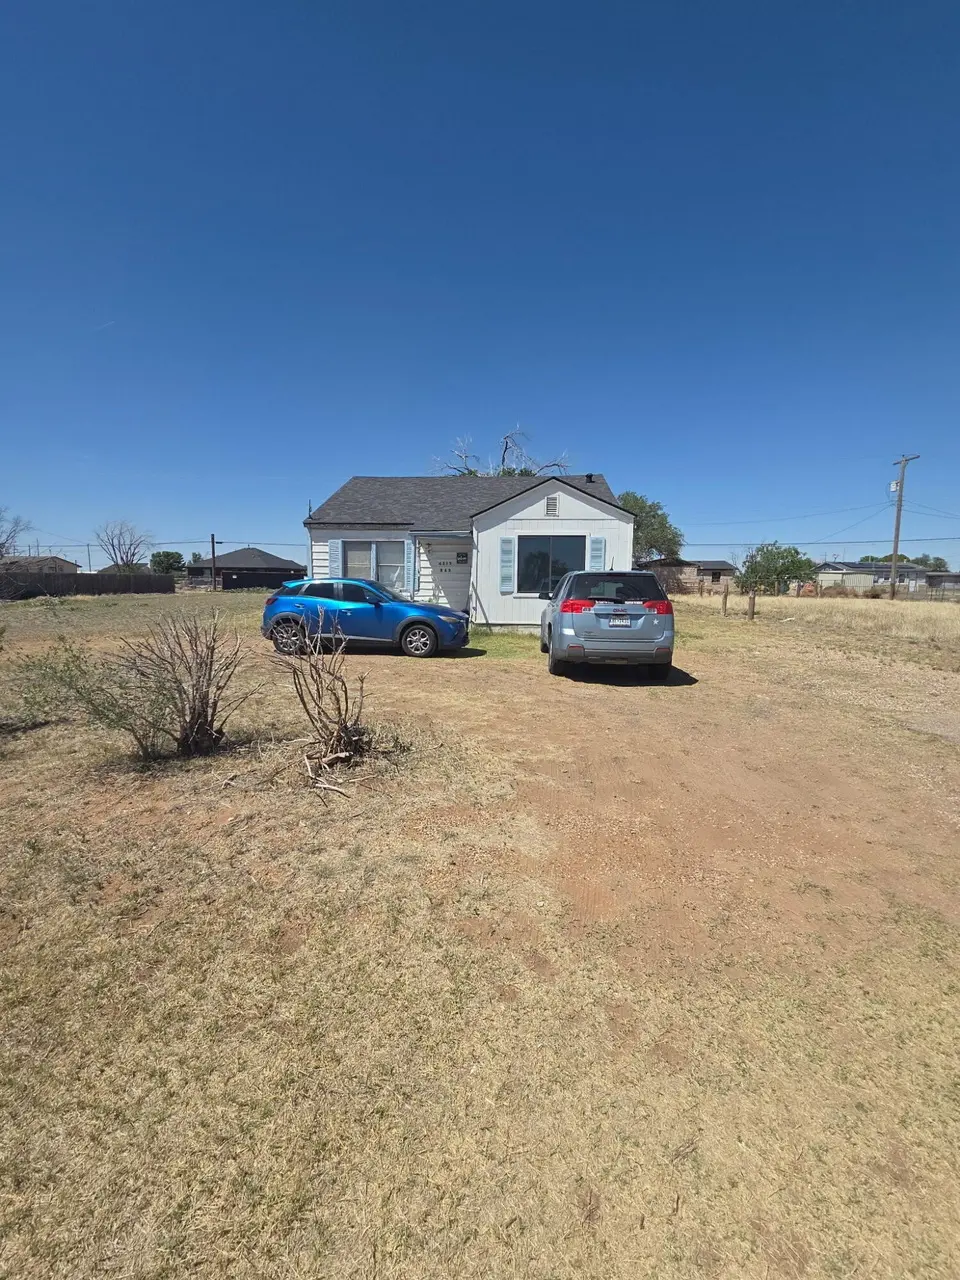
4215 E 65th St · Lubbock, TX
Flood risk 1/10 · Minimal
- FEMA flood zone
- X (unshaded)
- Chance of flooding over 30 yrs
- 0.0%
- Est. flood insurance / yr
- $507 – $1,088
Fire risk 7/10 · Major
- Est. fire insurance / yr
- $1,222 – $2,270
Heat risk 5/10 · Moderate
- Hot days now (above 100°F)
- 7 days/yr
- Hot days in 30 yrs
- 21 days/yr
Wind risk 2/10 · Minimal
- Chance of severe wind over 30 yrs
- 2.0%
Air-quality risk 1/10 · Minimal
- Unhealthy air days now
- 0 days/yr
- Unhealthy air days in 30 yrs
- 0 days/yr
Risk factors via First Street. Map © Google.
Why this score? — see what drove the B grade
The composite is a weighted blend of 9 inputs, each scored 0–100. Each bar is that input's sub-score; the figure is the points it added to the 100-point composite (weight × sub-score).
- Cash flow +30.0/30.0
- 1% rule +10.0/10.0
- DSCR +10.0/10.0
- ARV discount +7.5/15.0
- Livability +4.0/5.0
- Schools +3.1/10.0
- Rent growth +2.9/5.0
- Condition / age +2.5/5.0
- Appreciation +0.0/10.0
$65,000
🖨 Deal sheet 📄 Offer letter ✓ Due diligence
Listing remarks
Welcome to 4215 E 65th Street — a well-maintained home located in an established area of Lubbock. This inviting property offers a functional layout with comfortable living spaces, making it a great fit for homeowners or investors alike. Step inside to a bright and welcoming living area filled with natural light, creating a warm and relaxed atmosphere. The kitchen features ample cabinet storage and counter space and flows easily into the dining area, making it ideal for everyday living and entertaining. The bedrooms are well-sized and provide flexibility for family, guests, or a home office. Outside, enjoy a spacious backyard with plenty of room to relax, entertain, or customize to you
Key facts
- 7,200 sq ft lot
- Built 1945
- Listed 47 days
Property features AI
Finance
- Other: Property located on a 0.17-acre lot
Exterior
- Parking: Off-street parking; On-street parking
- Home design: Single-family residence; Residential property
- Construction: Wood siding; Pillar/post/pier foundation; Composition roof; Built with above-grade finished area of 992
- Exterior features: Private yard; Concrete and paved road access
Interior
- Bathrooms: 1 full bathroom
- Heating & cooling: Natural gas heating; Ceiling fans and electric cooling
- Interior features: Ceiling fan(s)
Neighborhood map
What this means for you Summary
Snapshot
- This is a 3-bed/1.0-bath single-family listed at $65k.
Deal economics
- At list price, monthly cash flow is $513 ($6k/yr) — positive.
- The deal already cash-flows at list — no discount required.
- Meets the 1% rule at list price ($1k rent vs $65k).
- Recommended offer: $63k (3.0% below list) — sets the bar for market timing.
Location & tenants
- Location reads 80/100 on livability (#37 in TX, #1,749 nationally) — a professional / high-income tenant draw. Strengths: commute A+, cost of living A+, housing A+; Watch: employment C-, schools D+, crime F.
- Lubbock ISD (urban): math 36% / reading 39% proficiency, ranked #481 of 826 in TX (top 58%) — families likely to look elsewhere, expect single-tenant / working-renter base with shorter leases; 60% free/reduced lunch — lower-income household profile, screen leases tightly.
- Market conditions: Rents rising (+1.5%/yr); 165 active listings in the ZIP; 2,219 units permitted in Lubbock County in 2024 (252 in 5+ unit buildings).
- This rent runs 31% of the median local income ($48k/yr) — at the standard rent-burdened threshold; future hikes will face affordability resistance.
Forward outlook
- Local home prices are declining (-3.0%/yr); year-one equity from $449 of loan paydown is wiped out by about $2k of value loss. Plan a longer hold.
- Lubbock County population projected at +39% by 2050 — long-run rental-demand tailwind backs the buy-and-hold thesis.
- At projected returns (-3.0% appreciation + 1.5% rent growth), your $18k cash investment doubles in ~4 years — after that, you're playing with house money.
Negotiation context
- It's been on market 47 days — a 3% lower offer ($63k) is reasonable based on typical stale-listing flexibility.
- 4 sale attempts since 2y ago with the ask held roughly flat each time — persistent listings suggest the price (not the market) is what's stuck; bring a comps-based counter.
Risks & watch-outs
- Watch-outs: built in 1945 — expect roof / HVAC / electrical / plumbing capex.
- Climate carrying-cost: major wildfire risk; extreme-heat days projected 7→21/yr by 2055 (HVAC capex compounding) — expect insurance premiums to compound above CPI over the hold.
Questions for the listing agent
- It's been on market 47 days. Have you received any prior offers? Is the seller open to a 3% concession, seller financing, or rate buy-down credit?
- Built in 1945 — when were the roof, HVAC, electrical panel, plumbing, and water heater last replaced?
- Is there a deadline driving the sale (1031 exchange, divorce, estate, relocation)? That informs how much negotiation room exists.
- Schools are D-rated, which usually means shorter tenancies and higher turnover. Who's the typical renter profile here, and what's been the actual vacancy rate?
- Crime grade is F in this area — have there been break-ins, vandalism, or insurance claims at this property in the last 3 years? What carrier currently insures it and at what premium?
- What's the average days-on-market for RENTAL listings here right now (not sales)? A rising rental-DOM trend means longer vacancies and softer asking-rent achievability than the comps imply.
- What's the recent tenant-quality profile in this submarket — average credit score on applications, eviction rate, late-payment / NSF rate, and stable-employment percentage? A property-management company in the area should have these aggregated.
- How much new for-sale + rental construction is in the pipeline within 1–3 miles? Heavy new supply typically softens prices + rents 12–24 months out; constrained supply supports both.
Investment metrics
- 1% rule
- 1.93% ✓
- Cap rate
- 15.76%
- Cash-on-cash
- 33.81%
- DSCR
- 2.50
- GRM
- 4.3
CMA / ARV
No comps found within radius.
Projected returns pro-forma
-3.0% appreciation · 1.52% rent growth · sell at horizon
- IRR
- 27.4%
- Equity multiple
- 2.12×
- Total profit
- $20,324
- Equity at exit
- $9,692
- IRR
- 34.0%
- Equity multiple
- 3.89×
- Total profit
- $52,577
- Equity at exit
- $5,620
Cash invested: $18,200 (down + closing). Projections, not guarantees.
Landlord ↔ Tenant lean methodology
- Overall (STATE)
- 87 Strongly Landlord-Friendly
- State Texas
- 87 Strongly Landlord-Friendly · R+5
- County
- — inherits STATE
- City
- — inherits STATE
ZIP-level market 79403
- Home prices YoY
- -9.0%
- Rents YoY
- 1.5%
- Active inventory
- 165
- Price-to-rent
- 4.3×
Monthly cashflow live
- Estimated rent
- $1,252 medium interval (Pro) →
- Mortgage (P&I)
- −$341
- Tax from tax record
- −$108 /mo · $1,299/yr
- Insurance
- −$27
- HOA
- −$0
- Vacancy / Maint / Mgmt
- −$263
- Net cashflow
- $513
Break-even live
UW: 25.0% down · 7.5% · 30yr · 1.5% tax · 5.0% vac · 8.0% maint · 8.0% mgmt
Financing live
Cash to close
- Down payment
- $16,250
- Closing costs
- $1,950
- Reserves months
- —
- Total cash needed
- —
Loan-product check · same deal, 3 products live
Conventional
25% down · 7.5% · 30yr
- Down + closing
- —
- Monthly P&I
- —
- Monthly cashflow
- —
- DSCR
- —
- Eligible?
- —
Personal DTI + credit; lowest rate.
DSCR
20% down · 8.5% · 30yr
- Down + closing
- —
- Monthly P&I
- —
- Monthly cashflow
- —
- DSCR
- —
- Eligible?
- —
No personal income docs; deal must DSCR.
Hard money
10% down · 12.0% · 12mo
- Down + closing
- —
- Monthly P&I
- —
- Monthly cashflow
- —
- DSCR
- —
- Eligible?
- —
Short-term bridge; refi at stabilization.
Listing history 26 events
-
2026-06-16status $65,000 Pending 47 DOM
-
2026-06-16days on market $65,000 Active 47 DOM
-
2026-06-15days on market $65,000 Active 46 DOM
-
2026-06-14days on market $65,000 Active 44 DOM
-
2026-06-13days on market $65,000 Active 43 DOM
-
2026-06-10days on market $65,000 Active 41 DOM
-
2026-06-09days on market $65,000 Active 40 DOM
-
2026-06-08days on market $65,000 Active 39 DOM
-
2026-06-07days on market $65,000 Active 38 DOM
-
2026-06-05days on market $65,000 Active 35 DOM
-
2026-06-03days on market $65,000 Active 34 DOM
-
2026-06-02days on market $65,000 Active 33 DOM
-
2026-06-01days on market $65,000 Active 32 DOM
-
2026-05-31days on market $65,000 Active 31 DOM
-
2026-05-30days on market $65,000 Active 30 DOM
-
2026-04-30$65,000 Active 1063-char remark
-
2025-08-21price $850
-
2025-08-09price $1,000
-
2025-08-08price $1,300
-
2025-08-05price $1,000
-
2025-06-06$1,300
-
2024-05-05historical $825
-
2024-04-15$825
-
2024-04-12historical $900
-
2024-01-10$900
-
2023-10-16soldstatus
ⓘ Source: listings_history table (triggers on properties + properties_extension) + one-shot
backfill from property_details.listing_events for pre-trigger history.
Tax reassessment forecast TX · Resets to sale price
- Current annual tax
- $1,299 · $108/mo
- Projected year-2 tax
- $1,299 · $108/mo
- Expected delta
- $0/yr ($0/mo · 0.0%)
ⓘ Screening estimate from a state-policy table — verify with the county assessor before closing.
Climate risk First Street
- Flood 1/10 Low FEMA zone X (unshaded) · 0% chance over 30 yrs
- Wildfire 7/10 Severe
- Heat 5/10 Major 7 d/yr ≥100°F today · 21 d/yr by 30 yrs out
- Wind 2/10 Low 2% chance of damaging wind over 30 yrs
- Air quality 1/10 Low 0 unhealthy d/yr today · 0 by 30 yrs out
Nearby sold comps map
Loading sold comps map…
Walkable amenities ~0.75 mi
Loading nearby amenities…
Taxation est. · year 1
- Rental income
- $15,022
- − Mortgage interest
- −$3,641
- − Property taxes
- −$1,299
- − Insurance
- −$325
- − Repairs & maintenance
- −$1,202
- − Management
- −$1,202
- − Depreciation
- −$1,891
- Taxable income
- $5,463
- Est. tax owed @ 24.0%
- −$1,311
- After-tax cash flow
- $4,842/yr
For passive investors: Depreciation is non-cash, so a rental often shows a tax loss while cash-flowing — sheltering income. Rental losses are passive: they offset passive income freely, and up to $25,000/yr can offset ordinary (W-2) income if you actively participate and your MAGI is under $100k (phasing out to $0 by $150k); unused losses carry forward. On sale, claimed depreciation is recaptured at up to 25%, and gains may owe capital-gains tax (a 1031 exchange can defer both). Figures are a year-1 estimate at your 24.0% rate — not tax advice; consult a CPA.
Schools (NCES district)
- District
- Lubbock ISD
- NCES district ID
- 4828500
- Math proficiency
- 36% ▼ -8.00%
- Reading proficiency
- 39% ▼ -1.00%
- Median HH income
- $39,820
- Composite
- 31.44/100
- National rank
- #5984
- State rank
- #481 of 826 in TX
Livability — Lubbock
- Score
- 80/100
- State rank
- #37
- US rank
- #1749
Category grades
Schools grade is shown separately in the Schools card above.
Census & demographics
- Census place
- Lubbock, TX
- County
- Lubbock County · 293,542 people
- City population
- 283,030
- Metro
- Lubbock, TX
- Population (ZIP)
- 16,089
- Household income
- $47,907
- Rent vs Own
- Severe rent burden
- 612.0
Population outlook (Lubbock County) Hauer SSP2
- Today (2025)
- 345,960 people
- By 2030
- 371,449 · +7.4%
- By 2040
- 424,539 · +22.7%
- By 2050
- 481,150 · +39.1%
- By 2075
- 633,467 · +83.1%
- By 2100
- 746,853 · +115.9%
Race, ethnicity, and origin ACS 2023
- Neighborhood character
- Diverse neighborhood (Simpson 0.64)
- Race & ethnicity
- Hispanic / Latino 49% White 26% Black 23% Two or more races 16% Native American 1%
- Hispanic origin (detail)
- Mexican 35%
- Common ancestry
- Slovak 1%
- Foreign-born
- 3% · Canada
- Languages at home
- 74% English-only · Spanish 25%
Political lean MEDSL · Lubbock
- 2024 margin
- Solid R (+39.5) · D 29.7% · R 69.2% · Other 1.0%
- 2008→2024 swing
- -2.8pp toward R · 2008: -36.7pp · 2024: -39.5pp
- All cycles
- 2024: R+39.5 2020: R+32.2 2016: R+38.4 2012: R+40.9 2008: R+36.7
Not yet ingested
- Civics
- —
Market trends
- HPI YoY
- ▼ -17.69%
- Current HPI
- 178.9297
- Rent YoY
- ▲ 1.52%
- Metro
- Lubbock, TX
- State GDP YoY
- ▲ 3.95%
- F500 in state
- 110
Industry mix (Fortune 500 HQ in TX)
| Industry | F500 HQs | Revenue |
|---|---|---|
| Energy | 16 | $1,198B |
|
||
| Technology | 5 | $198B |
|
||
| Engineering / Construction | 4 | $72B |
|
||
| Energy Services | 3 | $60B |
|
||
| Utilities | 3 | $41B |
|
||
| Healthcare | 2 | $330B |
|
||
Price history
+4900.0% since first listed12 events — show timeline
- 2026-06-16 Pending — LARMLS
- 2026-04-30 Listed $65,000 LARMLS
- 2025-08-21 Price Changed $850 LARMLS
- 2025-08-09 Price Changed $1,000 LARMLS
- 2025-08-08 Price Changed $1,300 LARMLS
- 2025-08-05 Price Changed $1,000 LARMLS
- 2025-06-06 Listed for Rent $1,300 LARMLS
- 2024-05-05 Rental Removed $825 APPFOLIO
- 2024-04-15 Listed for Rent $825 APPFOLIO
- 2024-04-12 Rental Removed $900 LARMLS
- 2024-01-10 Listed for Rent $900 LARMLS
- 2023-10-16 Sold (Public Records) — Public Records
Property tax history
+5.2%/yrLatest (2025): $1,299 · -8.9% YoY. Source: county tax records.
Cash-flow waterfall
monthlySold comps — $/sqft
last 12 mo · ≤1 miLoading sold comps…