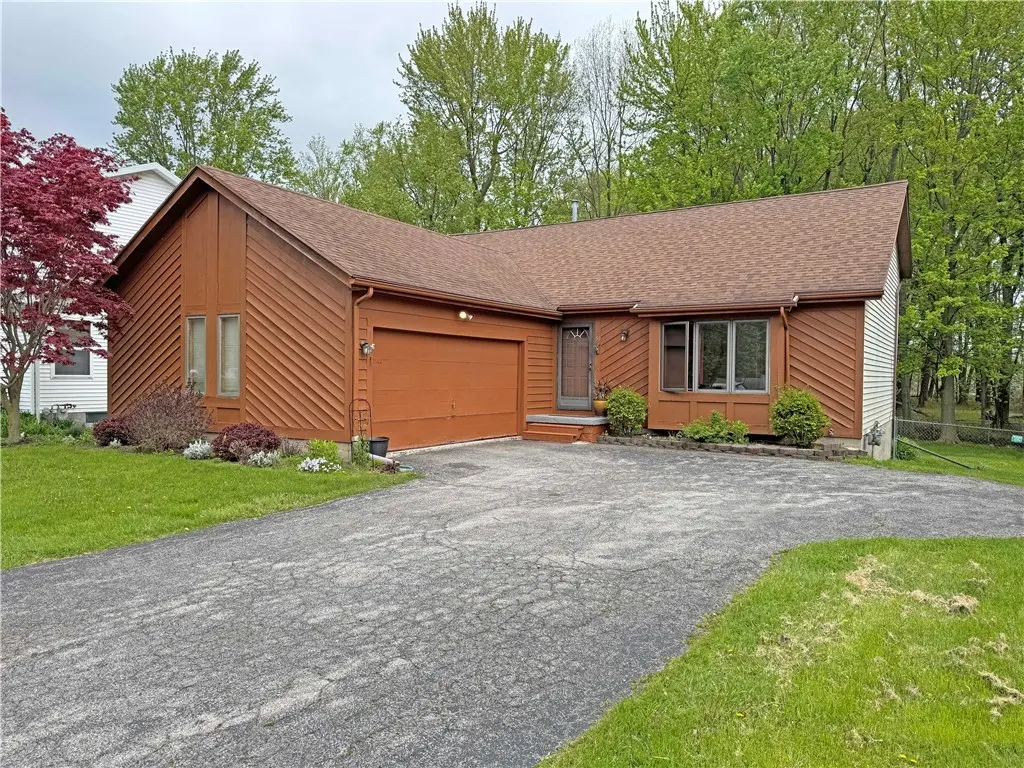
50 Dolman Dr · Gates, NY
Flood risk 1/10 · Minimal
- FEMA flood zone
- X (unshaded)
- Chance of flooding over 30 yrs
- 0.0%
- Est. flood insurance / yr
- $473 – $860
Fire risk 3/10 · Minor
- Est. fire insurance / yr
- $691 – $1,283
Heat risk 2/10 · Minimal
- Hot days now (above 96°F)
- 7 days/yr
- Hot days in 30 yrs
- 15 days/yr
Wind risk 1/10 · Minimal
- Chance of severe wind over 30 yrs
- —
Air-quality risk 2/10 · Minimal
- Unhealthy air days now
- 1 days/yr
- Unhealthy air days in 30 yrs
- 1 days/yr
Risk factors via First Street. Map © Google.
Why this score? — see what drove the D- grade
The composite is a weighted blend of 9 inputs, each scored 0–100. Each bar is that input's sub-score; the figure is the points it added to the 100-point composite (weight × sub-score).
- ARV discount +15.0/15.0
- Cash flow +5.9/30.0
- 1% rule +3.6/10.0
- Schools +3.6/10.0
- Livability +3.4/5.0
- Rent growth +2.5/5.0
- Condition / age +2.5/5.0
- DSCR +0.3/10.0
- Appreciation +0.0/10.0
$189,900
🖨 Deal sheet (PDF) 📄 Offer letter ✓ Due diligence
Listing remarks
Opportunity Knocks! * Estate Sale - Priced Over $46,000 Below Assessed Value! * Attractive Contemporary Split Level Design With Full Walkout Lower Level. * Living Room With Vaulted Ceiling. * Large Eat-In Kitchen with Vaulted Ceiling. * Two Spacious Bedrooms Upstairs With Nice Bathroom. * Lower Walkout Level Has A Spacious Family Room With Sliders To Rear Yard That Could Easily Be Partitioned To Accommodate A 3rd Bedroom. * Spacious Laundry/Utility/Workshop Room On Lower Level. * Large 488' Deep Fenced Backyard Including Wooded Area. * Delayed Negotiations Until Monday 5/18 At 4:00 PM.
Key facts
- Walkout lower level
- Vaulted ceiling
- Eat-in kitchen
Tags
Property features AI
Exterior
- Parking: Attached garage with 2 spaces; Garage door opener; Driveway; Electric in garage; Garage storage
- Utilities: Public water connected; Sewer connected; Circuit breaker electric; Cable available; High-speed internet available
- Home design: Single-story home; Resale property; Walk-out basement; Rectangular, wooded lot; City street frontage; Entry level: main floor
- Construction: Cedar, vinyl and wood siding; Architectural shingle roof; Block foundation; Existing construction; Copper plumbing
- Exterior features: Deck; Fully fenced yard; Blacktop driveway; Shed(s)/outdoor storage; Storage
Interior
- Kitchen: Electric oven; Electric range; Dishwasher; Refrigerator; Eat-in kitchen
- Bedrooms: Convertible bedroom (can be used as a bedroom)
- Flooring: Hardwood; Carpet; Vinyl; Varied flooring
- Bathrooms: 1 full bathroom
- Heating & cooling: Gas forced-air heating; Central air conditioning
- Interior features: Ceiling fan(s); Entrance foyer; Eat-in kitchen; Separate/formal living room; Sliding glass door(s); Storage; Convertible bedroom; Thermal windows; Sliding doors
- Laundry & utility: Washer and dryer; Laundry located in basement; Gas water heater
Neighborhood map
What this means for you Summary
Snapshot
- This is a 2-bed/1.0-bath single-family listed at $190k.
Deal economics
- At list price, monthly cash flow is $-369 ($-4k/yr) — negative.
- To cash-flow at today's rent, offer at most $139k (26.6% below list).
- To meet the 1% rule (rent ≥ 1% of price), the offer needs to be $163k (14.2% below list).
- Recommended offer: $139k (26.6% below list) — sets the bar for cash-flow.
- Cap rate 4.0% vs local median 5.9% in Gates — below-typical yield; the buyer is paying a premium for something (appreciation thesis, condition, location) that the cap rate doesn't capture.
Location & tenants
- Location reads 67/100 on livability (#582 in NY) — a middle-class / working-renter tenant base. Strengths: housing A+, health & safety A+; Watch: amenities F, commute F.
- Gates-Chili Central School District (suburban): math 41% / reading 42% proficiency, ranked #491 of 590 in NY (top 83%) — families likely to look elsewhere, expect single-tenant / working-renter base with shorter leases.
- Zoned schools: Paul Road School (math 32% / reading 42%, grade F, #1,519 of 2,108 statewide, top 74%, 430 students, 42% FRL); Gates-Chili Middle School (math 25% / reading 40%, grade F, #504 of 729 statewide, top 70%, 854 students, 58% FRL); Gates-Chili High School (math 92% / reading 70%, grade A, #495 of 1,100 statewide, top 46%, 1,132 students, 55% FRL) — zoned schools average 52% FRL vs 31% district-wide (21 pts higher); higher-poverty schools than district average — tighter screening recommended.
- Market conditions: 127 active listings in the ZIP; 2 comparable units currently listed for rent nearby; solid renter incomes; 1,169 units permitted in Monroe County in 2024 (591 in 5+ unit buildings).
Forward outlook
- Local home prices are declining (-3.0%/yr); year-one equity from $1k of loan paydown is wiped out by about $6k of value loss. Plan a longer hold.
- Monroe County population projected to shrink 6% by 2050 — rents likely to lag national; underwrite the cash flow, not the appreciation.
Negotiation context
- Only 7 days on market — expect competitive offers; lowballing is unlikely to land.
- Current owner paid $98k; list at $190k implies a 93% gain — meaningful room to come down on a strong offer.
Risks & watch-outs
- Watch-outs: property tax is 3.7% of price.
Questions for the listing agent
- What do current leases actually rent for vs. the listed asking? Can we see a recent rent roll and the last 12 months of T-12 income?
- Property tax is high relative to price — has the assessment been appealed recently, and will the sale trigger a re-assessment?
- Is there a deadline driving the sale (1031 exchange, divorce, estate, relocation)? That informs how much negotiation room exists.
- Schools are B-rated — typically a magnet for longer-tenancy family renters. What's the average tenant stay here, and is there a school-zone premium baked into asking?
- The area grade is low — what's the realistic commute time and amenity access for the typical tenant pool here? Any planned neighborhood developments (good or bad) we should know about?
- What's the average days-on-market for RENTAL listings here right now (not sales)? A rising rental-DOM trend means longer vacancies and softer asking-rent achievability than the comps imply.
- What's the recent tenant-quality profile in this submarket — average credit score on applications, eviction rate, late-payment / NSF rate, and stable-employment percentage? A property-management company in the area should have these aggregated.
- How much new for-sale + rental construction is in the pipeline within 1–3 miles? Heavy new supply typically softens prices + rents 12–24 months out; constrained supply supports both.
Investment metrics
- 1% rule
- 0.86% ✗
- Cap rate
- 3.96%
- Cash-on-cash
- -8.32%
- DSCR
- 0.63
- GRM
- 9.7
CMA / ARV
- ARV (median comp)
- $272,910
- List price
- $189,900
- Delta
- -30.42%
- Verdict
- UNDERPRICED
- Comps
- 20 within 1.0 mi
Show comp detail 12 sales within ~0.75 mi
| Address | Dist | Beds/Ba | Sqft | Sold | Price | $/sf | Match |
|---|---|---|---|---|---|---|---|
| 58 Cheshire Ln | 0.12mi | 3/1.5 (+1) | 1,700 (-4%) | 11mo | $315,000 | $185 | 72 |
| 47 Dolman Dr | 0.04mi | 3/1.5 (+1) | 1,706 (-4%) | 19mo | $230,000 | $135 | 70 |
| 1636 Chili Ave | 0.61mi | 3/1.0 (+1) | 1,800 (+2%) | 1mo | $235,000 | $131 | 63 |
| 1425 Chili Ave | 0.53mi | 3/1.5 (+1) | 1,802 (+2%) | 11mo | $212,000 | $118 | 56 |
| 170 Hinchey Rd | 0.40mi | 3/1.5 (+1) | 1,680 (-5%) | 17mo | $185,000 | $110 | 52 |
| 5 Ellis Dr | 0.64mi | 3/2.0 (+1) | 1,698 (-4%) | 4mo | $241,000 | $142 | 51 |
| 56 Ellis Dr | 0.67mi | 3/1.5 (+1) | 1,618 (-8%) | 2mo | $240,600 | $149 | 45 |
| 57 Cheshire Ln | 0.15mi | 3/1.5 (+1) | 1,544 (-13%) | 23mo | $301,000 | $195 | 45 |
| 1433 Chili Ave | 0.53mi | 3/1.5 (+1) | 1,870 (+6%) | 18mo | $162,000 | $87 | 44 |
| 36 Merrydale Dr | 0.37mi | 3/3.0 (+1) | 1,562 (-12%) | 11mo | $240,000 | $154 | 41 |
| 595 Hinchey Rd | 0.70mi | 3/1.5 (+1) | 2,032 (+15%) | 6mo | $180,000 | $89 | 30 |
| 37 Avanti Dr | 0.68mi | 3/2.5 (+1) | 1,507 (-15%) | 19mo | $232,000 | $154 | 17 |
Match score weights: distance 35% · size 25% · config 20% · recency 20%. Top-matched comps best support the ARV.
Projected returns pro-forma
-3.0% appreciation · 3.0% rent growth · sell at horizon
- IRR
- -30.8%
- Equity multiple
- -0.02×
- Total profit
- $-54,023
- Equity at exit
- $28,315
- IRR
- -32.5%
- Equity multiple
- -0.44×
- Total profit
- $-76,328
- Equity at exit
- $16,419
Cash invested: $53,172 (down + closing). Projections, not guarantees.
Landlord ↔ Tenant lean methodology
- Overall (STATE)
- 15 Strongly Tenant-Friendly
- State New York
- 15 Strongly Tenant-Friendly · D+10
- County
- — inherits STATE
- City
- — inherits STATE
ZIP-level market 14624
- Active inventory
- 127
- Price-to-rent
- 9.7×
Monthly cashflow live
- Estimated rent
- $1,629 medium interval (Pro) →
- Mortgage (P&I)
- −$996
- Tax from tax record
- −$581 /mo · $6,970/yr
- Insurance
- −$79
- HOA
- −$0
- Vacancy / Maint / Mgmt
- −$342
- Net cashflow
- $-369
Break-even live
Sensitivity live
| Price | -10% $-261 | -5% $-315 | +0% $-369 | +5% $-423 | +10% $-476 |
|---|---|---|---|---|---|
| Rent | -10% $-497 | -5% $-433 | +0% $-369 | +5% $-304 | +10% $-240 |
| Rate | -1.0pp $-273 | -0.5pp $-320 | base $-369 | +0.5pp $-418 | +1.0pp $-468 |
UW: 25.0% down · 7.5% · 30yr · 1.5% tax · 5.0% vac · 8.0% maint · 8.0% mgmt
Financing live
Cash to close
- Down payment
- $47,475
- Closing costs
- $5,697
- Reserves months
- —
- Total cash needed
- —
Loan-product check · same deal, 3 products live
Conventional
25% down · 7.5% · 30yr
- Down + closing
- —
- Monthly P&I
- —
- Monthly cashflow
- —
- DSCR
- —
- Eligible?
- —
Personal DTI + credit; lowest rate.
DSCR
20% down · 8.5% · 30yr
- Down + closing
- —
- Monthly P&I
- —
- Monthly cashflow
- —
- DSCR
- —
- Eligible?
- —
No personal income docs; deal must DSCR.
Hard money
10% down · 12.0% · 12mo
- Down + closing
- —
- Monthly P&I
- —
- Monthly cashflow
- —
- DSCR
- —
- Eligible?
- —
Short-term bridge; refi at stabilization.
Rent comps 2 comps
| Address | Beds | Baths | Sqft | Rent | $/sqft | DOM | Units | Dist |
|---|---|---|---|---|---|---|---|---|
| 32 Stanton St Rochester, NY | 3.0 | 1.0 | 1390 | $1,500 | $1.08 | 12d | 1 | 0.86mi |
| 132 Anthony St Rochester, NY | 3.0 | 1.0 | 1260 | $1,500 | $1.19 | 5d | 1 | 1.46mi |
Listing history 2 events
-
2026-05-13$189,900 Active 603-char remark
-
2002-03-04soldstatus $98,500
ⓘ Source: listings_history table (triggers on properties + properties_extension) + one-shot
backfill from property_details.listing_events for pre-trigger history.
Tax reassessment forecast NY · Partial reset (capped growth)
- Current annual tax
- $6,970 · $581/mo
- Projected year-2 tax
- $6,970 · $581/mo
- Expected delta
- $0/yr ($0/mo · 0.0%)
ⓘ Screening estimate from a state-policy table — verify with the county assessor before closing.
Climate risk First Street
- Flood 1/10 Low FEMA zone X (unshaded) · 0% chance over 30 yrs
- Wildfire 3/10 Moderate
- Heat 2/10 Low 7 d/yr ≥96°F today · 15 d/yr by 30 yrs out
- Wind 1/10 Low
- Air quality 2/10 Low 1 unhealthy d/yr today · 1 by 30 yrs out
Nearby sold comps map
Loading sold comps map…
Walkable amenities ~0.75 mi
Loading nearby amenities…
Taxation est. · year 1
- Rental income
- $19,550
- − Mortgage interest
- −$10,637
- − Property taxes
- −$6,970
- − Insurance
- −$950
- − Repairs & maintenance
- −$1,564
- − Management
- −$1,564
- − Depreciation
- −$5,524
- Taxable loss
- −$7,659
- Est. tax savings @ 24.0%
- +$1,838
- After-tax cash flow
- $-2,587/yr
For passive investors: Depreciation is non-cash, so a rental often shows a tax loss while cash-flowing — sheltering income. Rental losses are passive: they offset passive income freely, and up to $25,000/yr can offset ordinary (W-2) income if you actively participate and your MAGI is under $100k (phasing out to $0 by $150k); unused losses carry forward. On sale, claimed depreciation is recaptured at up to 25%, and gains may owe capital-gains tax (a 1031 exchange can defer both). Figures are a year-1 estimate at your 24.0% rate — not tax advice; consult a CPA.
Schools (NCES district)
- District
- Gates-Chili Central School District
- NCES district ID
- 3611880
- Math proficiency
- 41% ▼ -12.00%
- Reading proficiency
- 42% ▼ -6.00%
- Median HH income
- $55,045
- Composite
- 36.23/100
- National rank
- #4719
- State rank
- #491 of 590 in NY
Livability — Gates
- Score
- 67/100
- State rank
- #582
- US rank
- #10531
Category grades
Schools grade is shown separately in the Schools card above.
Census & demographics
- County
- Monroe County · 674,131 people
- Metro
- Rochester, NY
- Population (ZIP)
- 38,626
- Household income
- $87,989
- Rent vs Own
- Severe rent burden
- 584.0
Population outlook (Monroe County) Hauer SSP2
- Today (2025)
- 759,460 people
- By 2030
- 757,154 · -0.3%
- By 2040
- 740,644 · -2.5%
- By 2050
- 714,443 · -5.9%
- By 2075
- 645,883 · -15.0%
- By 2100
- 547,084 · -28.0%
Race, ethnicity, and origin ACS 2023
- Neighborhood character
- Predominantly White (78%)
- Race & ethnicity
- White 78% Black 9% Hispanic / Latino 6% Two or more races 5% Asian 3%
- Hispanic origin (detail)
- Puerto Rican 4%
- Common ancestry
- Romanian 6% Iranian 2% Lithuanian 2%
- Foreign-born
- 7% · Canada, China, India
- Languages at home
- 90% English-only · Spanish 3% Other Indo-European 3% Russian/Polish/Slavic 1%
Political lean MEDSL · Monroe
- 2024 margin
- D (+19.1) · D 59.5% · R 40.5%
- 2008→2024 swing
- +1.4pp toward D · 2008: 17.7pp · 2024: 19.1pp
- All cycles
- 2024: D+19.1 2020: D+21.0 2016: D+14.1 2012: D+17.4 2008: D+17.7
Not yet ingested
- Civics
- —
Market trends
- HPI YoY
- ▼ -151.26%
- Current HPI
- 267.356
- Rent YoY
- —
- Metro
- Rochester, NY
- State GDP YoY
- ▲ 2.60%
- F500 in state
- 92
Industry mix (Fortune 500 HQ in NY)
| Industry | F500 HQs | Revenue |
|---|---|---|
| Financial Services | 10 | $950B |
|
||
| Consumer Goods | 9 | $162B |
|
||
| Insurance | 4 | $225B |
|
||
| Telecommunications | 2 | $144B |
|
||
| Pharmaceuticals | 2 | $112B |
|
||
| Media / Entertainment | 2 | $69B |
|
||
Price history
+92.8% since first listed3 events — show timeline
- 2026-05-20 Pending — UNYREIS
- 2026-05-13 Listed $189,900 UNYREIS
- 2002-03-04 Sold (Public Records) $98,500 Public Records
Property tax history
+4.0%/yrLatest (2025): $6,970 · +27.0% YoY. Source: county tax records.
Cash-flow waterfall
monthlySold comps — $/sqft
last 12 mo · ≤1 miLoading sold comps…