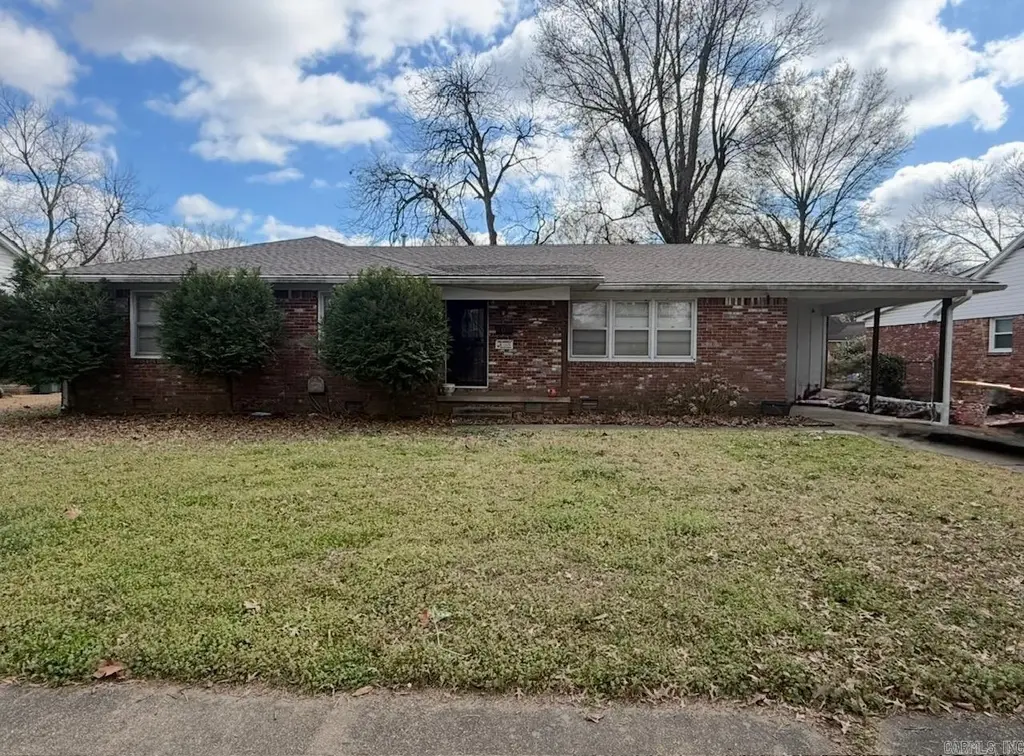
421 Cedar Ln · Blytheville, AR
Flood risk 1/10 · Minimal
- FEMA flood zone
- X (shaded)
- Chance of flooding over 30 yrs
- 0.0%
- Est. flood insurance / yr
- $507 – $1,088
Fire risk 1/10 · Minimal
- Est. fire insurance / yr
- $1,499 – $2,785
Heat risk 6/10 · Moderate
- Hot days now (above 109°F)
- 7 days/yr
- Hot days in 30 yrs
- 20 days/yr
Wind risk 4/10 · Minor
- Chance of severe wind over 30 yrs
- 9.0%
Air-quality risk 2/10 · Minimal
- Unhealthy air days now
- 0 days/yr
- Unhealthy air days in 30 yrs
- 1 days/yr
Risk factors via First Street. Map © Google.
Why this score? — see what drove the C grade
The composite is a weighted blend of 9 inputs, each scored 0–100. Each bar is that input's sub-score; the figure is the points it added to the 100-point composite (weight × sub-score).
- Cash flow +26.4/30.0
- ARV discount +9.1/15.0
- DSCR +9.0/10.0
- 1% rule +5.7/10.0
- Livability +3.2/5.0
- Rent growth +2.5/5.0
- Condition / age +2.5/5.0
- Schools +0.8/10.0
- Appreciation +0.0/10.0
$140,000
🖨 Deal sheet 📄 Offer letter ✓ Due diligence
Listing remarks MLS
This charming 4-bedroom, 2-bath home offering 1,647 square feet of comfortable living space in a quiet, established neighborhood. Enjoy relaxing on the welcoming front porch or spending time in this well-maintained home. Several important updates have already been completed, including a new roof installed in 2025, an HVAC system replaced in 2019, and a hot water heater that is less than five years old. The kitchen appliances are less than five years old, adding modern convenience. With its functional layout and peaceful setting, this home is a great opportunity for comfortable everyday living. More Pictures to come!!
Key facts
- Kitchen appliances
- Hvac system replaced
- Hot water heater
Tags
Neighborhood map
What this means for you Summary
Snapshot
- This is a 4-bed/1.5-bath single-family listed at $140k.
Deal economics
- At list price, monthly cash flow is $366 ($4k/yr) — positive.
- The deal already cash-flows at list — no discount required.
- Meets the 1% rule at list price ($2k rent vs $140k).
- Recommended offer: $127k (9.0% below list) — sets the bar for market timing.
- Cap rate 9.4% vs local median 6.8% in Blytheville — top-decile yield for the area; either an underpriced asset or a hidden risk that comps aren't pricing in. Stress-test before assuming the spread holds.
Location & tenants
- Location reads 64/100 on livability (#168 in AR) — a middle-class / working-renter tenant base. Strengths: cost of living A+, housing A+, health & safety A+; Watch: amenities D, schools F, crime F.
- Blytheville School District (town): math 8% / reading 12% proficiency, ranked #233 of 238 in AR (top 98%) — low school quality limits family demand, transient renter base, plan for 1-2y turnover; 96% free/reduced lunch — lower-income household profile, screen leases tightly.
- Market conditions: 135 active listings in the ZIP; 1 comparable units currently listed for rent nearby; 69 units permitted in Mississippi County in 2024 (0 in 5+ unit buildings).
Forward outlook
- Local home prices are declining (-3.0%/yr); year-one equity from $968 of loan paydown is wiped out by about $4k of value loss. Plan a longer hold.
- Mississippi County population projected at -30% by 2050 — secular population decline; favor cash flow + early exit over multi-decade hold.
- At projected returns (-3.0% appreciation + 3.0% rent growth), your $39k cash investment doubles in ~10 years — after that, you're playing with house money.
Negotiation context
- It's been on market 95 days — a 9% lower offer ($127k) is reasonable based on typical stale-listing flexibility.
- 2 sale attempts with the ask held roughly flat each time — persistent listings suggest the price (not the market) is what's stuck; bring a comps-based counter.
- Current owner paid $97k; 44% above their basis — modest negotiation headroom, anchor on the comps not their cost.
Risks & watch-outs
- Climate carrying-cost: extreme-heat days projected 7→20/yr by 2055 (HVAC capex compounding) — expect insurance premiums to compound above CPI over the hold.
Questions for the listing agent
- It's been on market 95 days. Have you received any prior offers? Is the seller open to a 9% concession, seller financing, or rate buy-down credit?
- Built in 1973 — when were the roof, HVAC, electrical panel, plumbing, and water heater last replaced?
- Why hasn't it sold? Are there any deal-killer items the seller is aware of (foundation, flood, title, zoning, code violations)?
- Is there a deadline driving the sale (1031 exchange, divorce, estate, relocation)? That informs how much negotiation room exists.
- Schools are F-rated, which usually means shorter tenancies and higher turnover. Who's the typical renter profile here, and what's been the actual vacancy rate?
- Crime grade is F in this area — have there been break-ins, vandalism, or insurance claims at this property in the last 3 years? What carrier currently insures it and at what premium?
- What's the average days-on-market for RENTAL listings here right now (not sales)? A rising rental-DOM trend means longer vacancies and softer asking-rent achievability than the comps imply.
- What's the recent tenant-quality profile in this submarket — average credit score on applications, eviction rate, late-payment / NSF rate, and stable-employment percentage? A property-management company in the area should have these aggregated.
- How much new for-sale + rental construction is in the pipeline within 1–3 miles? Heavy new supply typically softens prices + rents 12–24 months out; constrained supply supports both.
Investment metrics
- 1% rule
- 1.07% ✓
- Cap rate
- 9.43%
- Cash-on-cash
- 11.21%
- DSCR
- 1.50
- GRM
- 7.8
CMA / ARV
- ARV (median comp)
- $145,038
- List price
- $140,000
- Delta
- -3.47%
- Verdict
- FAIR
- Comps
- 20 within 1.0 mi
Show comp detail 12 sales within ~0.75 mi
| Address | Dist | Beds/Ba | Sqft | Sold | Price | $/sf | Match |
|---|---|---|---|---|---|---|---|
| 1121 N Broadway St | 0.20mi | 3/2.0 (-1) | 1,548 (-6%) | 3mo | $55,000 | $36 | 71 |
| 618 Adams St | 0.21mi | 3/2.0 (-1) | 1,748 (+6%) | 13mo | $131,840 | $75 | 62 |
| 1004 Highland St | 0.41mi | 3/1.5 (-1) | 1,456 (-12%) | 0mo | $50,000 | $34 | 56 |
| 1807 10th St | 0.48mi | 3/2.0 (-1) | 1,518 (-8%) | 2mo | $146,000 | $96 | 56 |
| 1021 Broadmoor St | 0.49mi | 3/2.0 (-1) | 1,765 (+7%) | 2mo | $160,000 | $91 | 56 |
| 708 Illinois St | 0.23mi | 3/2.0 (-1) | 1,842 (+12%) | 9mo | $175,000 | $95 | 55 |
| 700 W Hardin St | 0.34mi | 3/1.0 (-1) | 1,486 (-10%) | 8mo | $40,000 | $27 | 54 |
| 1101 W Pecan St | 0.54mi | 3/2.0 (-1) | 1,513 (-8%) | 5mo | $170,000 | $112 | 50 |
| 136 N Crescent Dr | 0.56mi | 3/1.5 (-1) | 1,447 (-12%) | 4mo | $125,000 | $86 | 45 |
| 1900 Meadow Ln | 0.64mi | 3/2.0 (-1) | 1,746 (+6%) | 12mo | $142,000 | $81 | 43 |
| 1004 W Hardin St | 0.46mi | 3/2.0 (-1) | 1,864 (+13%) | 8mo | $35,000 | $19 | 43 |
| 1105 Dixie St | 0.67mi | 3/2.0 (-1) | 1,564 (-5%) | 13mo | $126,000 | $81 | 43 |
Match score weights: distance 35% · size 25% · config 20% · recency 20%. Top-matched comps best support the ARV.
Projected returns pro-forma
-3.0% appreciation · 3.0% rent growth · sell at horizon
- IRR
- 0.4%
- Equity multiple
- 1.01×
- Total profit
- $559
- Equity at exit
- $20,874
- IRR
- 10.0%
- Equity multiple
- 1.77×
- Total profit
- $30,228
- Equity at exit
- $12,105
Cash invested: $39,200 (down + closing). Projections, not guarantees.
Landlord ↔ Tenant lean methodology
- Overall (STATE)
- 92 Strongly Landlord-Friendly
- State Arkansas
- 92 Strongly Landlord-Friendly · R+14
- County
- — inherits STATE
- City
- — inherits STATE
ZIP-level market 72315
- Home prices YoY
- -32.5%
- Active inventory
- 135
- Price-to-rent
- 7.8×
Monthly cashflow live
- Estimated rent
- $1,500 medium interval (Pro) →
- Mortgage (P&I)
- −$734
- Tax from tax record
- −$26 /mo · $317/yr
- Insurance
- −$58
- HOA
- −$0
- Vacancy / Maint / Mgmt
- −$315
- Net cashflow
- $366
Break-even live
UW: 25.0% down · 7.5% · 30yr · 1.5% tax · 5.0% vac · 8.0% maint · 8.0% mgmt
Financing live
Cash to close
- Down payment
- $35,000
- Closing costs
- $4,200
- Reserves months
- —
- Total cash needed
- —
Loan-product check · same deal, 3 products live
Conventional
25% down · 7.5% · 30yr
- Down + closing
- —
- Monthly P&I
- —
- Monthly cashflow
- —
- DSCR
- —
- Eligible?
- —
Personal DTI + credit; lowest rate.
DSCR
20% down · 8.5% · 30yr
- Down + closing
- —
- Monthly P&I
- —
- Monthly cashflow
- —
- DSCR
- —
- Eligible?
- —
No personal income docs; deal must DSCR.
Hard money
10% down · 12.0% · 12mo
- Down + closing
- —
- Monthly P&I
- —
- Monthly cashflow
- —
- DSCR
- —
- Eligible?
- —
Short-term bridge; refi at stabilization.
Rent comps 1 comps
| Address | Beds | Baths | Sqft | Rent | $/sqft | DOM | Units | Dist |
|---|---|---|---|---|---|---|---|---|
| 812 Melody Ln Blytheville, AR | 3.0 | 2.0 | 1585 | $1,500 | $0.95 | 43d | 1 | 1.21mi |
Listing history 20 events
-
2026-06-19days on market $140,000 Active 95 DOM
-
2026-06-18days on market $140,000 Active 94 DOM
-
2026-06-17days on market $140,000 Active 93 DOM
-
2026-06-16days on market $140,000 Active 92 DOM
-
2026-06-15days on market $140,000 Active 91 DOM
-
2026-06-14days on market $140,000 Active 89 DOM
-
2026-06-12days on market $140,000 Active 88 DOM
-
2026-06-09days on market $140,000 Active 85 DOM
-
2026-06-08days on market $140,000 Active 84 DOM
-
2026-06-07days on market $140,000 Active 83 DOM
-
2026-06-07days on market $140,000 Active 82 DOM
-
2026-06-04days on market $140,000 Active 79 DOM
-
2026-06-02days on market $140,000 Active 78 DOM
-
2026-06-01days on market $140,000 Active 77 DOM
-
2026-05-31days on market $140,000 Active 76 DOM
-
2026-05-31days on market $140,000 Active 75 DOM
-
2026-03-12$140,000 New Listing 624-char remark
Show marketing remark (624 chars)
This charming 4-bedroom, 2-bath home offering 1,647 square feet of comfortable living space in a quiet, established neighborhood. Enjoy relaxing on the welcoming front porch or spending time in this well-maintained home. Several important updates have already been completed, including a new roof installed in 2025, an HVAC system replaced in 2019, and a hot water heater that is less than five years old. The kitchen appliances are less than five years old, adding modern convenience. With its functional layout and peaceful setting, this home is a great opportunity for comfortable everyday living. More Pictures to come!!
-
2026-03-12$140,000 Active 624-char remark
Show marketing remark (624 chars)
This charming 4-bedroom, 2-bath home offering 1,647 square feet of comfortable living space in a quiet, established neighborhood. Enjoy relaxing on the welcoming front porch or spending time in this well-maintained home. Several important updates have already been completed, including a new roof installed in 2025, an HVAC system replaced in 2019, and a hot water heater that is less than five years old. The kitchen appliances are less than five years old, adding modern convenience. With its functional layout and peaceful setting, this home is a great opportunity for comfortable everyday living. More Pictures to come!!
-
2015-11-23soldstatus $97,000
-
2014-04-03soldstatus $60,000
ⓘ Source: listings_history table (triggers on properties + properties_extension) + one-shot
backfill from property_details.listing_events for pre-trigger history.
Tax reassessment forecast AR · Resets to sale price
- Current annual tax
- $317 · $26/mo
- Projected year-2 tax
- $896 · $75/mo
- Expected delta
- +$579/yr (+$48/mo · 182.4%)
ⓘ Screening estimate from a state-policy table — verify with the county assessor before closing.
Climate risk First Street
- Flood 1/10 Low FEMA zone X (shaded) · 0% chance over 30 yrs
- Wildfire 1/10 Low
- Heat 6/10 Major 7 d/yr ≥109°F today · 20 d/yr by 30 yrs out
- Wind 4/10 Moderate 9% chance of damaging wind over 30 yrs
- Air quality 2/10 Low 0 unhealthy d/yr today · 1 by 30 yrs out
Nearby sold comps map
Loading sold comps map…
Walkable amenities ~0.75 mi
Loading nearby amenities…
Taxation est. · year 1
- Rental income
- $18,000
- − Mortgage interest
- −$7,842
- − Property taxes
- −$317
- − Insurance
- −$700
- − Repairs & maintenance
- −$1,440
- − Management
- −$1,440
- − Depreciation
- −$4,073
- Taxable income
- $2,188
- Est. tax owed @ 24.0%
- −$525
- After-tax cash flow
- $3,868/yr
For passive investors: Depreciation is non-cash, so a rental often shows a tax loss while cash-flowing — sheltering income. Rental losses are passive: they offset passive income freely, and up to $25,000/yr can offset ordinary (W-2) income if you actively participate and your MAGI is under $100k (phasing out to $0 by $150k); unused losses carry forward. On sale, claimed depreciation is recaptured at up to 25%, and gains may owe capital-gains tax (a 1031 exchange can defer both). Figures are a year-1 estimate at your 24.0% rate — not tax advice; consult a CPA.
Schools (NCES district)
- District
- Blytheville School District
- NCES district ID
- 0503320
- Math proficiency
- 8% ▼ -11.00%
- Reading proficiency
- 12% ▼ -9.00%
- Median HH income
- $33,356
- Composite
- 8.02/100
- National rank
- #9922
- State rank
- #233 of 238 in AR
Livability — Blytheville
- Score
- 64/100
- State rank
- #168
- US rank
- #14094
Category grades
Schools grade is shown separately in the Schools card above.
Census & demographics
- Census place
- Blytheville, AR
- City population
- 20,100
- Population (ZIP)
- 20,100
Population outlook (Mississippi County) Hauer SSP2
- Today (2025)
- 38,959 people
- By 2030
- 36,401 · -6.6%
- By 2040
- 31,526 · -19.1%
- By 2050
- 27,058 · -30.5%
- By 2075
- 17,847 · -54.2%
- By 2100
- 11,024 · -71.7%
Race, ethnicity, and origin ACS 2023
- Neighborhood character
- Diverse neighborhood (Simpson 0.57)
- Race & ethnicity
- White 50% Black 42% Hispanic / Latino 4% Two or more races 4%
- Common ancestry
- Iranian 3% Italian 1% Slovak 1%
- Foreign-born
- 3% · Canada
- Languages at home
- 96% English-only · Spanish 3%
Political lean MEDSL · Mississippi
- 2024 margin
- Solid R (+31.6) · D 33.4% · R 65.0% · Other 1.7%
- 2008→2024 swing
- -29.4pp toward R · 2008: -2.2pp · 2024: -31.6pp
- All cycles
- 2024: R+31.6 2020: R+22.2 2016: R+10.5 2012: R+1.1 2008: R+2.2
Not yet ingested
- Civics
- —
Market trends
- HPI YoY
- ▼ -84.32%
- Current HPI
- 175.5603
- Rent YoY
- —
- Metro
- —
- State GDP YoY
- ▲ 3.80%
- F500 in state
- 10
Industry mix (Fortune 500 HQ in AR)
| Industry | F500 HQs | Revenue |
|---|---|---|
| Retail | 1 | $681B |
|
||
| Food / Agriculture | 1 | $53B |
|
||
| Retail / Energy | 1 | $22B |
|
||
| Transportation / Logistics | 1 | $12B |
|
||
| Energy | 1 | $4B |
|
||
Price history
+133.3% since first listed4 events — show timeline
- 2026-03-12 Listed $140,000 NEABOR MLS
- 2026-03-12 Listed $140,000 CARMLS
- 2015-11-23 Sold (Public Records) $97,000 Public Records
- 2014-04-03 Sold (Public Records) $60,000 Public Records
Property tax history
-24.0%/yrLatest (2025): $317 · -24.0% YoY. Source: county tax records.
Cash-flow waterfall
monthlySold comps — $/sqft
last 12 mo · ≤1 miLoading sold comps…