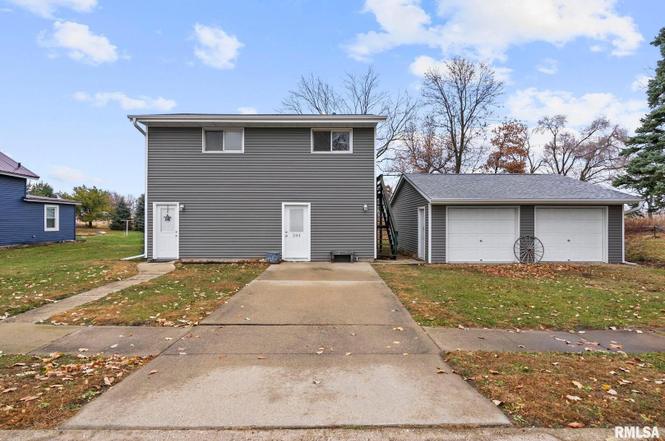
204 Main St · Calamus, IA
Flood risk 6/10 · Moderate
- FEMA flood zone
- X (unshaded)
- Chance of flooding over 30 yrs
- 0.7%
- Est. flood insurance / yr
- $473 – $860
Fire risk 1/10 · Minimal
- Est. fire insurance / yr
- $902 – $1,676
Heat risk 3/10 · Minor
- Hot days now (above 103°F)
- 7 days/yr
- Hot days in 30 yrs
- 16 days/yr
Wind risk 2/10 · Minimal
- Chance of severe wind over 30 yrs
- —
Air-quality risk 2/10 · Minimal
- Unhealthy air days now
- 2 days/yr
- Unhealthy air days in 30 yrs
- 2 days/yr
Risk factors via First Street. Map © Google.
Why this score? — see what drove the D- grade
The composite is a weighted blend of 9 inputs, each scored 0–100. Each bar is that input's sub-score; the figure is the points it added to the 100-point composite (weight × sub-score).
- Cash flow +7.6/30.0
- Appreciation +6.9/10.0
- Schools +5.9/10.0
- ARV discount +3.6/15.0
- Livability +3.2/5.0
- Rent growth +2.5/5.0
- Condition / age +2.5/5.0
- DSCR +1.7/10.0
- 1% rule +1.6/10.0
$125,000
🖨 Deal sheet 📄 Offer letter ✓ Due diligence
Listing remarks
Step inside this 2-bedroom, 2-bath raised ranch home on 0.58 acres in Calamus, IA! Main living quarters upstairs, and plentiful opportunity on the ground level! You'll be pleased to find brand new luxury vinyl plank flooring, fresh paint, and new baseboard trim throughout. A brand new water heater and upstairs bathroom toilet add peace of mind, and newer exterior siding and ground-level entry doors to the home (installed in 2022) offer low maintenance for years to come. Oven/range and refrigerator included, only 1 year old! Automobile lovers, woodworkers, hobbyists, or DIYers will love the detached 2-car garage and spacious lower-level storage area - option for a workshop, mechanic's setup,
Key facts
- 0.58 acre lot
- 2 garage spots
- Built 1993
Neighborhood map
What this means for you Summary
Snapshot
- This is a 2-bed/2.0-bath single-family listed at $125k.
Deal economics
- At list price, monthly cash flow is $-150 ($-2k/yr) — negative.
- To cash-flow at today's rent, offer at most $99k (21.2% below list).
- To meet the 1% rule (rent ≥ 1% of price), the offer needs to be $83k (33.9% below list).
- Recommended offer: $83k (33.9% below list) — sets the bar for 1% rule.
Location & tenants
- Location reads 65/100 on livability (#555 in IA) — a middle-class / working-renter tenant base. Strengths: cost of living A+, schools A, housing A; Watch: amenities F, commute F, health & safety F.
- Calamus-Wheatland Community School District (rural): math 71% / reading 67% proficiency, ranked #150 of 289 in IA (top 52%) — acceptable for families but not a draw, mixed tenant base, ~2y average lease.
- Market conditions: 14 active listings in the ZIP; 116 units permitted in Clinton County in 2024 (50 in 5+ unit buildings).
Forward outlook
- In year one you build about $6k of equity ($864 loan paydown + $5k appreciation (3.9% local appreciation)).
- Clinton County population projected at -19% by 2050 — secular population decline; favor cash flow + early exit over multi-decade hold.
- By year 6, paydown + projected appreciation supports a ~$30k cash-out refi (75% LTV) — recoverable capital for the next deal without selling this one.
Negotiation context
- Only 0 days on market — expect competitive offers; lowballing is unlikely to land.
- 2 sale attempts with the ask held roughly flat each time — persistent listings suggest the price (not the market) is what's stuck; bring a comps-based counter.
Risks & watch-outs
- Climate carrying-cost: major flood risk — expect insurance premiums to compound above CPI over the hold.
Questions for the listing agent
- What do current leases actually rent for vs. the listed asking? Can we see a recent rent roll and the last 12 months of T-12 income?
- Is there a deadline driving the sale (1031 exchange, divorce, estate, relocation)? That informs how much negotiation room exists.
- Schools are A-rated — typically a magnet for longer-tenancy family renters. What's the average tenant stay here, and is there a school-zone premium baked into asking?
- The area grade is low — what's the realistic commute time and amenity access for the typical tenant pool here? Any planned neighborhood developments (good or bad) we should know about?
- What's the average days-on-market for RENTAL listings here right now (not sales)? A rising rental-DOM trend means longer vacancies and softer asking-rent achievability than the comps imply.
- What's the recent tenant-quality profile in this submarket — average credit score on applications, eviction rate, late-payment / NSF rate, and stable-employment percentage? A property-management company in the area should have these aggregated.
- How much new for-sale + rental construction is in the pipeline within 1–3 miles? Heavy new supply typically softens prices + rents 12–24 months out; constrained supply supports both.
Investment metrics
- 1% rule
- 0.66% ✗
- Cap rate
- 4.85%
- Cash-on-cash
- -5.14%
- DSCR
- 0.77
- GRM
- 12.6
CMA / ARV
- ARV (on-the-fly)
- $115,024
- Comps found
- 1
Show comp detail 1 sale within ~0.75 mi
| Address | Dist | Beds/Ba | Sqft | Sold | Price | $/sf | Match |
|---|---|---|---|---|---|---|---|
| 204 Main St | 0.00mi | 2/2.0 | 783 (+8%) | 5mo | $123,728 | $158 | 83 |
Match score weights: distance 35% · size 25% · config 20% · recency 20%. Top-matched comps best support the ARV.
Projected returns pro-forma
3.9% appreciation · 3.0% rent growth · sell at horizon
- IRR
- 5.4%
- Equity multiple
- 1.33×
- Total profit
- $11,528
- Equity at exit
- $62,627
- IRR
- 8.1%
- Equity multiple
- 2.35×
- Total profit
- $47,212
- Equity at exit
- $101,838
Cash invested: $35,000 (down + closing). Projections, not guarantees.
Landlord ↔ Tenant lean methodology
- Overall (STATE)
- 83 Strongly Landlord-Friendly
- State Iowa
- 83 Strongly Landlord-Friendly · R+6
- County
- — inherits STATE
- City
- — inherits STATE
ZIP-level market 52729
- Home prices YoY
- 2.5%
- Active inventory
- 14
- Price-to-rent
- 12.6×
Monthly cashflow live
- Estimated rent
- $826 medium interval (Pro) →
- Mortgage (P&I)
- −$656
- Tax from tax record
- −$95 /mo · $1,140/yr
- Insurance
- −$52
- HOA
- −$0
- Vacancy / Maint / Mgmt
- −$174
- Net cashflow
- $-150
Break-even live
UW: 25.0% down · 7.5% · 30yr · 1.5% tax · 5.0% vac · 8.0% maint · 8.0% mgmt
Financing live
Cash to close
- Down payment
- $31,250
- Closing costs
- $3,750
- Reserves months
- —
- Total cash needed
- —
Loan-product check · same deal, 3 products live
Conventional
25% down · 7.5% · 30yr
- Down + closing
- —
- Monthly P&I
- —
- Monthly cashflow
- —
- DSCR
- —
- Eligible?
- —
Personal DTI + credit; lowest rate.
DSCR
20% down · 8.5% · 30yr
- Down + closing
- —
- Monthly P&I
- —
- Monthly cashflow
- —
- DSCR
- —
- Eligible?
- —
No personal income docs; deal must DSCR.
Hard money
10% down · 12.0% · 12mo
- Down + closing
- —
- Monthly P&I
- —
- Monthly cashflow
- —
- DSCR
- —
- Eligible?
- —
Short-term bridge; refi at stabilization.
Listing history 15 events
-
2026-05-24status Pending
-
2026-05-24status Pending
-
2026-05-22status Pending
-
2026-01-20soldstatus $124,000
-
2026-01-16soldstatus $123,728 Closed
-
2026-01-16soldstatus $123,728 Closed
-
2026-01-16soldstatus $123,728 Closed
-
2026-01-16soldstatus $123,728 Closed
-
2026-01-08status Pending
-
2026-01-05historical
-
2025-12-08status Pending
-
2025-12-04historical
-
2025-12-04historical
-
2025-11-20$125,000
-
2025-11-20Active
ⓘ Source: listings_history table (triggers on properties + properties_extension) + one-shot
backfill from property_details.listing_events for pre-trigger history.
Tax reassessment forecast IA · Partial reset (capped growth)
- Current annual tax
- $1,140 · $95/mo
- Projected year-2 tax
- $1,551 · $129/mo
- Expected delta
- +$411/yr (+$34/mo · 36.1%)
ⓘ Screening estimate from a state-policy table — verify with the county assessor before closing.
Climate risk First Street
- Flood 6/10 Major FEMA zone X (unshaded) · 70% chance over 30 yrs
- Wildfire 1/10 Low
- Heat 3/10 Moderate 7 d/yr ≥103°F today · 16 d/yr by 30 yrs out
- Wind 2/10 Low
- Air quality 2/10 Low 2 unhealthy d/yr today · 2 by 30 yrs out
Nearby sold comps map
Loading sold comps map…
Walkable amenities ~0.75 mi
Loading nearby amenities…
Taxation est. · year 1
- Rental income
- $9,916
- − Mortgage interest
- −$7,002
- − Property taxes
- −$1,140
- − Insurance
- −$625
- − Repairs & maintenance
- −$793
- − Management
- −$793
- − Depreciation
- −$3,636
- Taxable loss
- −$4,074
- Est. tax savings @ 24.0%
- +$978
- After-tax cash flow
- $-820/yr
For passive investors: Depreciation is non-cash, so a rental often shows a tax loss while cash-flowing — sheltering income. Rental losses are passive: they offset passive income freely, and up to $25,000/yr can offset ordinary (W-2) income if you actively participate and your MAGI is under $100k (phasing out to $0 by $150k); unused losses carry forward. On sale, claimed depreciation is recaptured at up to 25%, and gains may owe capital-gains tax (a 1031 exchange can defer both). Figures are a year-1 estimate at your 24.0% rate — not tax advice; consult a CPA.
Schools (NCES district)
- District
- Calamus-Wheatland Community School District
- NCES district ID
- 1906000
- Math proficiency
- 71% ▼ -6.00%
- Reading proficiency
- 67% ▼ -3.00%
- Median HH income
- $54,711
- Composite
- 59.01/100
- National rank
- #962
- State rank
- #150 of 289 in IA
Livability — Calamus
- Score
- 65/100
- State rank
- #555
- US rank
- #12527
Category grades
Schools grade is shown separately in the Schools card above.
Census & demographics
- Census place
- Calamus, IA
- Population (ZIP)
- 834
Population outlook (Clinton County) Hauer SSP2
- Today (2025)
- 44,817 people
- By 2030
- 43,090 · -3.9%
- By 2040
- 39,513 · -11.8%
- By 2050
- 36,209 · -19.2%
- By 2075
- 31,888 · -28.8%
- By 2100
- 30,382 · -32.2%
Race, ethnicity, and origin ACS 2023
- Neighborhood character
- Predominantly White (84%)
- Race & ethnicity
- White 84% Asian 9% Hispanic / Latino 5% Two or more races 5%
- Common ancestry
- Italian 3% English 3% Iranian 2%
- Foreign-born
- 9% · China
- Languages at home
- 91% English-only · Chinese 9%
Political lean MEDSL · Clinton
- 2024 margin
- R (+18.9) · D 39.8% · R 58.6% · Other 1.6%
- 2008→2024 swing
- -41.9pp toward R · 2008: 23.0pp · 2024: -18.9pp
- All cycles
- 2024: R+18.9 2020: R+10.3 2016: R+5.1 2012: D+22.9 2008: D+23.0
Not yet ingested
- Civics
- —
Market trends
- HPI YoY
- ▲ 3.90%
- Current HPI
- 157.408
- Rent YoY
- —
- Metro
- —
- State GDP YoY
- ▲ 2.48%
- F500 in state
- 4
Industry mix (Fortune 500 HQ in IA)
| Industry | F500 HQs | Revenue |
|---|---|---|
| Financial Services | 1 | $16B |
|
||
| Retail / Convenience | 1 | $15B |
|
||
Price history
-0.8% since first listed15 events — show timeline
- 2026-05-24 Pending — MRED as Distributed by MLS Grid
- 2026-05-24 Pending — MRED as Distributed by MLS Grid
- 2026-05-22 Pending — MRED as Distributed by MLS Grid
- 2026-01-20 Sold (Public Records) $124,000 Public Records
- 2026-01-16 Sold (MLS) $123,728 MRED as Distributed by MLS Grid
- 2026-01-16 Sold (MLS) $123,728 MRED as Distributed by MLS Grid
- 2026-01-16 Sold (MLS) $123,728 MRED as Distributed by MLS Grid
- 2026-01-16 Sold (MLS) $123,728 MRED as Distributed by MLS Grid
- 2026-01-08 Pending — MRED as Distributed by MLS Grid
- 2026-01-05 Listing Removed — MRED as Distributed by MLS Grid
- 2025-12-08 Pending — RMLSA as Distributed by MLS Grid
- 2025-12-04 Listing Removed — RMLSA as Distributed by MLS Grid
- 2025-12-04 Listing Removed — MRED as Distributed by MLS Grid
- 2025-11-20 Listed — RMLSA as Distributed by MLS Grid
- 2025-11-20 Listed $125,000 MRED as Distributed by MLS Grid
Property tax history
+0.5%/yrLatest (2025): $1,140 · +0.7% YoY. Source: county tax records.
Cash-flow waterfall
monthlySold comps — $/sqft
last 12 mo · ≤1 miLoading sold comps…