3081 U.s. 11 · Mooers, NY
Flood risk No data
- FEMA flood zone
- —
- Chance of flooding over 30 yrs
- —
- Est. flood insurance / yr
- —
Fire risk No data
- Est. fire insurance / yr
- —
Heat risk No data
- Hot days now (above threshold)
- —
- Hot days in 30 yrs
- —
Wind risk No data
- Chance of severe wind over 30 yrs
- —
Air-quality risk No data
- Unhealthy air days now
- —
- Unhealthy air days in 30 yrs
- —
Risk factors via First Street. Map © Google.
Why this score? — see what drove the B+ grade
The composite is a weighted blend of 9 inputs, each scored 0–100. Each bar is that input's sub-score; the figure is the points it added to the 100-point composite (weight × sub-score).
- Cash flow +27.1/30.0
- DSCR +9.4/10.0
- 1% rule +9.3/10.0
- Appreciation +8.3/10.0
- ARV discount +7.5/15.0
- Schools +5.3/10.0
- Livability +3.3/5.0
- Rent growth +2.5/5.0
- Condition / age +2.2/5.0
$90,000
🖨 Deal sheet 📄 Offer letter ✓ Due diligence
Listing remarks MLS
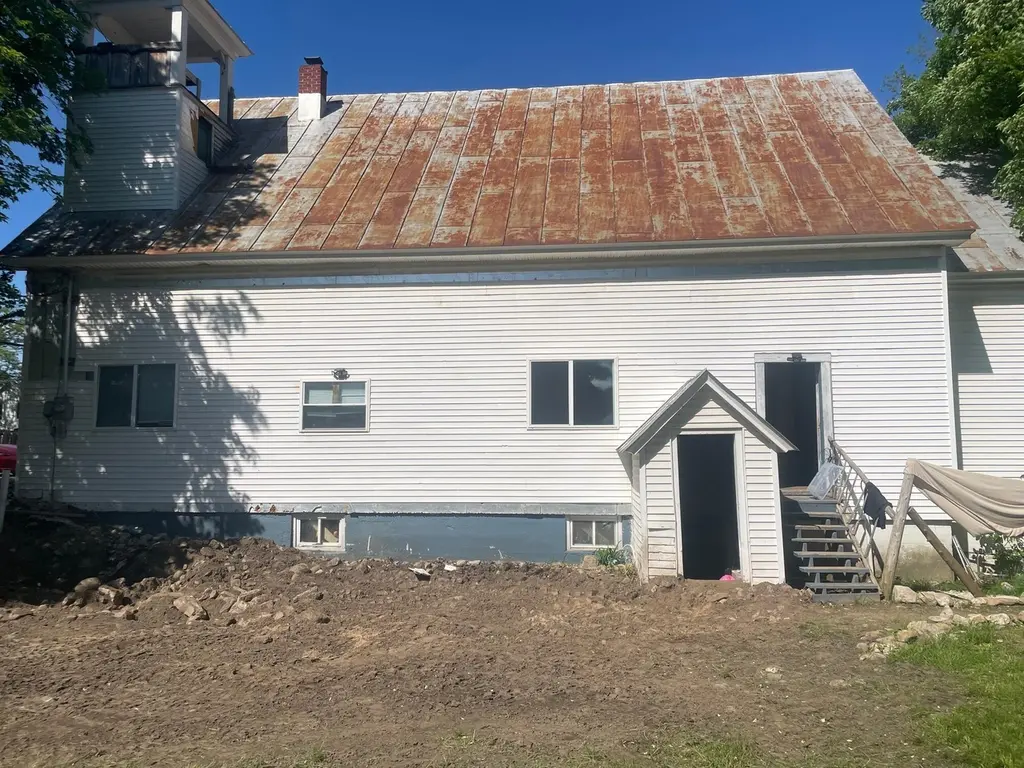
Imagine the possibilities! This 3, possibly 4 bedroom former Church is ready for you to finish and turn into your own private residence or investment property! Conveniently located on Rt. 11 in Mooers Forks this building was originally designed and constructed in 1925 as the Methodist Church of Mooers and its ready for you to complete to realize its full potential. Renovations have already begun and are partially done. The build plan has been professionally engineered with much of the framing, electrical, plumbing and sheet rock already installed. A second floor has been added for additional living space featuring three rooms and a bathroom. The flexible floor plan allows an easy conversion into a duplex if you desire and is already plumbed to have a second kitchen installed. Cathedral ceilings and large windows allow in abundant natural light and feature an open concept floor plan with original real hardwood floors! Opportunity awaits you to transform this unique and historic building into your dream home or investment property. Motivated seller has it priced to sell well below assessed value!
Key facts
- Flexible floor plan
- 0.47 acre lot
- 3 parking spots
Tags
Neighborhood map
What this means for you Summary
Snapshot
- This is a 3-bed/2.0-bath single-family listed at $90k. Condition is rated fair.
Deal economics
- At list price, monthly cash flow is $256 ($3k/yr) — positive.
- The deal already cash-flows at list — no discount required.
- Meets the 1% rule at list price ($1k rent vs $90k).
- Recommended offer: $82k (9.0% below list) — sets the bar for market timing.
Location & tenants
- Location reads 66/100 on livability (#660 in NY) — a middle-class / working-renter tenant base. Strengths: cost of living A+, housing A+, employment B+; Watch: schools C-, health & safety C-, crime F.
- Northeastern Clinton Central School District (rural): math 63% / reading 63% proficiency, ranked #203 of 590 in NY (top 34%) — acceptable for families but not a draw, mixed tenant base, ~2y average lease.
- Market conditions: 16 active listings in the ZIP; 192 units permitted in Clinton County in 2024 (64 in 5+ unit buildings).
Forward outlook
- In year one you build about $7k of equity ($622 loan paydown + $6k appreciation (6.6% local appreciation)).
- Clinton County population projected at -16% by 2050 — secular population decline; favor cash flow + early exit over multi-decade hold.
- At projected returns (6.6% appreciation + 3.0% rent growth), your $25k cash investment doubles in ~3 years — after that, you're playing with house money.
- By year 6, paydown + projected appreciation supports a ~$36k cash-out refi (75% LTV) — recoverable capital for the next deal without selling this one.
Negotiation context
- It's been on market 120 days — a 9% lower offer ($82k) is reasonable based on typical stale-listing flexibility.
Risks & watch-outs
- Watch-outs: property tax is 3.4% of price; built in 1925 — expect roof / HVAC / electrical / plumbing capex.
Questions for the listing agent
- It's been on market 120 days. Have you received any prior offers? Is the seller open to a 9% concession, seller financing, or rate buy-down credit?
- Have any recent inspections been done? Can we get a copy of the seller's disclosures and any deferred-maintenance estimates?
- Built in 1925 — when were the roof, HVAC, electrical panel, plumbing, and water heater last replaced?
- Property tax is high relative to price — has the assessment been appealed recently, and will the sale trigger a re-assessment?
- Why hasn't it sold? Are there any deal-killer items the seller is aware of (foundation, flood, title, zoning, code violations)?
- Is there a deadline driving the sale (1031 exchange, divorce, estate, relocation)? That informs how much negotiation room exists.
- Crime grade is F in this area — have there been break-ins, vandalism, or insurance claims at this property in the last 3 years? What carrier currently insures it and at what premium?
- What's the average days-on-market for RENTAL listings here right now (not sales)? A rising rental-DOM trend means longer vacancies and softer asking-rent achievability than the comps imply.
- What's the recent tenant-quality profile in this submarket — average credit score on applications, eviction rate, late-payment / NSF rate, and stable-employment percentage? A property-management company in the area should have these aggregated.
- How much new for-sale + rental construction is in the pipeline within 1–3 miles? Heavy new supply typically softens prices + rents 12–24 months out; constrained supply supports both.
Investment metrics
- 1% rule
- 1.43% ✓
- Cap rate
- 9.70%
- Cash-on-cash
- 12.17%
- DSCR
- 1.54
- GRM
- 5.8
CMA / ARV
- ARV (median comp)
- $223,196
- List price
- $90,000
- Delta
- -59.68%
- Verdict
- UNDERPRICED
- Comps
- 3 within 1.0 mi
Show comp detail 1 sale within ~0.75 mi
| Address | Dist | Beds/Ba | Sqft | Sold | Price | $/sf | Match |
|---|---|---|---|---|---|---|---|
| 54 Pepper Hill Rd | 0.34mi | 4/1.0 (+1) | 1,680 (-8%) | 21mo | $180,900 | $108 | 45 |
Match score weights: distance 35% · size 25% · config 20% · recency 20%. Top-matched comps best support the ARV.
Projected returns pro-forma
6.64% appreciation · 3.0% rent growth · sell at horizon
- IRR
- 26.8%
- Equity multiple
- 2.82×
- Total profit
- $45,843
- Equity at exit
- $60,269
- IRR
- 24.8%
- Equity multiple
- 5.82×
- Total profit
- $121,529
- Equity at exit
- $112,632
Cash invested: $25,200 (down + closing). Projections, not guarantees.
Landlord ↔ Tenant lean methodology
- Overall (STATE)
- 15 Strongly Tenant-Friendly
- State New York
- 15 Strongly Tenant-Friendly · D+10
- County
- — inherits STATE
- City
- — inherits STATE
ZIP-level market 12958
- Home prices YoY
- 2.4%
- Active inventory
- 16
- Price-to-rent
- 5.8×
Monthly cashflow live
- Estimated rent
- $1,290 medium interval (Pro) →
- Mortgage (P&I)
- −$472
- Tax from tax record
- −$254 /mo · $3,046/yr
- Insurance
- −$38
- HOA
- −$0
- Vacancy / Maint / Mgmt
- −$271
- Net cashflow
- $256
Break-even live
UW: 25.0% down · 7.5% · 30yr · 1.5% tax · 5.0% vac · 8.0% maint · 8.0% mgmt
Financing live
Cash to close
- Down payment
- $22,500
- Closing costs
- $2,700
- Reserves months
- —
- Total cash needed
- —
Loan-product check · same deal, 3 products live
Conventional
25% down · 7.5% · 30yr
- Down + closing
- —
- Monthly P&I
- —
- Monthly cashflow
- —
- DSCR
- —
- Eligible?
- —
Personal DTI + credit; lowest rate.
DSCR
20% down · 8.5% · 30yr
- Down + closing
- —
- Monthly P&I
- —
- Monthly cashflow
- —
- DSCR
- —
- Eligible?
- —
No personal income docs; deal must DSCR.
Hard money
10% down · 12.0% · 12mo
- Down + closing
- —
- Monthly P&I
- —
- Monthly cashflow
- —
- DSCR
- —
- Eligible?
- —
Short-term bridge; refi at stabilization.
Listing history 17 events
-
2026-06-18days on market $90,000 Active 120 DOM
-
2026-06-17days on market $90,000 Active 119 DOM
-
2026-06-16days on market $90,000 Active 118 DOM
-
2026-06-15days on market $90,000 Active 117 DOM
-
2026-06-13days on market $90,000 Active 115 DOM
-
2026-06-12days on market $90,000 Active 114 DOM
-
2026-06-09days on market $90,000 Active 111 DOM
-
2026-06-08days on market $90,000 Active 110 DOM
-
2026-06-07days on market $90,000 Active 109 DOM
-
2026-06-07days on market $90,000 Active 108 DOM
-
2026-06-04days on market $90,000 Active 105 DOM
-
2026-06-02days on market $90,000 Active 104 DOM
-
2026-06-01days on market $90,000 Active 103 DOM
-
2026-05-31days on market $90,000 Active 102 DOM
-
2026-02-18$90,000 Active 1112-char remark
Show marketing remark (1112 chars)
Imagine the possibilities! This 3, possibly 4 bedroom former Church is ready for you to finish and turn into your own private residence or investment property! Conveniently located on Rt. 11 in Mooers Forks this building was originally designed and constructed in 1925 as the Methodist Church of Mooers and its ready for you to complete to realize its full potential. Renovations have already begun and are partially done. The build plan has been professionally engineered with much of the framing, electrical, plumbing and sheet rock already installed. A second floor has been added for additional living space featuring three rooms and a bathroom. The flexible floor plan allows an easy conversion into a duplex if you desire and is already plumbed to have a second kitchen installed. Cathedral ceilings and large windows allow in abundant natural light and feature an open concept floor plan with original real hardwood floors! Opportunity awaits you to transform this unique and historic building into your dream home or investment property. Motivated seller has it priced to sell well below assessed value!
-
2024-06-27price $99,000
-
2024-06-12price $109,000
ⓘ Source: listings_history table (triggers on properties + properties_extension) + one-shot
backfill from property_details.listing_events for pre-trigger history.
Tax reassessment forecast NY · Partial reset (capped growth)
- Current annual tax
- $3,046 · $254/mo
- Projected year-2 tax
- $3,046 · $254/mo
- Expected delta
- $0/yr ($0/mo · 0.0%)
ⓘ Screening estimate from a state-policy table — verify with the county assessor before closing.
Nearby sold comps map
Loading sold comps map…
Walkable amenities ~0.75 mi
Loading nearby amenities…
Taxation est. · year 1
- Rental income
- $15,478
- − Mortgage interest
- −$5,041
- − Property taxes
- −$3,046
- − Insurance
- −$450
- − Repairs & maintenance
- −$1,238
- − Management
- −$1,238
- − Depreciation
- −$2,618
- Taxable income
- $1,846
- Est. tax owed @ 24.0%
- −$443
- After-tax cash flow
- $2,625/yr
For passive investors: Depreciation is non-cash, so a rental often shows a tax loss while cash-flowing — sheltering income. Rental losses are passive: they offset passive income freely, and up to $25,000/yr can offset ordinary (W-2) income if you actively participate and your MAGI is under $100k (phasing out to $0 by $150k); unused losses carry forward. On sale, claimed depreciation is recaptured at up to 25%, and gains may owe capital-gains tax (a 1031 exchange can defer both). Figures are a year-1 estimate at your 24.0% rate — not tax advice; consult a CPA.
Condition & rehab AI · 12 photos
This former church building requires moderate renovations to complete the interior and exterior, but has the potential to be a unique and functional private residence or investment property.
Repairs flagged
- Major roof — Rusty metal roof
- Major exterior siding — Exposed framing
- Major kitchen appliances — Exposed framing
- Major bathroom fixtures — Exposed framing
- Major HVAC system — Exposed ductwork
Value-add opportunities
- Both Complete kitchen and bathroom — Modernize and increase functionality
- Both Replace roof and exterior siding — Increase curb appeal and safety
- Both Install HVAC system — Improve comfort and energy efficiency
Renovation cost estimate screening
| Repair item | Severity | Est. cost |
|---|---|---|
| roof · Rusty metal roof | Major | $15,000–50,000 |
| exterior siding · Exposed framing | Major | $15,000–50,000 |
| kitchen appliances · Exposed framing | Major | $15,000–50,000 |
| bathroom fixtures · Exposed framing | Major | $15,000–50,000 |
| HVAC system · Exposed ductwork | Major | $15,000–50,000 |
| Total estimated repair cost · 5 items | $75,000–250,000 |
Value-add ROI direction
- Both Complete kitchen and bathroom — Modernize and increase functionality ↑
- Both Replace roof and exterior siding — Increase curb appeal and safety ↑
- Both Install HVAC system — Improve comfort and energy efficiency ↑
ⓘ Cost ranges are severity-bucket heuristics (US national rule-of-thumb). Get contractor quotes + a written scope before underwriting a rehab budget.
Schools (NCES district)
- District
- Northeastern Clinton Central School District
- NCES district ID
- 3621250
- Math proficiency
- 63% ▼ -1.00%
- Reading proficiency
- 63% ▲ 6.00%
- Median HH income
- $48,921
- Composite
- 53.46/100
- National rank
- #1461
- State rank
- #203 of 590 in NY
Livability — Mooers
- Score
- 66/100
- State rank
- #660
- US rank
- #12307
Category grades
Schools grade is shown separately in the Schools card above.
Census & demographics
- Population (ZIP)
- 1,650
Population outlook (Clinton County) Hauer SSP2
- Today (2025)
- 78,791 people
- By 2030
- 76,848 · -2.5%
- By 2040
- 71,579 · -9.2%
- By 2050
- 66,471 · -15.6%
- By 2075
- 57,361 · -27.2%
- By 2100
- 47,232 · -40.1%
Race, ethnicity, and origin ACS 2023
- Neighborhood character
- Predominantly White (100%)
- Race & ethnicity
- White 100%
- Common ancestry
- Lithuanian 13% Slovak 4% German 3%
- Foreign-born
- 1% · Canada
- Languages at home
- 99% English-only · Other Indo-European 1%
Political lean MEDSL · Clinton
- 2024 margin
- Toss-up / Even · D 48.9% · R 51.1%
- 2008→2024 swing
- -25.1pp toward R · 2008: 22.9pp · 2024: -2.2pp
- All cycles
- 2024: R+2.2 2020: D+5.2 2016: D+0.9 2012: D+25.6 2008: D+22.9
Not yet ingested
- Civics
- —
Market trends
- HPI YoY
- ▲ 6.64%
- Current HPI
- 284.9337
- Rent YoY
- —
- Metro
- —
- State GDP YoY
- ▲ 2.60%
- F500 in state
- 92
Industry mix (Fortune 500 HQ in NY)
| Industry | F500 HQs | Revenue |
|---|---|---|
| Financial Services | 10 | $950B |
|
||
| Consumer Goods | 9 | $162B |
|
||
| Insurance | 4 | $225B |
|
||
| Telecommunications | 2 | $144B |
|
||
| Pharmaceuticals | 2 | $112B |
|
||
| Media / Entertainment | 2 | $69B |
|
||
Price history
-17.4% since first listed3 events — show timeline
- 2026-02-18 Listed $90,000 ACVMLS
- 2024-06-27 Price Changed $99,000 ACVMLS
- 2024-06-12 Price Changed $109,000 ACVMLS
Property tax history
-1.4%/yrLatest (2025): $3,046 · +3.1% YoY. Source: county tax records.
Cash-flow waterfall
monthlySold comps — $/sqft
last 12 mo · ≤1 miLoading sold comps…