356 Stone Creek Rd · Hardy, AR
Flood risk 1/10 · Minimal
- FEMA flood zone
- X (unshaded)
- Chance of flooding over 30 yrs
- 0.0%
- Est. flood insurance / yr
- $507 – $1,088
Fire risk 4/10 · Minor
- Est. fire insurance / yr
- $1,499 – $2,785
Heat risk 5/10 · Moderate
- Hot days now (above 108°F)
- 7 days/yr
- Hot days in 30 yrs
- 20 days/yr
Wind risk 2/10 · Minimal
- Chance of severe wind over 30 yrs
- 4.0%
Air-quality risk 1/10 · Minimal
- Unhealthy air days now
- 0 days/yr
- Unhealthy air days in 30 yrs
- 0 days/yr
Risk factors via First Street. Map © Google.
Why this score? — see what drove the B- grade
The composite is a weighted blend of 9 inputs, each scored 0–100. Each bar is that input's sub-score; the figure is the points it added to the 100-point composite (weight × sub-score).
- Cash flow +28.7/30.0
- DSCR +10.0/10.0
- Appreciation +10.0/10.0
- 1% rule +6.9/10.0
- Schools +3.4/10.0
- Livability +3.1/5.0
- Rent growth +2.5/5.0
- Condition / age +2.5/5.0
- ARV discount +0.0/15.0
$119,900
🖨 Deal sheet 📄 Offer letter ✓ Due diligence
Listing remarks MLS
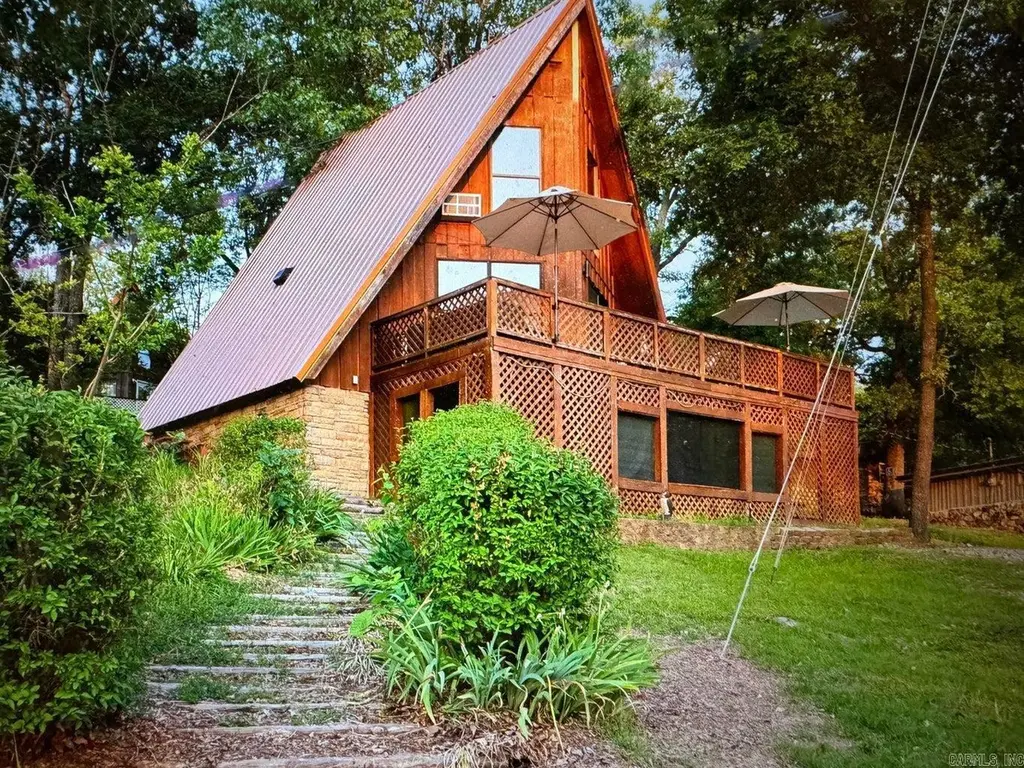
Super neat furnished A-frame cabin with lake view. Home has a metal roof and is updated and ready to go! This one bedroom A-frame has a full and a half bath, as well as an open floor plan. Large deck with a lake view to enjoy outdoor living or just sit and watch the sunsets.
Key facts
- Large deck
- Open floor plan
- Metal roof
Tags
Neighborhood map
What this means for you Summary
Snapshot
- This is a 1-bed/1.0-bath single-family listed at $120k.
Deal economics
- At list price, monthly cash flow is $400 ($5k/yr) — positive.
- The deal already cash-flows at list — no discount required.
- Meets the 1% rule at list price ($1k rent vs $120k).
- Recommended offer: $106k (12.0% below list) — sets the bar for market timing.
Location & tenants
- Location reads 62/100 on livability (#207 in AR) — a middle-class / working-renter tenant base. Strengths: cost of living A+, health & safety A, crime B+; Watch: housing D, schools D-, amenities F.
- Highland School District (town): math 43% / reading 39% proficiency, ranked #66 of 238 in AR (top 28%) — families likely to look elsewhere, expect single-tenant / working-renter base with shorter leases.
- Market conditions: 131 active listings in the ZIP; 4 units permitted in Sharp County in 2024 (0 in 5+ unit buildings).
Forward outlook
- In year one you build about $13k of equity ($829 loan paydown + $12k appreciation (10.0% local appreciation)).
- Sharp County population projected at -11% by 2050 — secular population decline; favor cash flow + early exit over multi-decade hold.
- At projected returns (10.0% appreciation + 3.0% rent growth), your $34k cash investment doubles in ~2 years — after that, you're playing with house money.
- By year 3, paydown + projected appreciation supports a ~$32k cash-out refi (75% LTV) — recoverable capital for the next deal without selling this one.
Negotiation context
- It's been on market 444 days — a 12% lower offer ($106k) is reasonable based on typical stale-listing flexibility.
- 6 sale attempts since 4y ago; this cycle's ask has dropped $10k (8%) from the opening price — seller is motivated, your offer sets the floor, not the list.
- Current owner paid $75k; list at $120k implies a 60% gain — meaningful room to come down on a strong offer.
Risks & watch-outs
- Climate carrying-cost: extreme-heat days projected 7→20/yr by 2055 (HVAC capex compounding) — expect insurance premiums to compound above CPI over the hold.
Questions for the listing agent
- It's been on market 444 days. Have you received any prior offers? Is the seller open to a 12% concession, seller financing, or rate buy-down credit?
- Why hasn't it sold? Are there any deal-killer items the seller is aware of (foundation, flood, title, zoning, code violations)?
- Is there a deadline driving the sale (1031 exchange, divorce, estate, relocation)? That informs how much negotiation room exists.
- Schools are D-rated, which usually means shorter tenancies and higher turnover. Who's the typical renter profile here, and what's been the actual vacancy rate?
- What's the average days-on-market for RENTAL listings here right now (not sales)? A rising rental-DOM trend means longer vacancies and softer asking-rent achievability than the comps imply.
- What's the recent tenant-quality profile in this submarket — average credit score on applications, eviction rate, late-payment / NSF rate, and stable-employment percentage? A property-management company in the area should have these aggregated.
- How much new for-sale + rental construction is in the pipeline within 1–3 miles? Heavy new supply typically softens prices + rents 12–24 months out; constrained supply supports both.
Investment metrics
- 1% rule
- 1.19% ✓
- Cap rate
- 10.30%
- Cash-on-cash
- 14.30%
- DSCR
- 1.64
- GRM
- 7.0
CMA / ARV
- ARV (median comp)
- $97,301
- List price
- $119,900
- Delta
- 23.23%
- Verdict
- OVERPRICED
- Comps
- 20 within 1.0 mi
Show comp detail 3 sales within ~0.75 mi
| Address | Dist | Beds/Ba | Sqft | Sold | Price | $/sf | Match |
|---|---|---|---|---|---|---|---|
| 19 Riverview Ln | 0.15mi | 1/1.0 | 928 (0%) | 20mo | $125,000 | $135 | 77 |
| 108 Sequoyah Ridge Rd Rdg | 0.53mi | 2/1.0 (+1) | 960 (+3%) | 6mo | $50,000 | $52 | 59 |
| 7 Walsh Dr | 0.27mi | 2/1.0 (+1) | 1,036 (+12%) | 6mo | $124,900 | $121 | 57 |
Match score weights: distance 35% · size 25% · config 20% · recency 20%. Top-matched comps best support the ARV.
Projected returns pro-forma
10.0% appreciation · 3.0% rent growth · sell at horizon
- IRR
- 34.8%
- Equity multiple
- 3.70×
- Total profit
- $90,730
- Equity at exit
- $108,015
- IRR
- 30.0%
- Equity multiple
- 8.36×
- Total profit
- $247,072
- Equity at exit
- $232,939
Cash invested: $33,572 (down + closing). Projections, not guarantees.
Landlord ↔ Tenant lean methodology
- Overall (STATE)
- 92 Strongly Landlord-Friendly
- State Arkansas
- 92 Strongly Landlord-Friendly · R+14
- County
- — inherits STATE
- City
- — inherits STATE
ZIP-level market 72542
- Home prices YoY
- 26.5%
- Active inventory
- 131
- Price-to-rent
- 7.0×
Monthly cashflow live
- Estimated rent
- $1,424 medium interval (Pro) →
- Mortgage (P&I)
- −$629
- Tax from tax record
- −$47 /mo · $559/yr
- Insurance
- −$50
- HOA
- −$0
- Vacancy / Maint / Mgmt
- −$299
- Net cashflow
- $400
Break-even live
UW: 25.0% down · 7.5% · 30yr · 1.5% tax · 5.0% vac · 8.0% maint · 8.0% mgmt
Financing live
Cash to close
- Down payment
- $29,975
- Closing costs
- $3,597
- Reserves months
- —
- Total cash needed
- —
Loan-product check · same deal, 3 products live
Conventional
25% down · 7.5% · 30yr
- Down + closing
- —
- Monthly P&I
- —
- Monthly cashflow
- —
- DSCR
- —
- Eligible?
- —
Personal DTI + credit; lowest rate.
DSCR
20% down · 8.5% · 30yr
- Down + closing
- —
- Monthly P&I
- —
- Monthly cashflow
- —
- DSCR
- —
- Eligible?
- —
No personal income docs; deal must DSCR.
Hard money
10% down · 12.0% · 12mo
- Down + closing
- —
- Monthly P&I
- —
- Monthly cashflow
- —
- DSCR
- —
- Eligible?
- —
Short-term bridge; refi at stabilization.
Listing history 32 events
-
2026-06-19days on market $119,900 Active 444 DOM
-
2026-06-18days on market $119,900 Active 443 DOM
-
2026-06-17days on market $119,900 Active 442 DOM
-
2026-06-16days on market $119,900 Active 441 DOM
-
2026-06-15days on market $119,900 Active 440 DOM
-
2026-06-14days on market $119,900 Active 438 DOM
-
2026-06-12days on market $119,900 Active 437 DOM
-
2026-06-09days on market $119,900 Active 434 DOM
-
2026-06-08days on market $119,900 Active 433 DOM
-
2026-06-07days on market $119,900 Active 432 DOM
-
2026-06-04days on market $119,900 Active 428 DOM
-
2026-06-02days on market $119,900 Active 427 DOM
-
2026-06-01days on market $119,900 Active 426 DOM
-
2026-05-31days on market $119,900 Active 425 DOM
-
2026-05-31days on market $119,900 Active 424 DOM
-
2026-03-19price $119,900 275-char remark
Show marketing remark (275 chars)
Super neat furnished A-frame cabin with lake view. Home has a metal roof and is updated and ready to go! This one bedroom A-frame has a full and a half bath, as well as an open floor plan. Large deck with a lake view to enjoy outdoor living or just sit and watch the sunsets.
-
2025-04-01$129,900 New Listing 275-char remark
Show marketing remark (275 chars)
Super neat furnished A-frame cabin with lake view. Home has a metal roof and is updated and ready to go! This one bedroom A-frame has a full and a half bath, as well as an open floor plan. Large deck with a lake view to enjoy outdoor living or just sit and watch the sunsets.
-
2025-04-01$129,900 Active 275-char remark
Show marketing remark (275 chars)
Super neat furnished A-frame cabin with lake view. Home has a metal roof and is updated and ready to go! This one bedroom A-frame has a full and a half bath, as well as an open floor plan. Large deck with a lake view to enjoy outdoor living or just sit and watch the sunsets.
-
2025-02-28historical
-
2025-01-23price $144,900
-
2025-01-22price $144,900
-
2024-11-10$149,900 Active
-
2024-11-09$149,900 New Listing
-
2022-10-25$79,900
-
2022-10-24soldstatus $75,000
-
2022-10-21soldstatus $75,000 Sold
-
2022-10-18soldstatus $75,000
-
2022-09-06status Under Contract
-
2022-08-21$79,900 New Listing
-
2010-12-20soldstatus $20,000
-
2009-04-17soldstatus $290,500
ⓘ Source: listings_history table (triggers on properties + properties_extension) + one-shot
backfill from property_details.listing_events for pre-trigger history.
Tax reassessment forecast AR · Resets to sale price
- Current annual tax
- $559 · $47/mo
- Projected year-2 tax
- $767 · $64/mo
- Expected delta
- +$208/yr (+$17/mo · 37.2%)
ⓘ Screening estimate from a state-policy table — verify with the county assessor before closing.
Climate risk First Street
- Flood 1/10 Low FEMA zone X (unshaded) · 0% chance over 30 yrs
- Wildfire 4/10 Moderate
- Heat 5/10 Major 7 d/yr ≥108°F today · 20 d/yr by 30 yrs out
- Wind 2/10 Low 4% chance of damaging wind over 30 yrs
- Air quality 1/10 Low 0 unhealthy d/yr today · 0 by 30 yrs out
Nearby sold comps map
Loading sold comps map…
Walkable amenities ~0.75 mi
Loading nearby amenities…
Taxation est. · year 1
- Rental income
- $17,093
- − Mortgage interest
- −$6,716
- − Property taxes
- −$559
- − Insurance
- −$600
- − Repairs & maintenance
- −$1,367
- − Management
- −$1,367
- − Depreciation
- −$3,488
- Taxable income
- $2,995
- Est. tax owed @ 24.0%
- −$719
- After-tax cash flow
- $4,080/yr
For passive investors: Depreciation is non-cash, so a rental often shows a tax loss while cash-flowing — sheltering income. Rental losses are passive: they offset passive income freely, and up to $25,000/yr can offset ordinary (W-2) income if you actively participate and your MAGI is under $100k (phasing out to $0 by $150k); unused losses carry forward. On sale, claimed depreciation is recaptured at up to 25%, and gains may owe capital-gains tax (a 1031 exchange can defer both). Figures are a year-1 estimate at your 24.0% rate — not tax advice; consult a CPA.
Schools (NCES district)
- District
- Highland School District
- NCES district ID
- 0507770
- Math proficiency
- 43% ▼ -7.00%
- Reading proficiency
- 39% ▼ -9.00%
- Median HH income
- $32,066
- Composite
- 33.63/100
- National rank
- #5400
- State rank
- #66 of 238 in AR
Livability — Hardy
- Score
- 62/100
- State rank
- #207
- US rank
- #16276
Category grades
Schools grade is shown separately in the Schools card above.
Census & demographics
- Population (ZIP)
- 3,829
Population outlook (Sharp County) Hauer SSP2
- Today (2025)
- 16,170 people
- By 2030
- 15,711 · -2.8%
- By 2040
- 14,974 · -7.4%
- By 2050
- 14,420 · -10.8%
- By 2075
- 13,235 · -18.2%
- By 2100
- 11,492 · -28.9%
Race, ethnicity, and origin ACS 2023
- Neighborhood character
- Predominantly White (88%)
- Race & ethnicity
- White 88% Two or more races 9% Asian 1%
- Common ancestry
- Lithuanian 9% Slovak 3% Italian 2%
- Foreign-born
- 1%
- Languages at home
- 99% English-only · Other Indo-European 1%
Political lean MEDSL · Sharp
- 2024 margin
- Solid R (+62.7) · D 17.7% · R 80.4% · Other 1.9%
- 2008→2024 swing
- -33.7pp toward R · 2008: -28.9pp · 2024: -62.7pp
- All cycles
- 2024: R+62.7 2020: R+60.0 2016: R+54.7 2012: R+38.8 2008: R+28.9
Not yet ingested
- Civics
- —
Market trends
- HPI YoY
- ▲ 40.05%
- Current HPI
- 191.38
- Rent YoY
- —
- Metro
- —
- State GDP YoY
- ▲ 3.80%
- F500 in state
- 10
Industry mix (Fortune 500 HQ in AR)
| Industry | F500 HQs | Revenue |
|---|---|---|
| Retail | 1 | $681B |
|
||
| Food / Agriculture | 1 | $53B |
|
||
| Retail / Energy | 1 | $22B |
|
||
| Transportation / Logistics | 1 | $12B |
|
||
| Energy | 1 | $4B |
|
||
Price history
-58.7% since first listed17 events — show timeline
- 2026-03-19 Price Changed $119,900 CARMLS
- 2026-03-19 Price Changed $119,900 Batesville
- 2025-04-01 Listed $129,900 Batesville
- 2025-04-01 Listed $129,900 CARMLS
- 2025-02-28 Listing Removed — CARMLS
- 2025-01-23 Price Changed $144,900 CARMLS
- 2025-01-22 Price Changed $144,900 Batesville
- 2024-11-10 Listed $149,900 Batesville
- 2024-11-09 Listed $149,900 CARMLS
- 2022-10-25 Listed $79,900 Batesville
- 2022-10-24 Sold (Public Records) $75,000 Public Records
- 2022-10-21 Sold (MLS) $75,000 CARMLS
- 2022-10-18 Sold (MLS) $75,000 Batesville
- 2022-09-06 Pending — CARMLS
- 2022-08-21 Listed $79,900 CARMLS
- 2010-12-20 Sold (Public Records) $20,000 Public Records
- 2009-04-17 Sold (Public Records) $290,500 Public Records
Property tax history
+11.1%/yrLatest (2025): $559 · +0.0% YoY. Source: county tax records.
Cash-flow waterfall
monthlySold comps — $/sqft
last 12 mo · ≤1 miLoading sold comps…