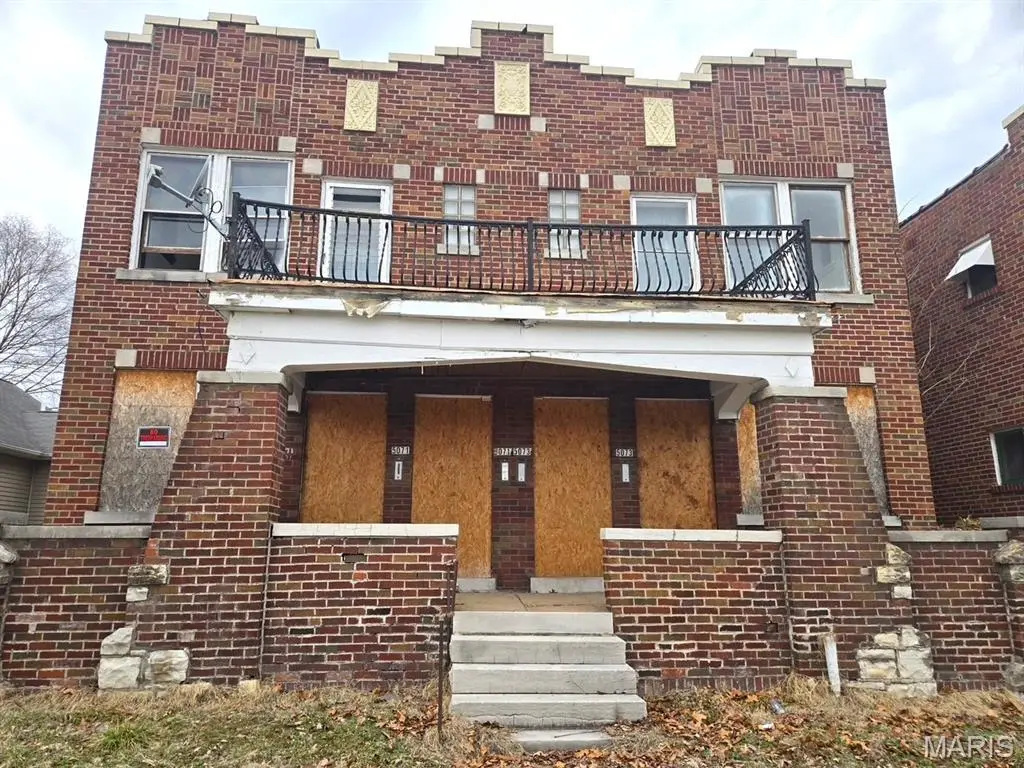
 Fourplex
5071 Ruskin Ave · St. Louis, MO
Flood risk 1/10 · Minimal
- FEMA flood zone
- X (unshaded)
- Chance of flooding over 30 yrs
- 0.0%
- Est. flood insurance / yr
- $473 – $860
Fire risk 1/10 · Minimal
- Est. fire insurance / yr
- $1,054 – $1,958
Heat risk 5/10 · Moderate
- Hot days now (above 107°F)
- 7 days/yr
- Hot days in 30 yrs
- 21 days/yr
Wind risk 2/10 · Minimal
- Chance of severe wind over 30 yrs
- 1.0%
Air-quality risk 4/10 · Minor
- Unhealthy air days now
- 5 days/yr
- Unhealthy air days in 30 yrs
- 6 days/yr
Risk factors via First Street. Map © Google.
Why this score? — see what drove the B grade
The composite is a weighted blend of 9 inputs, each scored 0–100. Each bar is that input's sub-score; the figure is the points it added to the 100-point composite (weight × sub-score).
- Cash flow +30.0/30.0
- ARV discount +11.9/15.0
- 1% rule +10.0/10.0
- DSCR +10.0/10.0
- Appreciation +3.3/10.0
- Rent growth +2.5/5.0
- Livability +2.5/5.0
- Condition / age +2.5/5.0
- Schools +1.2/10.0
$97,000
🖨 Deal sheet 📄 Offer letter ✓ Due diligence
Multi-family units
County records classify this as Multi-Family (2-4 Unit). Listing-text estimate: 4 units. confirmed
Listing remarks MLS
Great value-add opportunity in the Mark Twain area of St. Louis. This 4-family property features four 1-bedroom, 1-bath units and offers strong potential for investors looking for a fixer-upper or renovation project. While the building does need updates, some existing finishes provide a solid starting point for improvements. With the right vision, this property can be transformed into a strong income-producing asset. Ideal for investors seeking a renovation project, rental portfolio addition, or long-term value appreciation in the St. Louis market. Please contact co-listing agent for all questions or requests regarding this listing.
Key facts
- Mark twain area
- Renovation project
- Fixer-upper
Tags
Neighborhood map
What this means for you Summary
Snapshot
- This is a 4 × 1-bed/1-bath units multifamily listed at $97k.
Deal economics
- At list price, monthly cash flow is $2k ($25k/yr) — positive. Per door: $529/mo.
- The deal already cash-flows at list — no discount required.
- Meets the 1% rule at list price ($3k rent vs $97k).
- Recommended offer: $88k (9.0% below list) — sets the bar for market timing.
- Cap rate 32.5% vs local median 5.0% in St. Louis — top-decile yield for the area; either an underpriced asset or a hidden risk that comps aren't pricing in. Stress-test before assuming the spread holds.
Location & tenants
- Location reads: area grade B — affects rentability + tenant quality, not the cash-flow math above.
- St. Louis City (urban): math 10% / reading 18% proficiency, ranked #312 of 324 in MO (top 96%) — low school quality limits family demand, transient renter base, plan for 1-2y turnover; 80% free/reduced lunch — lower-income household profile, screen leases tightly.
- Market conditions: 97 active listings in the ZIP; lower-income renter base — watch delinquency; 294 units permitted in St. Louis city in 2024 (227 in 5+ unit buildings).
- At $3,414/mo this rent would consume 134% of the median local household income ($31k/yr) (locally 1655% of renters already pay >50% of income on rent) — very limited rent-growth headroom before tenants either downsize or default.
Forward outlook
- Local home prices are declining (-3.0%/yr); year-one equity from $671 of loan paydown is wiped out by about $3k of value loss. Plan a longer hold.
- St. Louis County population projected to shrink 6% by 2050 — rents likely to lag national; underwrite the cash flow, not the appreciation.
- At projected returns (-3.0% appreciation + 3.0% rent growth), your $27k cash investment doubles in ~2 years — after that, you're playing with house money.
Negotiation context
- It's been on market 102 days — a 9% lower offer ($88k) is reasonable based on typical stale-listing flexibility.
- 2 sale attempts with the ask held roughly flat each time — persistent listings suggest the price (not the market) is what's stuck; bring a comps-based counter.
Risks & watch-outs
- Watch-outs: built in 1935 — expect roof / HVAC / electrical / plumbing capex.
- Climate carrying-cost: extreme-heat days projected 7→21/yr by 2055 (HVAC capex compounding) — expect insurance premiums to compound above CPI over the hold.
Questions for the listing agent
- It's been on market 102 days. Have you received any prior offers? Is the seller open to a 9% concession, seller financing, or rate buy-down credit?
- Can we see the unit-by-unit rent roll, current vacancy, and any below-market leases? What's the average tenancy length?
- What capital expenditures (roof, boiler, parking lot, exteriors) have been made in the last 5 years, and what's planned in the next 2?
- Built in 1935 — when were the roof, HVAC, electrical panel, plumbing, and water heater last replaced?
- Why hasn't it sold? Are there any deal-killer items the seller is aware of (foundation, flood, title, zoning, code violations)?
- Is there a deadline driving the sale (1031 exchange, divorce, estate, relocation)? That informs how much negotiation room exists.
- What's the average days-on-market for RENTAL listings here right now (not sales)? A rising rental-DOM trend means longer vacancies and softer asking-rent achievability than the comps imply.
- What's the recent tenant-quality profile in this submarket — average credit score on applications, eviction rate, late-payment / NSF rate, and stable-employment percentage? A property-management company in the area should have these aggregated.
- How much new apartment / multifamily construction is in the pipeline within 1–3 miles? Heavy new supply (>2% of stock underway) typically softens rents 12–24 months out; light construction supports rent growth.
Investment metrics
- 1% rule
- 3.52% ✓
- Cap rate
- 32.46%
- Cash-on-cash
- 93.46%
- DSCR
- 5.16
- GRM
- 2.4
CMA / ARV
- ARV (median comp)
- $107,442
- List price
- $97,000
- Delta
- -9.72%
- Verdict
- FAIR
- Comps
- 20 within 1.0 mi
Show comp detail 1 sale within ~0.75 mi
| Address | Dist | Beds/Ba | Sqft | Sold | Price | $/sf | Match |
|---|---|---|---|---|---|---|---|
| 5444 Beacon | 0.52mi | 16/16.0 | 3,790 (+12%) | 7mo | $90,000 | $24 | 31 |
Match score weights: distance 35% · size 25% · config 20% · recency 20%. Top-matched comps best support the ARV.
Projected returns pro-forma
-3.0% appreciation · 3.0% rent growth · sell at horizon
- IRR
- 94.3%
- Equity multiple
- 5.38×
- Total profit
- $119,007
- Equity at exit
- $14,463
- IRR
- 97.0%
- Equity multiple
- 11.20×
- Total profit
- $277,101
- Equity at exit
- $8,387
Cash invested: $27,160 (down + closing). Projections, not guarantees.
Landlord ↔ Tenant lean methodology
- Overall (STATE)
- 81 Strongly Landlord-Friendly
- State Missouri
- 81 Strongly Landlord-Friendly · R+10
- County
- — inherits STATE
- City
- — inherits STATE
ZIP-level market 63115
- Home prices YoY
- -2.6%
- Active inventory
- 97
- Price-to-rent
- 9.5×
Monthly cashflow live
- Estimated rent
- $3,414 high interval (Pro) →
- Mortgage (P&I)
- −$509
- Tax from tax record
- −$33 /mo · $391/yr
- Insurance
- −$40
- HOA
- −$0
- Vacancy / Maint / Mgmt
- −$717
- Net cashflow
- $2,115
Break-even live
4-unit breakdown (identical units grouped — click to expand)
| Units | Beds | Baths | Est. rent |
|---|---|---|---|
| 4× units | 1 | 1 | $3,412 |
| #1 | 1 | 1 | $853 |
| #2 | 1 | 1 | $853 |
| #3 | 1 | 1 | $853 |
| #4 | 1 | 1 | $853 |
| Total (4 units) | $3,414 | ||
UW: 25.0% down · 7.5% · 30yr · 1.5% tax · 5.0% vac · 8.0% maint · 8.0% mgmt
Financing live
Cash to close
- Down payment
- $24,250
- Closing costs
- $2,910
- Reserves months
- —
- Total cash needed
- —
Loan-product check · same deal, 3 products live
Conventional
25% down · 7.5% · 30yr
- Down + closing
- —
- Monthly P&I
- —
- Monthly cashflow
- —
- DSCR
- —
- Eligible?
- —
Personal DTI + credit; lowest rate.
DSCR
20% down · 8.5% · 30yr
- Down + closing
- —
- Monthly P&I
- —
- Monthly cashflow
- —
- DSCR
- —
- Eligible?
- —
No personal income docs; deal must DSCR.
Hard money
10% down · 12.0% · 12mo
- Down + closing
- —
- Monthly P&I
- —
- Monthly cashflow
- —
- DSCR
- —
- Eligible?
- —
Short-term bridge; refi at stabilization.
Listing history 20 events
-
2026-06-18days on market $97,000 Active 102 DOM
-
2026-06-17days on market $97,000 Active 101 DOM
-
2026-06-16days on market $97,000 Active 100 DOM
-
2026-06-15days on market $97,000 Active 99 DOM
-
2026-06-13days on market $97,000 Active 97 DOM
-
2026-06-09days on market $97,000 Active 93 DOM
-
2026-06-08days on market $97,000 Active 92 DOM
-
2026-06-08days on market $97,000 Active 91 DOM
-
2026-06-05days on market $97,000 Active 88 DOM
-
2026-06-03days on market $97,000 Active 87 DOM
-
2026-06-02days on market $97,000 Active 86 DOM
-
2026-06-01days on market $97,000 Active 85 DOM
-
2026-05-31days on market $97,000 Active 84 DOM
-
2026-04-03status Active 641-char remark
Show marketing remark (641 chars)
Great value-add opportunity in the Mark Twain area of St. Louis. This 4-family property features four 1-bedroom, 1-bath units and offers strong potential for investors looking for a fixer-upper or renovation project. While the building does need updates, some existing finishes provide a solid starting point for improvements. With the right vision, this property can be transformed into a strong income-producing asset. Ideal for investors seeking a renovation project, rental portfolio addition, or long-term value appreciation in the St. Louis market. Please contact co-listing agent for all questions or requests regarding this listing.
-
2026-03-07$99,000 Active 641-char remark
Show marketing remark (641 chars)
Great value-add opportunity in the Mark Twain area of St. Louis. This 4-family property features four 1-bedroom, 1-bath units and offers strong potential for investors looking for a fixer-upper or renovation project. While the building does need updates, some existing finishes provide a solid starting point for improvements. With the right vision, this property can be transformed into a strong income-producing asset. Ideal for investors seeking a renovation project, rental portfolio addition, or long-term value appreciation in the St. Louis market. Please contact co-listing agent for all questions or requests regarding this listing.
-
2023-01-20soldstatus $85,000
-
2023-01-20soldstatus $124,900
-
2022-05-02soldstatus $106,000
-
2021-11-18soldstatus $45,000
-
2021-04-23price $60,600
ⓘ Source: listings_history table (triggers on properties + properties_extension) + one-shot
backfill from property_details.listing_events for pre-trigger history.
Tax reassessment forecast MO · Resets to sale price
- Current annual tax
- $391 · $33/mo
- Projected year-2 tax
- $941 · $78/mo
- Expected delta
- +$550/yr (+$46/mo · 140.5%)
ⓘ Screening estimate from a state-policy table — verify with the county assessor before closing.
Climate risk First Street
- Flood 1/10 Low FEMA zone X (unshaded) · 0% chance over 30 yrs
- Wildfire 1/10 Low
- Heat 5/10 Major 7 d/yr ≥107°F today · 21 d/yr by 30 yrs out
- Wind 2/10 Low 100% chance of damaging wind over 30 yrs
- Air quality 4/10 Moderate 5 unhealthy d/yr today · 6 by 30 yrs out
Nearby sold comps map
Loading sold comps map…
Walkable amenities ~0.75 mi
Loading nearby amenities…
Taxation est. · year 1
- Rental income
- $40,968
- − Mortgage interest
- −$5,434
- − Property taxes
- −$391
- − Insurance
- −$485
- − Repairs & maintenance
- −$3,277
- − Management
- −$3,277
- − Depreciation
- −$2,822
- Taxable income
- $25,282
- Est. tax owed @ 24.0%
- −$6,068
- After-tax cash flow
- $19,317/yr
For passive investors: Depreciation is non-cash, so a rental often shows a tax loss while cash-flowing — sheltering income. Rental losses are passive: they offset passive income freely, and up to $25,000/yr can offset ordinary (W-2) income if you actively participate and your MAGI is under $100k (phasing out to $0 by $150k); unused losses carry forward. On sale, claimed depreciation is recaptured at up to 25%, and gains may owe capital-gains tax (a 1031 exchange can defer both). Figures are a year-1 estimate at your 24.0% rate — not tax advice; consult a CPA.
Schools (NCES district)
- District
- St. Louis City
- NCES district ID
- 2929280
- Math proficiency
- 10% ▼ -6.00%
- Reading proficiency
- 18% ▼ -3.00%
- Median HH income
- $35,685
- Composite
- 11.54/100
- National rank
- #9699
- State rank
- #312 of 324 in MO
Livability — St. Louis
No livability data for this city. (Only ~50 U.S. cities are tracked.)
Census & demographics
- Census place
- St. Louis, MO
- County
- Saint Louis City · 254,015 people
- City population
- 283,259
- Metro
- St. Louis, MO-IL
- Population (ZIP)
- 14,488
- Household income
- $30,622
- Rent vs Own
- Severe rent burden
- 1655.0
Population outlook (St. Louis County) Hauer SSP2
- Today (2025)
- 315,737 people
- By 2030
- 313,865 · -0.6%
- By 2040
- 305,439 · -3.3%
- By 2050
- 296,529 · -6.1%
- By 2075
- 271,028 · -14.2%
- By 2100
- 255,359 · -19.1%
Race, ethnicity, and origin ACS 2023
- Neighborhood character
- Predominantly Black (95%)
- Race & ethnicity
- Black 95% White 2% Two or more races 2%
- Foreign-born
- 0%
Political lean MEDSL · St. Louis
- 2024 margin
- Solid D (+64.7) · D 81.4% · R 16.7% · Other 2.0%
- 2008→2024 swing
- -3.5pp toward R · 2008: 68.2pp · 2024: 64.7pp
- All cycles
- 2024: D+64.7 2020: D+66.2 2016: D+63.7 2012: D+66.6 2008: D+68.2
Not yet ingested
- Civics
- —
Market trends
- HPI YoY
- ▼ -3.42%
- Current HPI
- 127.3403
- Rent YoY
- —
- Metro
- St. Louis, MO-IL
- State GDP YoY
- ▲ 1.84%
- F500 in state
- 20
Industry mix (Fortune 500 HQ in MO)
| Industry | F500 HQs | Revenue |
|---|---|---|
| Healthcare | 1 | $163B |
|
||
| Insurance | 1 | $21B |
|
||
| Industrial Technology | 1 | $17B |
|
||
| Retail | 1 | $16B |
|
||
| Industrial Distribution | 1 | $10B |
|
||
| Utilities | 1 | $9B |
|
||
Price history
+63.4% since first listed7 events — show timeline
- 2026-04-03 Relisted — MARIS as Distributed by MLS Grid
- 2026-03-07 Listed $99,000 MARIS as Distributed by MLS Grid
- 2023-01-20 Sold (Public Records) $124,900 Public Records
- 2023-01-20 Sold (Public Records) $85,000 Public Records
- 2022-05-02 Sold (Public Records) $106,000 Public Records
- 2021-11-18 Sold (Public Records) $45,000 Public Records
- 2021-04-23 Price Changed $60,600 MARIS as Distributed by MLS Grid
Property tax history
+0.4%/yrLatest (2024): $391 · +4.8% YoY. Source: county tax records.
Cash-flow waterfall
monthlySold comps — $/sqft
last 12 mo · ≤1 miLoading sold comps…