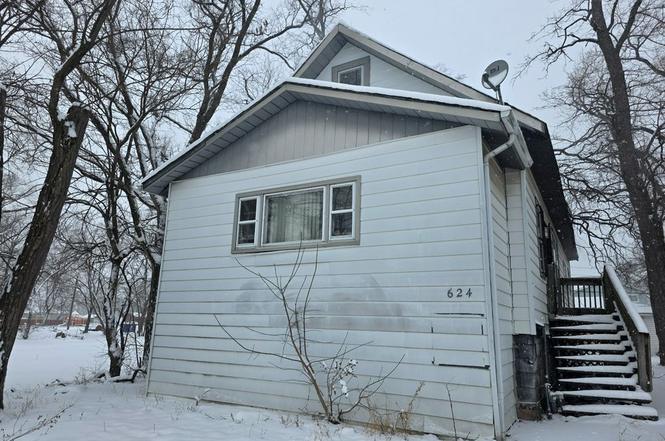
624 Belle Ct · Phoenix, IL
Flood risk 1/10 · Minimal
- FEMA flood zone
- X (unshaded)
- Chance of flooding over 30 yrs
- 0.0%
- Est. flood insurance / yr
- $473 – $860
Fire risk 1/10 · Minimal
- Est. fire insurance / yr
- $804 – $1,492
Heat risk 3/10 · Minor
- Hot days now (above 101°F)
- 7 days/yr
- Hot days in 30 yrs
- 15 days/yr
Wind risk 2/10 · Minimal
- Chance of severe wind over 30 yrs
- —
Air-quality risk 4/10 · Minor
- Unhealthy air days now
- 4 days/yr
- Unhealthy air days in 30 yrs
- 5 days/yr
Risk factors via First Street. Map © Google.
Why this score? — see what drove the B+ grade
The composite is a weighted blend of 9 inputs, each scored 0–100. Each bar is that input's sub-score; the figure is the points it added to the 100-point composite (weight × sub-score).
- Cash flow +30.0/30.0
- 1% rule +10.0/10.0
- DSCR +10.0/10.0
- Appreciation +10.0/10.0
- ARV discount +7.5/15.0
- Livability +3.8/5.0
- Rent growth +2.5/5.0
- Condition / age +2.5/5.0
- Schools +0.7/10.0
$45,000
🖨 Deal sheet 📄 Offer letter ✓ Due diligence
Listing remarks
Tucked away on a quiet residential court, this unassuming home is the kind of opportunity seasoned investors recognize instantly not for what it is today, but for what it can become. At 624 Belle Ct, you're starting with a solid foundation. The home features 2 bedrooms and 1 bath across 792 sq ft, but the real story unfolds beyond the main level. A basement and partially finished attic dramatically expand the usable footprint, opening the door to 34 bedrooms or even a two-unit layout for those exploring value-add or house-hack strategies. The structure is strong, the layout flexible, and the upside compelling. Whether you're planning a fix-and-flip, a long-term buy-and-hold, or a BRRRR exec
Key facts
- Detached garage
- 3,075 sq ft lot
- Built 1926
Tags
Property features AI
Exterior
- Home design: House; 792 square feet of living space
- Exterior features: Lot of approximately 3,075 sq ft
Neighborhood map
What this means for you Summary
Snapshot
- This is a 2-bed/1.0-bath single-family listed at $45k.
Deal economics
- At list price, monthly cash flow is $798 ($10k/yr) — positive.
- The deal already cash-flows at list — no discount required.
- Meets the 1% rule at list price ($1k rent vs $45k).
- Recommended offer: $40k (12.0% below list) — sets the bar for market timing.
Location & tenants
- Location reads 75/100 on livability (#230 in IL, #4,248 nationally) — a middle-class / working-renter tenant base. Strengths: commute A+, cost of living A+, crime A-; Watch: health & safety C-, schools F, amenities F.
- Thornton Twp Hsd 205 (suburban): math 7% / reading 8% proficiency, ranked #594 of 620 in IL (top 96%) — low school quality limits family demand, transient renter base, plan for 1-2y turnover.
- Market conditions: 134 active listings in the ZIP; 3 comparable units currently listed for rent nearby; rentals at typical pace (median 19d on market — plan ~3-4 weeks tenant-placement turnaround); 6,272 units permitted in Cook County in 2024 (4,658 in 5+ unit buildings).
Forward outlook
- In year one you build about $5k of equity ($311 loan paydown + $4k appreciation (10.0% local appreciation)).
- At projected returns (10.0% appreciation + 3.0% rent growth), your $13k cash investment doubles in ~1 year — after that, you're playing with house money.
- By year 7, paydown + projected appreciation supports a ~$35k cash-out refi (75% LTV) — recoverable capital for the next deal without selling this one.
Negotiation context
- It's been on market 123 days — a 12% lower offer ($40k) is reasonable based on typical stale-listing flexibility.
- Current owner paid $28k; list at $45k implies a 64% gain — meaningful room to come down on a strong offer.
Risks & watch-outs
- Watch-outs: built in 1926 — expect roof / HVAC / electrical / plumbing capex.
Questions for the listing agent
- It's been on market 123 days. Have you received any prior offers? Is the seller open to a 12% concession, seller financing, or rate buy-down credit?
- Built in 1926 — when were the roof, HVAC, electrical panel, plumbing, and water heater last replaced?
- Why hasn't it sold? Are there any deal-killer items the seller is aware of (foundation, flood, title, zoning, code violations)?
- Is there a deadline driving the sale (1031 exchange, divorce, estate, relocation)? That informs how much negotiation room exists.
- Schools are F-rated, which usually means shorter tenancies and higher turnover. Who's the typical renter profile here, and what's been the actual vacancy rate?
- What's the average days-on-market for RENTAL listings here right now (not sales)? A rising rental-DOM trend means longer vacancies and softer asking-rent achievability than the comps imply.
- What's the recent tenant-quality profile in this submarket — average credit score on applications, eviction rate, late-payment / NSF rate, and stable-employment percentage? A property-management company in the area should have these aggregated.
- How much new for-sale + rental construction is in the pipeline within 1–3 miles? Heavy new supply typically softens prices + rents 12–24 months out; constrained supply supports both.
Investment metrics
- 1% rule
- 3.08% ✓
- Cap rate
- 27.58%
- Cash-on-cash
- 76.02%
- DSCR
- 4.38
- GRM
- 2.7
CMA / ARV
- ARV (on-the-fly)
- $108,504
- Comps found
- 12
Show comp detail 12 sales within ~0.75 mi
| Address | Dist | Beds/Ba | Sqft | Sold | Price | $/sf | Match |
|---|---|---|---|---|---|---|---|
| 522 Frances St | 0.13mi | 2/1.0 | 840 (+6%) | 13mo | $115,000 | $137 | 73 |
| 15360 9th Ave | 0.43mi | 2/1.0 | 787 (-1%) | 18mo | $89,000 | $113 | 63 |
| 296 E 149th St | 0.56mi | 3/1.0 (+1) | 772 (-2%) | 4mo | $93,000 | $120 | 61 |
| 14726 Madison Ave | 0.73mi | 2/1.0 | 760 (-4%) | 1mo | $35,000 | $46 | 58 |
| 14921 Oakdale Ave | 0.66mi | 2/2.0 | 768 (-3%) | 3mo | $55,000 | $72 | 58 |
| 805 E 153 St | 0.24mi | 3/2.0 (+1) | 823 (+4%) | 20mo | $229,900 | $279 | 57 |
| 282 E 149th St | 0.59mi | 3/1.0 (+1) | 813 (+3%) | 13mo | $100,000 | $123 | 52 |
| 14717 E Riverside Dr | 0.75mi | 2/1.0 | 728 (-8%) | 3mo | $35,000 | $48 | 49 |
| 14924 Oakdale Ave | 0.64mi | 3/1.0 (+1) | 768 (-3%) | 17mo | $143,000 | $186 | 46 |
| 15036 Perry Ave | 0.32mi | 3/1.0 (+1) | 900 (+14%) | 15mo | $145,000 | $161 | 45 |
| 319 E 148th St | 0.68mi | 2/1.0 | 724 (-9%) | 15mo | $115,000 | $159 | 42 |
| 14812 Perry Ave | 0.61mi | 3/1.0 (+1) | 900 (+14%) | 20mo | $164,900 | $183 | 28 |
Match score weights: distance 35% · size 25% · config 20% · recency 20%. Top-matched comps best support the ARV.
Projected returns pro-forma
10.0% appreciation · 3.0% rent growth · sell at horizon
- IRR
- 86.4%
- Equity multiple
- 6.98×
- Total profit
- $75,356
- Equity at exit
- $40,540
- IRR
- 80.9%
- Equity multiple
- 15.44×
- Total profit
- $181,956
- Equity at exit
- $87,425
Cash invested: $12,600 (down + closing). Projections, not guarantees.
Landlord ↔ Tenant lean methodology
- Overall (STATE)
- 43 Moderately Tenant-Leaning
- State Illinois
- 43 Moderately Tenant-Leaning · D+7
- County
- — inherits STATE
- City
- — inherits STATE
ZIP-level market 60426
- Home prices YoY
- 6.9%
- Active inventory
- 134
- Price-to-rent
- 2.7×
Monthly cashflow live
- Estimated rent
- $1,384 medium interval (Pro) →
- Mortgage (P&I)
- −$236
- Tax from tax record
- −$40 /mo · $484/yr
- Insurance
- −$19
- HOA
- −$0
- Vacancy / Maint / Mgmt
- −$291
- Net cashflow
- $798
Break-even live
UW: 25.0% down · 7.5% · 30yr · 1.5% tax · 5.0% vac · 8.0% maint · 8.0% mgmt
Financing live
Cash to close
- Down payment
- $11,250
- Closing costs
- $1,350
- Reserves months
- —
- Total cash needed
- —
Loan-product check · same deal, 3 products live
Conventional
25% down · 7.5% · 30yr
- Down + closing
- —
- Monthly P&I
- —
- Monthly cashflow
- —
- DSCR
- —
- Eligible?
- —
Personal DTI + credit; lowest rate.
DSCR
20% down · 8.5% · 30yr
- Down + closing
- —
- Monthly P&I
- —
- Monthly cashflow
- —
- DSCR
- —
- Eligible?
- —
No personal income docs; deal must DSCR.
Hard money
10% down · 12.0% · 12mo
- Down + closing
- —
- Monthly P&I
- —
- Monthly cashflow
- —
- DSCR
- —
- Eligible?
- —
Short-term bridge; refi at stabilization.
Rent comps 3 comps
| Address | Beds | Baths | Sqft | Rent | $/sqft | DOM | Units | Dist |
|---|---|---|---|---|---|---|---|---|
| 16048 Halsted St Unit 2 Harvey, IL | 3.0 | 1.0 | 1091 | $1,650 | $1.51 | 24d | 1 | 1.02mi |
| 15324 Doctor Martin Luther King Junior Dr Unit 1B Dolton, IL | 1.0 | 1.0 | 725 | $985 | $1.36 | 18d | 1 | 1.34mi |
| 15238 Doctor Martin Luther King Junior Dr Unit 2W Dolton, IL | 2.0 | 1.0 | 800 | $1,500 | $1.88 | 10d | 1 | 1.36mi |
Listing history 6 events
-
2026-06-03days on market $45,000 Active 123 DOM
-
2026-06-02days on market $45,000 Active 122 DOM
-
2026-06-01days on market $45,000 Active 121 DOM
-
2026-05-31days on market $45,000 Active 120 DOM
-
2026-03-17soldstatus $27,500
-
2026-01-31$45,000 Active
ⓘ Source: listings_history table (triggers on properties + properties_extension) + one-shot
backfill from property_details.listing_events for pre-trigger history.
Tax reassessment forecast IL · Partial reset (capped growth)
- Current annual tax
- $484 · $40/mo
- Projected year-2 tax
- $753 · $63/mo
- Expected delta
- +$269/yr (+$22/mo · 55.5%)
ⓘ Screening estimate from a state-policy table — verify with the county assessor before closing.
Climate risk First Street
- Flood 1/10 Low FEMA zone X (unshaded) · 0% chance over 30 yrs
- Wildfire 1/10 Low
- Heat 3/10 Moderate 7 d/yr ≥101°F today · 15 d/yr by 30 yrs out
- Wind 2/10 Low
- Air quality 4/10 Moderate 4 unhealthy d/yr today · 5 by 30 yrs out
Nearby sold comps map
Loading sold comps map…
Walkable amenities ~0.75 mi
Loading nearby amenities…
Taxation est. · year 1
- Rental income
- $16,606
- − Mortgage interest
- −$2,521
- − Property taxes
- −$484
- − Insurance
- −$225
- − Repairs & maintenance
- −$1,329
- − Management
- −$1,329
- − Depreciation
- −$1,309
- Taxable income
- $9,411
- Est. tax owed @ 24.0%
- −$2,259
- After-tax cash flow
- $7,320/yr
For passive investors: Depreciation is non-cash, so a rental often shows a tax loss while cash-flowing — sheltering income. Rental losses are passive: they offset passive income freely, and up to $25,000/yr can offset ordinary (W-2) income if you actively participate and your MAGI is under $100k (phasing out to $0 by $150k); unused losses carry forward. On sale, claimed depreciation is recaptured at up to 25%, and gains may owe capital-gains tax (a 1031 exchange can defer both). Figures are a year-1 estimate at your 24.0% rate — not tax advice; consult a CPA.
Schools (NCES district)
- District
- Thornton Twp Hsd 205
- NCES district ID
- 1738970
- Math proficiency
- 7% ▬ 0.00%
- Reading proficiency
- 8% ▼ -2.00%
- Median HH income
- $43,392
- Composite
- 6.92/100
- National rank
- #9976
- State rank
- #594 of 620 in IL
Livability — Phoenix
- Score
- 75/100
- State rank
- #230
- US rank
- #4248
Category grades
Schools grade is shown separately in the Schools card above.
Census & demographics
- Census place
- Phoenix, IL
- Population (ZIP)
- 23,066
Population outlook (Cook County) Hauer SSP2
- Today (2025)
- 5,347,519 people
- By 2030
- 5,357,703 · +0.2%
- By 2040
- 5,324,924 · -0.4%
- By 2050
- 5,230,762 · -2.2%
- By 2075
- 4,785,735 · -10.5%
- By 2100
- 4,188,836 · -21.7%
Race, ethnicity, and origin ACS 2023
- Neighborhood character
- Majority Black (59%)
- Race & ethnicity
- Black 59% Hispanic / Latino 33% Two or more races 12% White 3% Asian 2%
- Hispanic origin (detail)
- Mexican 31%
- Foreign-born
- 17% · Canada
- Languages at home
- 67% English-only · Spanish 30% Other Indo-European 2% French/Haitian/Cajun 1%
Political lean MEDSL · Cook
- 2024 margin
- Solid D (+42.0) · D 70.4% · R 28.4% · Other 1.2%
- 2008→2024 swing
- -11.4pp toward R · 2008: 53.4pp · 2024: 42.0pp
- All cycles
- 2024: D+42.0 2020: D+50.3 2016: D+53.0 2012: D+49.4 2008: D+53.4
Not yet ingested
- Civics
- —
Market trends
- HPI YoY
- ▲ 20.36%
- Current HPI
- 313.7895
- Rent YoY
- —
- Metro
- —
- State GDP YoY
- ▲ 1.59%
- F500 in state
- 60
Industry mix (Fortune 500 HQ in IL)
| Industry | F500 HQs | Revenue |
|---|---|---|
| Insurance | 4 | $201B |
|
||
| Consumer Goods | 4 | $87B |
|
||
| Industrial Machinery | 3 | $64B |
|
||
| Healthcare | 2 | $55B |
|
||
| Retail / Pharmacy | 1 | $148B |
|
||
| Agriculture / Food | 1 | $86B |
|
||
Price history
-38.9% since first listed2 events — show timeline
- 2026-03-17 Sold (Public Records) $27,500 Public Records
- 2026-01-31 Listed $45,000 ForSaleByOwner.com
Property tax history
+0.2%/yrLatest (2023): $484 · +54.2% YoY. Source: county tax records.
Cash-flow waterfall
monthlySold comps — $/sqft
last 12 mo · ≤1 miLoading sold comps…