 Duplex
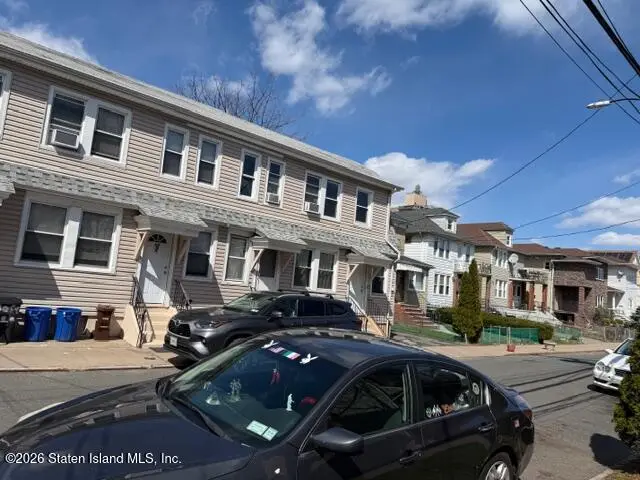
97 & 99 Maryland Ave · New York, NY
Flood risk 1/10 · Minimal
- FEMA flood zone
- X (unshaded)
- Chance of flooding over 30 yrs
- 0.0%
- Est. flood insurance / yr
- $507 – $1,088
Fire risk 1/10 · Minimal
- Est. fire insurance / yr
- $691 – $1,283
Heat risk 7/10 · Major
- Hot days now (above 98°F)
- 7 days/yr
- Hot days in 30 yrs
- 16 days/yr
Wind risk 6/10 · Moderate
- Chance of severe wind over 30 yrs
- 65.0%
Air-quality risk 4/10 · Minor
- Unhealthy air days now
- 5 days/yr
- Unhealthy air days in 30 yrs
- 7 days/yr
Risk factors via First Street. Map © Google.
Why this score? — see what drove the F grade
The composite is a weighted blend of 9 inputs, each scored 0–100. Each bar is that input's sub-score; the figure is the points it added to the 100-point composite (weight × sub-score).
- Cash flow +12.4/30.0
- Schools +5.0/10.0
- Rent growth +4.4/5.0
- Livability +3.8/5.0
- DSCR +3.7/10.0
- 1% rule +2.6/10.0
- Condition / age +2.5/5.0
- ARV discount +0.0/15.0
- Appreciation +0.0/10.0
$849,999
🖨 Deal sheet 📄 Offer letter ✓ Due diligence
Multi-family units
County records classify this as Multi-Family (2-4 Unit). Listing-text estimate: 2 units. confirmed
Listing remarks
ATTENTION: ATTENTION: ATTENTION Our seller wants to sell this Great 2 Family, fully renovated house. 2-3 Bedroom identical duplexes, with separate entrances & utilities for each unit. Wood floors, closest, large living room, separate dining room and partial basements, 2 floor features Master bedroom, bedroom, bedroom, Attic, Basement-Unfinished Close to all. Block away from Bay Street, Shopping and Easy Access to Staten Island Ferry Tenant Occupied
Key facts
- 1,235 sq ft lot
- Built 1901
- Listed 57 days
Property features AI
Finance
- Other: Building area listed at 1,536 (unit unspecified)
- Financial info: 3 total units; Unit 1 current rent: $3,454/month
Exterior
- Parking: Off-street parking (no attached garage)
- Utilities: 220-volt electric service
- Home design: 2-story multi-family building; Approximate year built
- Construction: Vinyl siding; Building in excellent condition
- Exterior features: Small lot (approx. 65 x 19); Zoned R4A
Interior
- Bedrooms: Unit 1: 3 bedrooms (level 1); Unit 2: 3 bedrooms (level 1)
- Bathrooms: 2 full bathrooms total; Unit 1: 1 bathroom
- Heating & cooling: Natural gas heating with forced air; Window unit air conditioners
- Interior features: Window air conditioning units; Partially finished basement; Cable available; Intercom
Neighborhood map
What this means for you Summary
Snapshot
- This is a 2 × 3-bed/1.0-bath units multifamily listed at $850k.
Deal economics
- At list price, monthly cash flow is $-133 ($-2k/yr) — negative. Per door: $-67/mo.
- To cash-flow at today's rent, offer at most $826k (2.8% below list).
- To meet the 1% rule (rent ≥ 1% of price), the offer needs to be $648k (23.8% below list).
- Recommended offer: $648k (23.8% below list) — sets the bar for 1% rule.
- Cap rate 6.1% vs local median 2.6% in New York — top-decile yield for the area; either an underpriced asset or a hidden risk that comps aren't pricing in. Stress-test before assuming the spread holds.
Location & tenants
- Location reads 75/100 on livability (#268 in NY, #4,188 nationally) — a middle-class / working-renter tenant base. Strengths: amenities A+, commute A+, health & safety A; Watch: crime F, cost of living F.
- Market conditions: Rents rising fast (+7.5%/yr); 254 active listings in the ZIP; solid renter incomes; 480 units permitted in Richmond County in 2024 (22 in 5+ unit buildings).
- At $6,479/mo this rent would consume 93% of the median local household income ($83k/yr) (locally 1647% of renters already pay >50% of income on rent) — very limited rent-growth headroom before tenants either downsize or default.
Forward outlook
- Local home prices are declining (-3.0%/yr); year-one equity from $6k of loan paydown is wiped out by about $26k of value loss. Plan a longer hold.
- Richmond County population projected to shrink 5% by 2050 — rents likely to lag national; underwrite the cash flow, not the appreciation.
Negotiation context
- It's been on market 58 days — a 3% lower offer ($824k) is reasonable based on typical stale-listing flexibility.
- Current owner paid $310k; list at $850k implies a 174% gain — meaningful room to come down on a strong offer.
Risks & watch-outs
- Watch-outs: built in 1901 — expect roof / HVAC / electrical / plumbing capex.
- Climate carrying-cost: major wind risk, 65% chance of damaging wind over 30y; extreme-heat days projected 7→16/yr by 2055 (HVAC capex compounding) — expect insurance premiums to compound above CPI over the hold.
Questions for the listing agent
- What do current leases actually rent for vs. the listed asking? Can we see a recent rent roll and the last 12 months of T-12 income?
- It's been on market 58 days. Have you received any prior offers? Is the seller open to a 24% concession, seller financing, or rate buy-down credit?
- Can we see the unit-by-unit rent roll, current vacancy, and any below-market leases? What's the average tenancy length?
- What capital expenditures (roof, boiler, parking lot, exteriors) have been made in the last 5 years, and what's planned in the next 2?
- Built in 1901 — when were the roof, HVAC, electrical panel, plumbing, and water heater last replaced?
- Is there a deadline driving the sale (1031 exchange, divorce, estate, relocation)? That informs how much negotiation room exists.
- Schools are B-rated — typically a magnet for longer-tenancy family renters. What's the average tenant stay here, and is there a school-zone premium baked into asking?
- Crime grade is F in this area — have there been break-ins, vandalism, or insurance claims at this property in the last 3 years? What carrier currently insures it and at what premium?
- The area grade is low — what's the realistic commute time and amenity access for the typical tenant pool here? Any planned neighborhood developments (good or bad) we should know about?
- What's the average days-on-market for RENTAL listings here right now (not sales)? A rising rental-DOM trend means longer vacancies and softer asking-rent achievability than the comps imply.
- What's the recent tenant-quality profile in this submarket — average credit score on applications, eviction rate, late-payment / NSF rate, and stable-employment percentage? A property-management company in the area should have these aggregated.
- How much new apartment / multifamily construction is in the pipeline within 1–3 miles? Heavy new supply (>2% of stock underway) typically softens rents 12–24 months out; light construction supports rent growth.
Investment metrics
- 1% rule
- 0.76% ✗
- Cap rate
- 6.10%
- Cash-on-cash
- -0.67%
- DSCR
- 0.97
- GRM
- 10.9
CMA / ARV
- ARV (on-the-fly)
- $694,272
- Comps found
- 1
Show comp detail 1 sale within ~0.75 mi
| Address | Dist | Beds/Ba | Sqft | Sold | Price | $/sf | Match |
|---|---|---|---|---|---|---|---|
| 65 Anderson St | 0.27mi | 6/3.0 | 1,592 (+4%) | 12mo | $720,000 | $452 | 68 |
Match score weights: distance 35% · size 25% · config 20% · recency 20%. Top-matched comps best support the ARV.
Projected returns pro-forma
-3.0% appreciation · 7.5% rent growth · sell at horizon
- IRR
- -13.0%
- Equity multiple
- 0.51×
- Total profit
- $-115,839
- Equity at exit
- $126,738
- IRR
- 1.3%
- Equity multiple
- 1.11×
- Total profit
- $25,152
- Equity at exit
- $73,492
Cash invested: $238,000 (down + closing). Projections, not guarantees.
Landlord ↔ Tenant lean methodology
- Overall (CITY)
- 0 Strongly Tenant-Friendly
- State New York
- 15 Strongly Tenant-Friendly · D+10
- County
- — inherits STATE
- City New York
- 0 Strongly Tenant-Friendly · D+34
ZIP-level market 10305
- Rents YoY
- 7.5%
- Active inventory
- 254
- Price-to-rent
- 21.9×
Monthly cashflow live
- Estimated rent
- $6,479 medium interval (Pro) →
- Mortgage (P&I)
- −$4,457
- Tax from tax record
- −$440 /mo · $5,279/yr
- Insurance
- −$354
- HOA
- −$0
- Vacancy / Maint / Mgmt
- −$1,361
- Net cashflow
- $-133
Break-even live
2-unit breakdown (identical units grouped — click to expand)
| Units | Beds | Baths | Est. rent |
|---|---|---|---|
| 2× units | 3 | 1 | $6,478 |
| #1 | 3 | 1 | $3,239 |
| #2 | 3 | 1 | $3,239 |
| Total (2 units) | $6,479 | ||
UW: 25.0% down · 7.5% · 30yr · 1.5% tax · 5.0% vac · 8.0% maint · 8.0% mgmt
Financing live
Cash to close
- Down payment
- $212,500
- Closing costs
- $25,500
- Reserves months
- —
- Total cash needed
- —
Loan-product check · same deal, 3 products live
Conventional
25% down · 7.5% · 30yr
- Down + closing
- —
- Monthly P&I
- —
- Monthly cashflow
- —
- DSCR
- —
- Eligible?
- —
Personal DTI + credit; lowest rate.
DSCR
20% down · 8.5% · 30yr
- Down + closing
- —
- Monthly P&I
- —
- Monthly cashflow
- —
- DSCR
- —
- Eligible?
- —
No personal income docs; deal must DSCR.
Hard money
10% down · 12.0% · 12mo
- Down + closing
- —
- Monthly P&I
- —
- Monthly cashflow
- —
- DSCR
- —
- Eligible?
- —
Short-term bridge; refi at stabilization.
Listing history 15 events
-
2026-06-18days on market $849,999 Active 58 DOM
-
2026-06-17days on market $849,999 Active 57 DOM
-
2026-06-16days on market $849,999 Active 56 DOM
-
2026-06-15days on market $849,999 Active 55 DOM
-
2026-06-13days on market $849,999 Active 53 DOM
-
2026-06-10days on market $849,999 Active 49 DOM
-
2026-06-08days on market $849,999 Active 48 DOM
-
2026-06-08days on market $849,999 Active 47 DOM
-
2026-06-04days on market $849,999 Active 44 DOM
-
2026-06-03days on market $849,999 Active 43 DOM
-
2026-06-01days on market $849,999 Active 41 DOM
-
2026-05-31days on market $849,999 Active 40 DOM
-
2026-04-21$849,999 Active
-
2013-02-13soldstatus $310,000
-
1995-02-10soldstatus $83,000
ⓘ Source: listings_history table (triggers on properties + properties_extension) + one-shot
backfill from property_details.listing_events for pre-trigger history.
Tax reassessment forecast NY · Partial reset (capped growth)
- Current annual tax
- $5,279 · $440/mo
- Projected year-2 tax
- $9,822 · $819/mo
- Expected delta
- +$4,543/yr (+$379/mo · 86.0%)
ⓘ Screening estimate from a state-policy table — verify with the county assessor before closing.
Climate risk First Street
- Flood 1/10 Low FEMA zone X (unshaded) · 0% chance over 30 yrs
- Wildfire 1/10 Low
- Heat 7/10 Severe 7 d/yr ≥98°F today · 16 d/yr by 30 yrs out
- Wind 6/10 Major 65% chance of damaging wind over 30 yrs
- Air quality 4/10 Moderate 5 unhealthy d/yr today · 7 by 30 yrs out
Nearby sold comps map
Loading sold comps map…
Walkable amenities ~0.75 mi
Loading nearby amenities…
Taxation est. · year 1
- Rental income
- $77,748
- − Mortgage interest
- −$47,613
- − Property taxes
- −$5,279
- − Insurance
- −$4,250
- − Repairs & maintenance
- −$6,220
- − Management
- −$6,220
- − Depreciation
- −$24,727
- Taxable loss
- −$16,561
- Est. tax savings @ 24.0%
- +$3,975
- After-tax cash flow
- $2,376/yr
For passive investors: Depreciation is non-cash, so a rental often shows a tax loss while cash-flowing — sheltering income. Rental losses are passive: they offset passive income freely, and up to $25,000/yr can offset ordinary (W-2) income if you actively participate and your MAGI is under $100k (phasing out to $0 by $150k); unused losses carry forward. On sale, claimed depreciation is recaptured at up to 25%, and gains may owe capital-gains tax (a 1031 exchange can defer both). Figures are a year-1 estimate at your 24.0% rate — not tax advice; consult a CPA.
Schools (NCES district)
No district data.
Livability — New York
- Score
- 75/100
- State rank
- #268
- US rank
- #4188
Category grades
Schools grade is shown separately in the Schools card above.
Census & demographics
- Census place
- New York, NY
- County
- Richmond County · 404,174 people
- City population
- 7,731,280
- Metro
- New York-Newark-Jersey City, NY-NJ-PA
- Population (ZIP)
- 41,270
- Household income
- $83,413
- Rent vs Own
- Severe rent burden
- 1647.0
Population outlook (Richmond County) Hauer SSP2
- Today (2025)
- 482,784 people
- By 2030
- 481,831 · -0.2%
- By 2040
- 473,159 · -2.0%
- By 2050
- 457,242 · -5.3%
- By 2075
- 408,029 · -15.5%
- By 2100
- 341,459 · -29.3%
Race, ethnicity, and origin ACS 2023
- Neighborhood character
- Diverse neighborhood (Simpson 0.60)
- Race & ethnicity
- White 58% Asian 21% Hispanic / Latino 15% Two or more races 7% Black 3%
- Hispanic origin (detail)
- Mexican 4% Puerto Rican 8%
- Common ancestry
- Scotch-Irish 5% Romanian 4% Subsaharan African 2%
- Foreign-born
- 36% · China, Canada, Jamaica
- Languages at home
- 52% English-only · Chinese 13% Russian/Polish/Slavic 12% Other Indo-European 8%
Political lean MEDSL · Richmond
- 2024 margin
- Strong R (+29.8) · D 35.1% · R 64.9%
- 2008→2024 swing
- -25.7pp toward R · 2008: -4.0pp · 2024: -29.8pp
- All cycles
- 2024: R+29.8 2020: R+14.9 2016: R+16.8 2012: D+0.8 2008: R+4.0
Not yet ingested
- Civics
- —
Market trends
- HPI YoY
- ▼ -487.06%
- Current HPI
- 342.7938
- Rent YoY
- ▲ 7.50%
- Metro
- New York-Newark-Jersey City, NY-NJ-PA
- State GDP YoY
- ▲ 2.60%
- F500 in state
- 92
Industry mix (Fortune 500 HQ in NY)
| Industry | F500 HQs | Revenue |
|---|---|---|
| Financial Services | 10 | $950B |
|
||
| Consumer Goods | 9 | $162B |
|
||
| Insurance | 4 | $225B |
|
||
| Telecommunications | 2 | $144B |
|
||
| Pharmaceuticals | 2 | $112B |
|
||
| Media / Entertainment | 2 | $69B |
|
||
Price history
+924.1% since first listed3 events — show timeline
- 2026-04-21 Listed $849,999 SIBORMLS
- 2013-02-13 Sold (Public Records) $310,000 Public Records
- 1995-02-10 Sold (Public Records) $83,000 Public Records
Property tax history
+5.0%/yrLatest (2025): $5,279 · +6.0% YoY. Source: county tax records.
Cash-flow waterfall
monthlySold comps — $/sqft
last 12 mo · ≤1 miLoading sold comps…