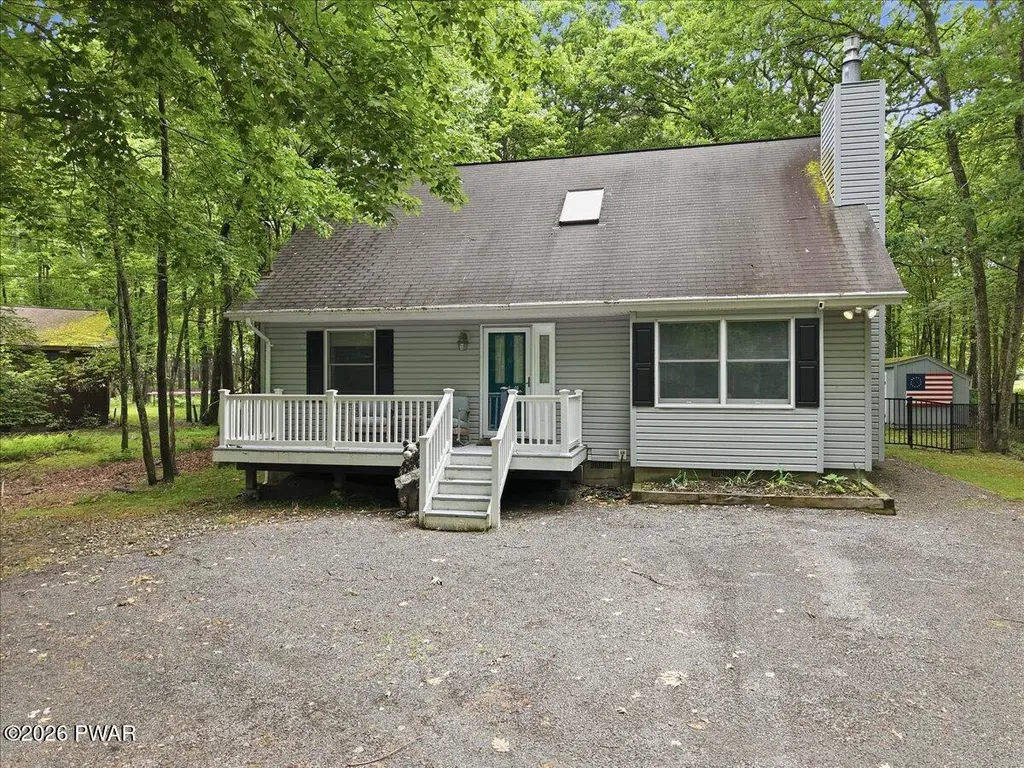
117 Franklin Dr · Hemlock Farms, PA
Flood risk 1/10 · Minimal
- FEMA flood zone
- X (unshaded)
- Chance of flooding over 30 yrs
- 0.0%
- Est. flood insurance / yr
- $473 – $860
Fire risk 4/10 · Minor
- Est. fire insurance / yr
- $511 – $949
Heat risk 2/10 · Minimal
- Hot days now (above 91°F)
- 7 days/yr
- Hot days in 30 yrs
- 15 days/yr
Wind risk 3/10 · Minor
- Chance of severe wind over 30 yrs
- 5.0%
Air-quality risk 2/10 · Minimal
- Unhealthy air days now
- 1 days/yr
- Unhealthy air days in 30 yrs
- 2 days/yr
Risk factors via First Street. Map © Google.
Why this score? — see what drove the C grade
The composite is a weighted blend of 9 inputs, each scored 0–100. Each bar is that input's sub-score; the figure is the points it added to the 100-point composite (weight × sub-score).
- Cash flow +22.7/30.0
- Appreciation +10.0/10.0
- DSCR +7.3/10.0
- 1% rule +6.9/10.0
- Livability +3.4/5.0
- Schools +3.0/10.0
- Rent growth +2.5/5.0
- Condition / age +2.5/5.0
- ARV discount +0.0/15.0
$337,500
🖨 Deal sheet 📄 Offer letter ✓ Due diligence
Listing remarks MLS
Enjoy Life with alot of Upgrades throughout house, quality, well kept home offers granite counters in kitchen and stone fireplace, large open deck and flat lot with yard. Relax and enjoy the good life!, Beds Description: 2+BED 2nd, Beds Description: 1Bed1st, Baths: 1 Bath Level 1, Baths: 1 Bath Level 2, Eating Area: Dining Area
Key facts
- Gated community
- Access to lakes
- Access to pools
Tags
Property features AI
Finance
- Other: Annual tax amount listed
- HOA & community: Homeowners association with annual fee of $2,980 (about $248.33/month); Association amenities include: basketball court, tennis courts, sport court, trails, spa/hot tub, shuffleboard court, recreation facilities and room, pool (indoor and outdoor), seasonal and year-round ponds, picnic area, park, meeting room, golf course access, gated community, game room, clubhouse, beach access, and security; Association fee includes security
Exterior
- Home design: Single-family residence; Residential property
- Construction: Above-grade finished area reported; Below-grade finished area reported
- Exterior features: Half-acre lot; Subdivision: Hemlock Farms; Directions: From 402, right onto Brewster Road, right onto Washington Dr, left onto Franklin Drive
Interior
- Kitchen: Cooktop, Oven, Microwave; Dishwasher; Refrigerator
- Bedrooms: Total of 5 rooms (bedroom count not specified)
- Bathrooms: 2 full bathrooms
- Interior features: Cooktop, Oven, Microwave; Dishwasher; Refrigerator; Washer and Dryer
- Laundry & utility: Washer and Dryer
Neighborhood map
What this means for you Summary
Snapshot
- This is a 3-bed/2.0-bath single-family listed at $338k.
Deal economics
- At list price, monthly cash flow is $580 ($7k/yr) — positive.
- The deal already cash-flows at list — no discount required.
- Meets the 1% rule at list price ($4k rent vs $338k).
Location & tenants
- Location reads 68/100 on livability (#884 in PA) — a middle-class / working-renter tenant base. Strengths: crime A+, housing A+, health & safety A+; Watch: schools C-, amenities F, commute F.
- East Stroudsburg Area SD (rural): math 25% / reading 43% proficiency, ranked #413 of 539 in PA (top 77%) — families likely to look elsewhere, expect single-tenant / working-renter base with shorter leases.
- Market conditions: 371 active listings in the ZIP; 1 comparable units currently listed for rent nearby; 213 units permitted in Pike County in 2024 (0 in 5+ unit buildings).
Forward outlook
- In year one you build about $36k of equity ($2k loan paydown + $34k appreciation (10.0% local appreciation)).
- Pike County population projected at -25% by 2050 — secular population decline; favor cash flow + early exit over multi-decade hold.
- At projected returns (10.0% appreciation + 3.0% rent growth), your $94k cash investment doubles in ~3 years — after that, you're playing with house money.
- By year 2, paydown + projected appreciation supports a ~$58k cash-out refi (75% LTV) — recoverable capital for the next deal without selling this one.
Negotiation context
- Only 6 days on market — expect competitive offers; lowballing is unlikely to land.
- 4 sale attempts since 11y ago with the ask held roughly flat each time — persistent listings suggest the price (not the market) is what's stuck; bring a comps-based counter.
- Current owner paid $125k; list at $338k implies a 170% gain — meaningful room to come down on a strong offer.
Questions for the listing agent
- What does the HOA fee cover, when was the last increase, and are there any pending special assessments or reserve-fund shortfalls?
- Is there a deadline driving the sale (1031 exchange, divorce, estate, relocation)? That informs how much negotiation room exists.
- What's the average days-on-market for RENTAL listings here right now (not sales)? A rising rental-DOM trend means longer vacancies and softer asking-rent achievability than the comps imply.
- What's the recent tenant-quality profile in this submarket — average credit score on applications, eviction rate, late-payment / NSF rate, and stable-employment percentage? A property-management company in the area should have these aggregated.
- How much new for-sale + rental construction is in the pipeline within 1–3 miles? Heavy new supply typically softens prices + rents 12–24 months out; constrained supply supports both.
Investment metrics
- 1% rule
- 1.19% ✓
- Cap rate
- 8.35%
- Cash-on-cash
- 7.36%
- DSCR
- 1.33
- GRM
- 7.0
CMA / ARV
- ARV (on-the-fly)
- $252,048
- Comps found
- 12
Show comp detail 12 sales within ~0.75 mi
| Address | Dist | Beds/Ba | Sqft | Sold | Price | $/sf | Match |
|---|---|---|---|---|---|---|---|
| 115 Jackson Dr | 0.19mi | 4/2.0 (+1) | 1,496 (+5%) | 6mo | $355,000 | $237 | 72 |
| 128 Horseshoe Ln | 0.55mi | 3/2.0 | 1,485 (+4%) | 1mo | $190,000 | $128 | 67 |
| 805 Jefferson Ct | 0.20mi | 4/2.0 (+1) | 1,540 (+8%) | 12mo | $295,000 | $192 | 62 |
| 120 Burning Tree Dr | 0.50mi | 3/2.0 | 1,360 (-4%) | 10mo | $250,000 | $184 | 60 |
| 111 Horseshoe Ln | 0.64mi | 2/2.0 (-1) | 1,500 (+5%) | 1mo | $178,500 | $119 | 56 |
| 122 Horseshoe Ln | 0.58mi | 3/2.0 | 1,315 (-8%) | 7mo | $269,000 | $205 | 54 |
| 130 Canterbrook Dr #130 | 0.68mi | 3/2.5 | 1,550 (+9%) | 1mo | $260,000 | $168 | 51 |
| 130 Canterbrook Dr | 0.68mi | 3/2.5 | 1,550 (+9%) | 1mo | $260,000 | $168 | 51 |
| 102 Roosevelt Dr | 0.34mi | 3/2.0 | 1,576 (+11%) | 19mo | $270,000 | $171 | 50 |
| 132 Washington Dr | 0.33mi | 3/1.0 | 1,224 (-14%) | 13mo | $268,000 | $219 | 46 |
| 102 Portage Ln | 0.75mi | 3/2.0 | 1,296 (-9%) | 14mo | $230,000 | $177 | 38 |
| 103 Fairway Ln | 0.70mi | 4/2.0 (+1) | 1,548 (+9%) | 14mo | $249,000 | $161 | 36 |
Match score weights: distance 35% · size 25% · config 20% · recency 20%. Top-matched comps best support the ARV.
Projected returns pro-forma
10.0% appreciation · 3.0% rent growth · sell at horizon
- IRR
- 29.7%
- Equity multiple
- 3.34×
- Total profit
- $220,940
- Equity at exit
- $304,047
- IRR
- 25.7%
- Equity multiple
- 7.58×
- Total profit
- $622,025
- Equity at exit
- $655,688
Cash invested: $94,500 (down + closing). Projections, not guarantees.
Landlord ↔ Tenant lean methodology
- Overall (STATE)
- 62 Landlord-Friendly
- State Pennsylvania
- 62 Landlord-Friendly · EVEN
- County
- — inherits STATE
- City
- — inherits STATE
ZIP-level market 18428
- Home prices YoY
- 9.2%
- Active inventory
- 371
- Price-to-rent
- 7.0×
Monthly cashflow live
- Estimated rent
- $4,000 medium interval (Pro) →
- Mortgage (P&I)
- −$1,770
- Tax est. 1.5%
- −$422 /mo · $5,062/yr
- Insurance
- −$141
- HOA
- −$248
- Vacancy / Maint / Mgmt
- −$840
- Net cashflow
- $580
Break-even live
UW: 25.0% down · 7.5% · 30yr · 1.5% tax · 5.0% vac · 8.0% maint · 8.0% mgmt
Financing live
Cash to close
- Down payment
- $84,375
- Closing costs
- $10,125
- Reserves months
- —
- Total cash needed
- —
Loan-product check · same deal, 3 products live
Conventional
25% down · 7.5% · 30yr
- Down + closing
- —
- Monthly P&I
- —
- Monthly cashflow
- —
- DSCR
- —
- Eligible?
- —
Personal DTI + credit; lowest rate.
DSCR
20% down · 8.5% · 30yr
- Down + closing
- —
- Monthly P&I
- —
- Monthly cashflow
- —
- DSCR
- —
- Eligible?
- —
No personal income docs; deal must DSCR.
Hard money
10% down · 12.0% · 12mo
- Down + closing
- —
- Monthly P&I
- —
- Monthly cashflow
- —
- DSCR
- —
- Eligible?
- —
Short-term bridge; refi at stabilization.
Rent comps 1 comps
| Address | Beds | Baths | Sqft | Rent | $/sqft | DOM | Units | Dist |
|---|---|---|---|---|---|---|---|---|
| 113 Portage Ln Milford, PA | 3.0 | 2.0 | 1400 | $4,000 | $2.86 | 1d | 1 | 0.76mi |
HOA detail
- Monthly dues
- $248 · $2,976/yr
Listing history 7 events
-
2026-06-19days on market $337,500 Active 6 DOM
-
2026-06-18days on market $337,500 Active 5 DOM
-
2026-06-17days on market $337,500 Active 4 DOM
-
2026-06-16days on market $337,500 Active 3 DOM
-
2026-06-15days on market $337,500 Active 2 DOM
-
2026-06-14remarks 420-char remark
-
2026-06-14$337,500 Active 1 DOM
ⓘ Source: listings_history table (triggers on properties + properties_extension) + one-shot
backfill from property_details.listing_events for pre-trigger history.
Climate risk First Street
- Flood 1/10 Low FEMA zone X (unshaded) · 0% chance over 30 yrs
- Wildfire 4/10 Moderate
- Heat 2/10 Low 7 d/yr ≥91°F today · 15 d/yr by 30 yrs out
- Wind 3/10 Moderate 5% chance of damaging wind over 30 yrs
- Air quality 2/10 Low 1 unhealthy d/yr today · 2 by 30 yrs out
Nearby sold comps map
Loading sold comps map…
Walkable amenities ~0.75 mi
Loading nearby amenities…
Taxation est. · year 1
- Rental income
- $48,000
- − Mortgage interest
- −$18,905
- − Property taxes
- −$5,062
- − Insurance
- −$1,688
- − Repairs & maintenance
- −$3,840
- − Management
- −$3,840
- − HOA
- −$2,976
- − Depreciation
- −$9,818
- Taxable income
- $1,871
- Est. tax owed @ 24.0%
- −$449
- After-tax cash flow
- $6,506/yr
For passive investors: Depreciation is non-cash, so a rental often shows a tax loss while cash-flowing — sheltering income. Rental losses are passive: they offset passive income freely, and up to $25,000/yr can offset ordinary (W-2) income if you actively participate and your MAGI is under $100k (phasing out to $0 by $150k); unused losses carry forward. On sale, claimed depreciation is recaptured at up to 25%, and gains may owe capital-gains tax (a 1031 exchange can defer both). Figures are a year-1 estimate at your 24.0% rate — not tax advice; consult a CPA.
Schools (NCES district)
- District
- East Stroudsburg Area SD
- NCES district ID
- 4208670
- Math proficiency
- 25% ▼ -11.00%
- Reading proficiency
- 43% ▼ -18.00%
- Median HH income
- $57,142
- Composite
- 30.13/100
- National rank
- #6332
- State rank
- #413 of 539 in PA
Livability — Hemlock Farms
- Score
- 68/100
- State rank
- #884
- US rank
- #9421
Category grades
Schools grade is shown separately in the Schools card above.
Census & demographics
- Census place
- Hemlock Farms, PA
- Population (ZIP)
- 12,446
Population outlook (Pike County) Hauer SSP2
- Today (2025)
- 53,548 people
- By 2030
- 51,622 · -3.6%
- By 2040
- 46,490 · -13.2%
- By 2050
- 40,372 · -24.6%
- By 2075
- 31,951 · -40.3%
- By 2100
- 26,821 · -49.9%
Race, ethnicity, and origin ACS 2023
- Neighborhood character
- Predominantly White (85%)
- Race & ethnicity
- White 85% Hispanic / Latino 8% Two or more races 6% Black 1% Asian 1%
- Hispanic origin (detail)
- Puerto Rican 5%
- Common ancestry
- Romanian 5% Portuguese 3% Italian 2%
- Foreign-born
- 5% · Canada
- Languages at home
- 91% English-only · Spanish 5% Russian/Polish/Slavic 1% Other Asian/Pacific 1%
Political lean MEDSL · Pike
- 2024 margin
- Strong R (+24.1) · D 37.6% · R 61.6%
- 2008→2024 swing
- -19.8pp toward R · 2008: -4.2pp · 2024: -24.1pp
- All cycles
- 2024: R+24.1 2020: R+19.0 2016: R+26.0 2012: R+11.0 2008: R+4.2
Not yet ingested
- Civics
- —
Market trends
- HPI YoY
- ▲ 28.60%
- Current HPI
- 340.8254
- Rent YoY
- —
- Metro
- —
- State GDP YoY
- ▲ 1.68%
- F500 in state
- 34
Industry mix (Fortune 500 HQ in PA)
| Industry | F500 HQs | Revenue |
|---|---|---|
| Healthcare | 2 | $309B |
|
||
| Insurance | 2 | $27B |
|
||
| Telecommunications / Media | 1 | $124B |
|
||
| Industrial Distribution | 1 | $22B |
|
||
| Financial Services | 1 | $20B |
|
||
| Chemicals / Materials | 1 | $18B |
|
||
Price history
+201.3% since first listed6 events — show timeline
- 2026-06-13 Listed $337,500 PWMLS
- 2025-08-28 Listed $340,000 PWMLS
- 2019-04-29 Sold (MLS) $125,000 PWMLS
- 2018-05-02 Listed $149,000 PWMLS
- 2015-09-25 Sold (MLS) $107,500 PWMLS
- 2015-05-22 Listed $112,000 PWMLS
Cash-flow waterfall
monthlySold comps — $/sqft
last 12 mo · ≤1 miLoading sold comps…