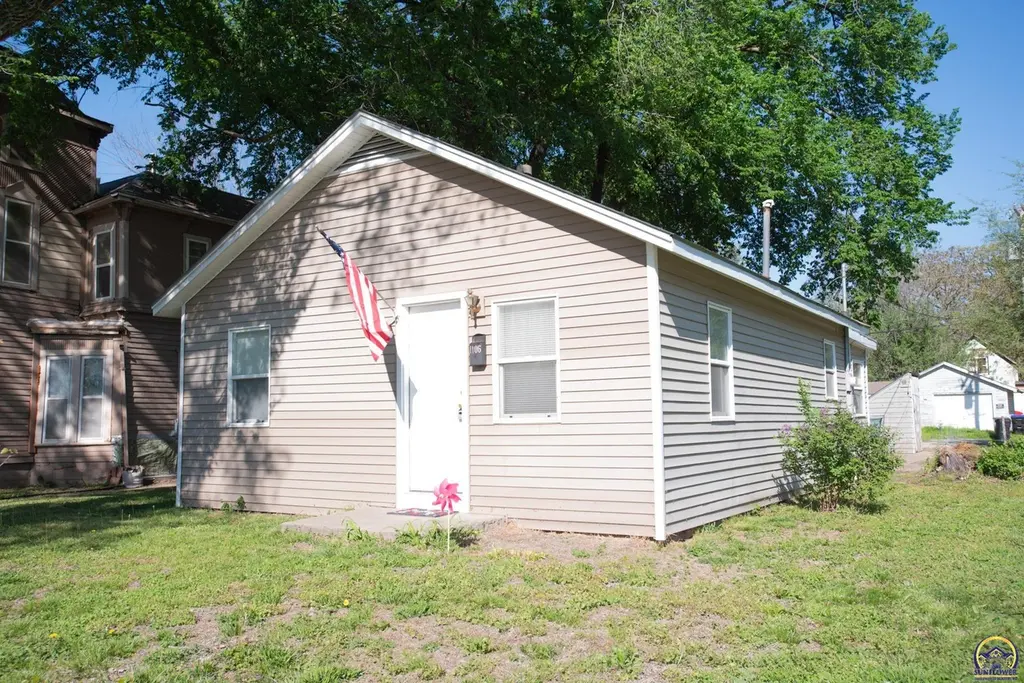
1106 NW Jackson St · Topeka, KS
Flood risk 6/10 · Moderate
- FEMA flood zone
- X
- Chance of flooding over 30 yrs
- 0.27%
- Est. flood insurance / yr
- $507 – $1,088
Fire risk 4/10 · Minor
- Est. fire insurance / yr
- $1,154 – $2,142
Heat risk 5/10 · Moderate
- Hot days now (above 108°F)
- 7 days/yr
- Hot days in 30 yrs
- 17 days/yr
Wind risk 2/10 · Minimal
- Chance of severe wind over 30 yrs
- —
Air-quality risk 2/10 · Minimal
- Unhealthy air days now
- 1 days/yr
- Unhealthy air days in 30 yrs
- 2 days/yr
Risk factors via First Street. Map © Google.
Why this score? — see what drove the B grade
The composite is a weighted blend of 9 inputs, each scored 0–100. Each bar is that input's sub-score; the figure is the points it added to the 100-point composite (weight × sub-score).
- Cash flow +28.1/30.0
- DSCR +10.0/10.0
- ARV discount +7.5/15.0
- Appreciation +7.5/10.0
- 1% rule +7.2/10.0
- Livability +3.5/5.0
- Rent growth +2.5/5.0
- Condition / age +2.5/5.0
- Schools +1.7/10.0
$80,000
🖨 Deal sheet 📄 Offer letter ✓ Due diligence
Listing remarks MLS
This 2 bedroom ranch-style home features hardwood floors, ceramic tile, detached garage and mud room. All newer PLEX plumbing. This property is being sold AS IS. Sellers are licensed real estate agents in the state of Kansas.
Key facts
- 5,663 sq ft lot
- Garage
- Built 1952
Property features AI
Exterior
- Parking: Detached 1-car garage
- Utilities: Public water; Public sewer
- Home design: Single-family residence; Residential property
- Construction: Frame construction
- Exterior features: Patio; Lot approximately 38' x 145' (0.13 acre)
Interior
- Kitchen: Eat-in kitchen
- Flooring: Hardwood flooring; Vinyl flooring
- Bathrooms: 1 full bathroom
- Heating & cooling: Wall furnace heating; Window air conditioning unit(s)
- Interior features: Eat-in kitchen; Patio access
- Laundry & utility: Laundry on main level; Crawl space basement
Neighborhood map
What this means for you Summary
Snapshot
- This is a 2-bed/1.0-bath single-family listed at $80k.
Deal economics
- At list price, monthly cash flow is $251 ($3k/yr) — positive.
- The deal already cash-flows at list — no discount required.
- Meets the 1% rule at list price ($975 rent vs $80k).
- Recommended offer: $79k (1.5% below list) — sets the bar for market timing.
- Cap rate 10.1% vs local median 4.3% in Topeka — top-decile yield for the area; either an underpriced asset or a hidden risk that comps aren't pricing in. Stress-test before assuming the spread holds.
Location & tenants
- Location reads 69/100 on livability (#195 in KS) — a middle-class / working-renter tenant base. Strengths: cost of living A+, housing A+, health & safety A+; Watch: employment C-, crime F, commute F.
- Topeka Public Schools (urban): math 17% / reading 23% proficiency, ranked #158 of 169 in KS (top 94%) — low school quality limits family demand, transient renter base, plan for 1-2y turnover; 69% free/reduced lunch — lower-income household profile, screen leases tightly.
- Zoned schools: Lowman Hill Elem (math 17% / reading 22%, grade F, #593 of 684 statewide, top 89%, 308 students, 88% FRL); Chase Middle School (math 11% / reading 15%, grade F, #188 of 219 statewide, top 87%, 378 students, 93% FRL); Topeka High (math 11% / reading 20%, grade F, #248 of 327 statewide, top 76%, 1,514 students, 72% FRL) — zoned schools average 84% FRL vs 69% district-wide (16 pts higher); higher-poverty schools than district average — tighter screening recommended.
- Market conditions: 32 active listings in the ZIP; 9 comparable units currently listed for rent nearby; rentals at typical pace (median 21d on market — plan ~3-4 weeks tenant-placement turnaround); 219 units permitted in Shawnee County in 2024 (25 in 5+ unit buildings).
Forward outlook
- In year one you build about $5k of equity ($553 loan paydown + $4k appreciation (5.0% local appreciation)).
- Shawnee County population projected to shrink 7% by 2050 — rents likely to lag national; underwrite the cash flow, not the appreciation.
- At projected returns (5.0% appreciation + 3.0% rent growth), your $22k cash investment doubles in ~3 years — after that, you're playing with house money.
- By year 8, paydown + projected appreciation supports a ~$35k cash-out refi (75% LTV) — recoverable capital for the next deal without selling this one.
Negotiation context
- It's been on market 16 days — a 2% lower offer ($79k) is reasonable based on typical stale-listing flexibility.
- 3 sale attempts since 10y ago with the ask held roughly flat each time — persistent listings suggest the price (not the market) is what's stuck; bring a comps-based counter.
Risks & watch-outs
- Watch-outs: built in 1952 — expect roof / HVAC / electrical / plumbing capex.
- Climate carrying-cost: major flood risk; extreme-heat days projected 7→17/yr by 2055 (HVAC capex compounding) — expect insurance premiums to compound above CPI over the hold.
Questions for the listing agent
- Built in 1952 — when were the roof, HVAC, electrical panel, plumbing, and water heater last replaced?
- Is there a deadline driving the sale (1031 exchange, divorce, estate, relocation)? That informs how much negotiation room exists.
- Schools are D-rated, which usually means shorter tenancies and higher turnover. Who's the typical renter profile here, and what's been the actual vacancy rate?
- Crime grade is F in this area — have there been break-ins, vandalism, or insurance claims at this property in the last 3 years? What carrier currently insures it and at what premium?
- What's the average days-on-market for RENTAL listings here right now (not sales)? A rising rental-DOM trend means longer vacancies and softer asking-rent achievability than the comps imply.
- What's the recent tenant-quality profile in this submarket — average credit score on applications, eviction rate, late-payment / NSF rate, and stable-employment percentage? A property-management company in the area should have these aggregated.
- How much new for-sale + rental construction is in the pipeline within 1–3 miles? Heavy new supply typically softens prices + rents 12–24 months out; constrained supply supports both.
Investment metrics
- 1% rule
- 1.22% ✓
- Cap rate
- 10.06%
- Cash-on-cash
- 13.44%
- DSCR
- 1.60
- GRM
- 6.8
CMA / ARV
No comps found within radius.
Projected returns pro-forma
5.04% appreciation · 3.0% rent growth · sell at horizon
- IRR
- 24.5%
- Equity multiple
- 2.54×
- Total profit
- $34,583
- Equity at exit
- $45,513
- IRR
- 23.7%
- Equity multiple
- 5.05×
- Total profit
- $90,653
- Equity at exit
- $78,696
Cash invested: $22,400 (down + closing). Projections, not guarantees.
Landlord ↔ Tenant lean methodology
- Overall (STATE)
- 83 Strongly Landlord-Friendly
- State Kansas
- 83 Strongly Landlord-Friendly · R+10
- County
- — inherits STATE
- City
- — inherits STATE
ZIP-level market 66608
- Home prices YoY
- 2.3%
- Active inventory
- 32
- Price-to-rent
- 6.8×
Monthly cashflow live
- Estimated rent
- $975 high interval (Pro) →
- Mortgage (P&I)
- −$420
- Tax from tax record
- −$66 /mo · $795/yr
- Insurance
- −$33
- HOA
- −$0
- Vacancy / Maint / Mgmt
- −$205
- Net cashflow
- $251
Break-even live
UW: 25.0% down · 7.5% · 30yr · 1.5% tax · 5.0% vac · 8.0% maint · 8.0% mgmt
Financing live
Cash to close
- Down payment
- $20,000
- Closing costs
- $2,400
- Reserves months
- —
- Total cash needed
- —
Loan-product check · same deal, 3 products live
Conventional
25% down · 7.5% · 30yr
- Down + closing
- —
- Monthly P&I
- —
- Monthly cashflow
- —
- DSCR
- —
- Eligible?
- —
Personal DTI + credit; lowest rate.
DSCR
20% down · 8.5% · 30yr
- Down + closing
- —
- Monthly P&I
- —
- Monthly cashflow
- —
- DSCR
- —
- Eligible?
- —
No personal income docs; deal must DSCR.
Hard money
10% down · 12.0% · 12mo
- Down + closing
- —
- Monthly P&I
- —
- Monthly cashflow
- —
- DSCR
- —
- Eligible?
- —
Short-term bridge; refi at stabilization.
Rent comps 9 comps
| Address | Beds | Baths | Sqft | Rent | $/sqft | DOM | Units | Dist |
|---|---|---|---|---|---|---|---|---|
| 1104 NW Starlight Cir Topeka, KS | 3.0 | 2.0 | 1024 | $960 | $0.94 | 21d | 1 | 0.68mi |
| 1700 NW Polk St Topeka, KS | 3.0 | 1.0 | 988 | $1,350 | $1.37 | 21d | 1 | 0.72mi |
| 101 N Kansas Ave Topeka, KS | 2.0 | 1.0 | 1009 | $1,325 | $1.31 | 21d | 3 | 0.84mi |
| 1920 NW Wilcox Ct Unit 1920 Topeka, KS | 3.0 | 2.0 | 1000 | $850 | $0.85 | 21d | 1 | 0.96mi |
| 1001 NE Atchison Ave Topeka, KS | 2.0 | 1.0 | 689 | $809 | $1.17 | 21d | 19 | 1.13mi |
| 502 NE Freeman Ave Topeka, KS | 2.0 | 1.0 | 750 | $875 | $1.17 | 21d | 1 | 1.27mi |
| 603 SW Topeka Blvd Topeka, KS | 1.0 | 1.0 | 710 | $700 | $0.99 | 21d | 1 | 1.41mi |
| 1141 NE Chester Ave Topeka, KS | 2.0 | 1.0 | 750 | $850 | $1.13 | 21d | 1 | 1.41mi |
| 507 SW 6th Ave Unit 001 Topeka, KS | 1.0 | 1.0 | 710 | $700 | $0.99 | 21d | 1 | 1.42mi |
Listing history 9 events
-
2026-05-11status Pending
-
2026-05-01historical Active Under Contract
-
2026-04-23status Pending
-
2026-04-17$80,000 Active
-
2017-07-17soldstatus
-
2017-07-14soldstatus 225-char remark
Show marketing remark (225 chars)
This 2 bedroom ranch-style home features hardwood floors, ceramic tile, detached garage and mud room. All newer PLEX plumbing. This property is being sold AS IS. Sellers are licensed real estate agents in the state of Kansas.
-
2017-05-02$18,000 225-char remark
Show marketing remark (225 chars)
This 2 bedroom ranch-style home features hardwood floors, ceramic tile, detached garage and mud room. All newer PLEX plumbing. This property is being sold AS IS. Sellers are licensed real estate agents in the state of Kansas.
-
2016-07-22$25,000
-
2008-06-02soldstatus
ⓘ Source: listings_history table (triggers on properties + properties_extension) + one-shot
backfill from property_details.listing_events for pre-trigger history.
Tax reassessment forecast KS · Resets to sale price
- Current annual tax
- $795 · $66/mo
- Projected year-2 tax
- $1,128 · $94/mo
- Expected delta
- +$333/yr (+$28/mo · 41.9%)
ⓘ Screening estimate from a state-policy table — verify with the county assessor before closing.
Climate risk First Street
- Flood 6/10 Major FEMA zone X · 27% chance over 30 yrs
- Wildfire 4/10 Moderate
- Heat 5/10 Major 7 d/yr ≥108°F today · 17 d/yr by 30 yrs out
- Wind 2/10 Low
- Air quality 2/10 Low 1 unhealthy d/yr today · 2 by 30 yrs out
Nearby sold comps map
Loading sold comps map…
Walkable amenities ~0.75 mi
Loading nearby amenities…
Taxation est. · year 1
- Rental income
- $11,697
- − Mortgage interest
- −$4,481
- − Property taxes
- −$795
- − Insurance
- −$400
- − Repairs & maintenance
- −$936
- − Management
- −$936
- − Depreciation
- −$2,327
- Taxable income
- $1,822
- Est. tax owed @ 24.0%
- −$437
- After-tax cash flow
- $2,574/yr
For passive investors: Depreciation is non-cash, so a rental often shows a tax loss while cash-flowing — sheltering income. Rental losses are passive: they offset passive income freely, and up to $25,000/yr can offset ordinary (W-2) income if you actively participate and your MAGI is under $100k (phasing out to $0 by $150k); unused losses carry forward. On sale, claimed depreciation is recaptured at up to 25%, and gains may owe capital-gains tax (a 1031 exchange can defer both). Figures are a year-1 estimate at your 24.0% rate — not tax advice; consult a CPA.
Schools (NCES district)
- District
- Topeka Public Schools
- NCES district ID
- 2012260
- Math proficiency
- 17% ▼ -8.00%
- Reading proficiency
- 23% ▼ -2.00%
- Median HH income
- $37,405
- Composite
- 16.69/100
- National rank
- #9167
- State rank
- #158 of 169 in KS
Livability — Topeka
- Score
- 69/100
- State rank
- #195
- US rank
- #8848
Category grades
Schools grade is shown separately in the Schools card above.
Census & demographics
- Census place
- Topeka, KS
- City population
- 118,130
- Population (ZIP)
- 4,789
Population outlook (Shawnee County) Hauer SSP2
- Today (2025)
- 179,277 people
- By 2030
- 177,762 · -0.8%
- By 2040
- 172,341 · -3.9%
- By 2050
- 166,330 · -7.2%
- By 2075
- 152,417 · -15.0%
- By 2100
- 134,782 · -24.8%
Race, ethnicity, and origin ACS 2023
- Neighborhood character
- Predominantly White (78%)
- Race & ethnicity
- White 78% Black 10% Two or more races 8% Hispanic / Latino 7%
- Hispanic origin (detail)
- Mexican 6%
- Common ancestry
- Lithuanian 2% Romanian 2% Iranian 2%
- Foreign-born
- 1% · Canada, South Korea
- Languages at home
- 95% English-only · Spanish 4% Korean 1%
Political lean MEDSL · Shawnee
- 2024 margin
- Toss-up / Even · D 49.3% · R 48.8% · Other 2.0%
- 2008→2024 swing
- +0.8pp no change · 2008: -0.3pp · 2024: 0.5pp
- All cycles
- 2024: D+0.5 2020: D+3.0 2016: R+2.8 2012: R+1.7 2008: R+0.3
Not yet ingested
- Civics
- —
Market trends
- HPI YoY
- ▲ 5.04%
- Current HPI
- 223.2676
- Rent YoY
- —
- Metro
- —
- State GDP YoY
- —
- F500 in state
- 0
Price history
+220.0% since first listed9 events — show timeline
- 2026-05-11 Pending — Sunflower MLS as distributed by MLS GRID
- 2026-05-01 Contingent — Sunflower MLS as distributed by MLS GRID
- 2026-04-23 Pending — Sunflower MLS as distributed by MLS GRID
- 2026-04-17 Listed $80,000 Sunflower MLS as distributed by MLS GRID
- 2017-07-17 Sold (Public Records) — Public Records
- 2017-07-14 Sold (MLS) — Sunflower MLS as distributed by MLS GRID
- 2017-05-02 Listed $18,000 Sunflower MLS as distributed by MLS GRID
- 2016-07-22 Listed $25,000 Sunflower MLS as distributed by MLS GRID
- 2008-06-02 Sold (Public Records) — Public Records
Property tax history
+4.5%/yrLatest (2025): $795 · +4.7% YoY. Source: county tax records.
Cash-flow waterfall
monthlySold comps — $/sqft
last 12 mo · ≤1 miLoading sold comps…