815/811/817 W 12th St #815 · Bonham, TX
Flood risk 1/10 · Minimal
- FEMA flood zone
- X (unshaded)
- Chance of flooding over 30 yrs
- 0.0%
- Est. flood insurance / yr
- $507 – $1,088
Fire risk 6/10 · Moderate
- Est. fire insurance / yr
- $1,222 – $2,270
Heat risk 7/10 · Major
- Hot days now (above 111°F)
- 7 days/yr
- Hot days in 30 yrs
- 22 days/yr
Wind risk 4/10 · Minor
- Chance of severe wind over 30 yrs
- 24.0%
Air-quality risk 2/10 · Minimal
- Unhealthy air days now
- 1 days/yr
- Unhealthy air days in 30 yrs
- 1 days/yr
Risk factors via First Street. Map © Google.
Why this score? — see what drove the B- grade
The composite is a weighted blend of 9 inputs, each scored 0–100. Each bar is that input's sub-score; the figure is the points it added to the 100-point composite (weight × sub-score).
- Cash flow +30.0/30.0
- 1% rule +10.0/10.0
- DSCR +10.0/10.0
- ARV discount +7.5/15.0
- Schools +3.2/10.0
- Livability +3.2/5.0
- Rent growth +2.5/5.0
- Condition / age +2.2/5.0
- Appreciation +0.0/10.0
$79,000
🖨 Deal sheet 📄 Offer letter ✓ Due diligence
Listing remarks MLS
BACK ON THE MARKET!!! BRING YOUR IDEAS AND MAKE THIS HOME AND PROPERTY AMAZING. Investor & Handyman Special! Great investment opportunity in the growing city of Bonham. This spacious home sits on a rare triple lot, almost a half acre of land, with mature trees and offers plenty of sq footage to redesign your ideal floor plan. Features include central heat and air, a large storm Cellar, single-car attached garage, and a large storage building. Conveniently located near Bonham State Park, Lake Bonham, and the new beautiful Bois D'Arc Lake. Great Boating and Camping, Home of Fannin County Trade Days, Antique Stores, and easy access to Hwy 78,121, and 69. Enjoy nearby shopping and dining in both Bonham and Sherman! So much potential a great price! SELLER WILL OWNER FINANCE! Qualifies for Special Warranty Deed.
Key facts
- Central heat and air
- Large storm cellar
- Triple lot
Tags
Neighborhood map
What this means for you Summary
Snapshot
- This is a 2-bed/1.0-bath single-family listed at $79k. Condition is rated fair.
Deal economics
- At list price, monthly cash flow is $671 ($8k/yr) — positive.
- The deal already cash-flows at list — no discount required.
- Meets the 1% rule at list price ($2k rent vs $79k).
- Recommended offer: $70k (12.0% below list) — sets the bar for market timing.
- Cap rate 16.5% vs local median 3.5% in Bonham — top-decile yield for the area; either an underpriced asset or a hidden risk that comps aren't pricing in. Stress-test before assuming the spread holds.
Location & tenants
- Location reads 64/100 on livability (#785 in TX) — a middle-class / working-renter tenant base. Strengths: crime A+, cost of living A+, housing A+; Watch: employment D, schools D-, amenities F.
- Bonham ISD (town): math 37% / reading 38% proficiency, ranked #477 of 826 in TX (top 58%) — families likely to look elsewhere, expect single-tenant / working-renter base with shorter leases.
- Market conditions: 277 active listings in the ZIP; 5 comparable units currently listed for rent nearby; rentals lingering (median 44d on market — plan ~5-8 weeks vacancy on turnover, expect pricing pressure); 60% of comp listings sitting > 30 days — soft ceiling on asking rent; 82 units permitted in Fannin County in 2024 (0 in 5+ unit buildings).
Forward outlook
- Local home prices are declining (-3.0%/yr); year-one equity from $546 of loan paydown is wiped out by about $2k of value loss. Plan a longer hold.
- Fannin County population projected to shrink 6% by 2050 — rents likely to lag national; underwrite the cash flow, not the appreciation.
- At projected returns (-3.0% appreciation + 3.0% rent growth), your $22k cash investment doubles in ~4 years — after that, you're playing with house money.
Negotiation context
- It's been on market 147 days — a 12% lower offer ($70k) is reasonable based on typical stale-listing flexibility.
- 3 sale attempts; this cycle's ask is 5% above the opening price — seller raised mid-cycle; expect resistance to lowballs.
Risks & watch-outs
- Watch-outs: built in 1935 — expect roof / HVAC / electrical / plumbing capex.
- Climate carrying-cost: major wildfire risk; extreme-heat days projected 7→22/yr by 2055 (HVAC capex compounding) — expect insurance premiums to compound above CPI over the hold.
Questions for the listing agent
- It's been on market 147 days. Have you received any prior offers? Is the seller open to a 12% concession, seller financing, or rate buy-down credit?
- Have any recent inspections been done? Can we get a copy of the seller's disclosures and any deferred-maintenance estimates?
- Built in 1935 — when were the roof, HVAC, electrical panel, plumbing, and water heater last replaced?
- Why hasn't it sold? Are there any deal-killer items the seller is aware of (foundation, flood, title, zoning, code violations)?
- Is there a deadline driving the sale (1031 exchange, divorce, estate, relocation)? That informs how much negotiation room exists.
- Schools are D-rated, which usually means shorter tenancies and higher turnover. Who's the typical renter profile here, and what's been the actual vacancy rate?
- What's the average days-on-market for RENTAL listings here right now (not sales)? A rising rental-DOM trend means longer vacancies and softer asking-rent achievability than the comps imply.
- What's the recent tenant-quality profile in this submarket — average credit score on applications, eviction rate, late-payment / NSF rate, and stable-employment percentage? A property-management company in the area should have these aggregated.
- How much new for-sale + rental construction is in the pipeline within 1–3 miles? Heavy new supply typically softens prices + rents 12–24 months out; constrained supply supports both.
Investment metrics
- 1% rule
- 1.95% ✓
- Cap rate
- 16.49%
- Cash-on-cash
- 36.42%
- DSCR
- 2.62
- GRM
- 4.3
CMA / ARV
- ARV (median comp)
- $166,485
- List price
- $79,000
- Delta
- -52.55%
- Verdict
- UNDERPRICED
- Comps
- 20 within 1.0 mi
Show comp detail 12 sales within ~0.75 mi
| Address | Dist | Beds/Ba | Sqft | Sold | Price | $/sf | Match |
|---|---|---|---|---|---|---|---|
| 621 W 12th St | 0.12mi | 3/2.0 (+1) | 1,708 (-4%) | 6mo | $99,900 | $58 | 73 |
| 709 Beech St | 0.31mi | 2/2.0 | 1,563 (-12%) | 3mo | $180,000 | $115 | 59 |
| 1016 Poplar St | 0.28mi | 3/2.5 (+1) | 1,680 (-6%) | 12mo | $169,900 | $101 | 57 |
| 520 Allen Ave | 0.34mi | 2/1.0 | 1,594 (-10%) | 13mo | $75,000 | $47 | 56 |
| 608 W 6th St | 0.40mi | 3/2.0 (+1) | 1,699 (-4%) | 13mo | $185,000 | $109 | 54 |
| 321 W 6th St | 0.51mi | 3/1.0 (+1) | 1,846 (+4%) | 21mo | $55,500 | $30 | 47 |
| 1117 W 12th St | 0.21mi | 3/2.0 (+1) | 1,948 (+10%) | 23mo | $170,000 | $87 | 47 |
| 1901 Franklin Ave | 0.75mi | 3/2.0 (+1) | 1,766 (-1%) | 14mo | $275,000 | $156 | 44 |
| 215 E 11th St | 0.62mi | 3/2.0 (+1) | 1,648 (-7%) | 17mo | $189,900 | $115 | 35 |
| 1820 Franklin Ave | 0.74mi | 3/3.0 (+1) | 1,693 (-5%) | 12mo | $230,000 | $136 | 34 |
| 202 W Denison Ave | 0.70mi | 3/2.0 (+1) | 1,640 (-8%) | 13mo | $255,000 | $155 | 34 |
| 1116 Park Ave | 0.74mi | 3/3.0 (+1) | 1,988 (+12%) | 11mo | $85,000 | $43 | 24 |
Match score weights: distance 35% · size 25% · config 20% · recency 20%. Top-matched comps best support the ARV.
Projected returns pro-forma
-3.0% appreciation · 3.0% rent growth · sell at horizon
- IRR
- 32.2%
- Equity multiple
- 2.36×
- Total profit
- $29,975
- Equity at exit
- $11,779
- IRR
- 39.3%
- Equity multiple
- 4.67×
- Total profit
- $81,248
- Equity at exit
- $6,830
Cash invested: $22,120 (down + closing). Projections, not guarantees.
Landlord ↔ Tenant lean methodology
- Overall (STATE)
- 87 Strongly Landlord-Friendly
- State Texas
- 87 Strongly Landlord-Friendly · R+5
- County
- — inherits STATE
- City
- — inherits STATE
ZIP-level market 75418
- Home prices YoY
- -8.9%
- Active inventory
- 277
- Price-to-rent
- 4.3×
Monthly cashflow live
- Estimated rent
- $1,541 medium interval (Pro) →
- Mortgage (P&I)
- −$414
- Tax est. 1.5%
- −$99 /mo · $1,185/yr
- Insurance
- −$33
- HOA
- −$0
- Vacancy / Maint / Mgmt
- −$324
- Net cashflow
- $671
Break-even live
UW: 25.0% down · 7.5% · 30yr · 1.5% tax · 5.0% vac · 8.0% maint · 8.0% mgmt
Financing live
Cash to close
- Down payment
- $19,750
- Closing costs
- $2,370
- Reserves months
- —
- Total cash needed
- —
Loan-product check · same deal, 3 products live
Conventional
25% down · 7.5% · 30yr
- Down + closing
- —
- Monthly P&I
- —
- Monthly cashflow
- —
- DSCR
- —
- Eligible?
- —
Personal DTI + credit; lowest rate.
DSCR
20% down · 8.5% · 30yr
- Down + closing
- —
- Monthly P&I
- —
- Monthly cashflow
- —
- DSCR
- —
- Eligible?
- —
No personal income docs; deal must DSCR.
Hard money
10% down · 12.0% · 12mo
- Down + closing
- —
- Monthly P&I
- —
- Monthly cashflow
- —
- DSCR
- —
- Eligible?
- —
Short-term bridge; refi at stabilization.
Rent comps 5 comps
| Address | Beds | Baths | Sqft | Rent | $/sqft | DOM | Units | Dist |
|---|---|---|---|---|---|---|---|---|
| 913 W 12th St Bonham, TX | 3.0 | 2.0 | 1355 | $1,700 | $1.25 | 43d | 1 | 0.03mi |
| 412 E 7th St Unit 2 Bonham, TX | 3.0 | 2.5 | 1366 | $1,500 | $1.10 | 43d | 1 | 0.78mi |
| 805 S 6th St Unit 1 Bonham, TX | 3.0 | 2.5 | 1229 | $1,450 | $1.18 | 43d | 1 | 0.87mi |
| 808 E 12th St Bonham, TX | 3.0 | 2.0 | 1234 | $1,595 | $1.29 | 18d | 1 | 1.02mi |
| 608 E 3rd St Bonham, TX | 3.0 | 2.0 | 2383 | $1,299 | $0.55 | 24d | 1 | 1.06mi |
Listing history 19 events
-
2026-06-15days on market $79,000 Active 147 DOM
-
2026-06-14days on market $79,000 Active 145 DOM
-
2026-06-12days on market $79,000 Active 144 DOM
-
2026-06-09days on market $79,000 Active 141 DOM
-
2026-06-08days on market $79,000 Active 140 DOM
-
2026-06-07days on market $79,000 Active 139 DOM
-
2026-06-05days on market $79,000 Active 137 DOM
-
2026-06-04days on market $79,000 Active 135 DOM
-
2026-06-02days on market $79,000 Active 134 DOM
-
2026-06-01days on market $79,000 Active 133 DOM
-
2026-05-31days on market $79,000 Active 132 DOM
-
2026-05-31days on market $79,000 Active 131 DOM
-
2026-04-03price $79,000 839-char remark
Show marketing remark (839 chars)
BACK ON THE MARKET!!! BRING YOUR IDEAS AND MAKE THIS HOME AND PROPERTY AMAZING. Investor & Handyman Special! Great investment opportunity in the growing city of Bonham. This spacious home sits on a rare triple lot, almost a half acre of land, with mature trees and offers plenty of sq footage to redesign your ideal floor plan. Features include central heat and air, a large storm Cellar, single-car attached garage, and a large storage building. Conveniently located near Bonham State Park, Lake Bonham, and the new beautiful Bois D'Arc Lake. Great Boating and Camping, Home of Fannin County Trade Days, Antique Stores, and easy access to Hwy 78,121, and 69. Enjoy nearby shopping and dining in both Bonham and Sherman! So much potential a great price! SELLER WILL OWNER FINANCE! Qualifies for Special Warranty Deed.
-
2026-04-03status Active 839-char remark
Show marketing remark (839 chars)
BACK ON THE MARKET!!! BRING YOUR IDEAS AND MAKE THIS HOME AND PROPERTY AMAZING. Investor & Handyman Special! Great investment opportunity in the growing city of Bonham. This spacious home sits on a rare triple lot, almost a half acre of land, with mature trees and offers plenty of sq footage to redesign your ideal floor plan. Features include central heat and air, a large storm Cellar, single-car attached garage, and a large storage building. Conveniently located near Bonham State Park, Lake Bonham, and the new beautiful Bois D'Arc Lake. Great Boating and Camping, Home of Fannin County Trade Days, Antique Stores, and easy access to Hwy 78,121, and 69. Enjoy nearby shopping and dining in both Bonham and Sherman! So much potential a great price! SELLER WILL OWNER FINANCE! Qualifies for Special Warranty Deed.
-
2026-03-14status Pending 839-char remark
Show marketing remark (839 chars)
BACK ON THE MARKET!!! BRING YOUR IDEAS AND MAKE THIS HOME AND PROPERTY AMAZING. Investor & Handyman Special! Great investment opportunity in the growing city of Bonham. This spacious home sits on a rare triple lot, almost a half acre of land, with mature trees and offers plenty of sq footage to redesign your ideal floor plan. Features include central heat and air, a large storm Cellar, single-car attached garage, and a large storage building. Conveniently located near Bonham State Park, Lake Bonham, and the new beautiful Bois D'Arc Lake. Great Boating and Camping, Home of Fannin County Trade Days, Antique Stores, and easy access to Hwy 78,121, and 69. Enjoy nearby shopping and dining in both Bonham and Sherman! So much potential a great price! SELLER WILL OWNER FINANCE! Qualifies for Special Warranty Deed.
-
2025-12-30$75,000 Active 839-char remark
Show marketing remark (839 chars)
BACK ON THE MARKET!!! BRING YOUR IDEAS AND MAKE THIS HOME AND PROPERTY AMAZING. Investor & Handyman Special! Great investment opportunity in the growing city of Bonham. This spacious home sits on a rare triple lot, almost a half acre of land, with mature trees and offers plenty of sq footage to redesign your ideal floor plan. Features include central heat and air, a large storm Cellar, single-car attached garage, and a large storage building. Conveniently located near Bonham State Park, Lake Bonham, and the new beautiful Bois D'Arc Lake. Great Boating and Camping, Home of Fannin County Trade Days, Antique Stores, and easy access to Hwy 78,121, and 69. Enjoy nearby shopping and dining in both Bonham and Sherman! So much potential a great price! SELLER WILL OWNER FINANCE! Qualifies for Special Warranty Deed.
-
2025-11-17historical
-
2025-09-09price $99,500
-
2025-07-11$125,000 Active
ⓘ Source: listings_history table (triggers on properties + properties_extension) + one-shot
backfill from property_details.listing_events for pre-trigger history.
Climate risk First Street
- Flood 1/10 Low FEMA zone X (unshaded) · 0% chance over 30 yrs
- Wildfire 6/10 Major
- Heat 7/10 Severe 7 d/yr ≥111°F today · 22 d/yr by 30 yrs out
- Wind 4/10 Moderate 24% chance of damaging wind over 30 yrs
- Air quality 2/10 Low 1 unhealthy d/yr today · 1 by 30 yrs out
Nearby sold comps map
Loading sold comps map…
Walkable amenities ~0.75 mi
Loading nearby amenities…
Taxation est. · year 1
- Rental income
- $18,489
- − Mortgage interest
- −$4,425
- − Property taxes
- −$1,185
- − Insurance
- −$395
- − Repairs & maintenance
- −$1,479
- − Management
- −$1,479
- − Depreciation
- −$2,298
- Taxable income
- $7,228
- Est. tax owed @ 24.0%
- −$1,735
- After-tax cash flow
- $6,321/yr
For passive investors: Depreciation is non-cash, so a rental often shows a tax loss while cash-flowing — sheltering income. Rental losses are passive: they offset passive income freely, and up to $25,000/yr can offset ordinary (W-2) income if you actively participate and your MAGI is under $100k (phasing out to $0 by $150k); unused losses carry forward. On sale, claimed depreciation is recaptured at up to 25%, and gains may owe capital-gains tax (a 1031 exchange can defer both). Figures are a year-1 estimate at your 24.0% rate — not tax advice; consult a CPA.
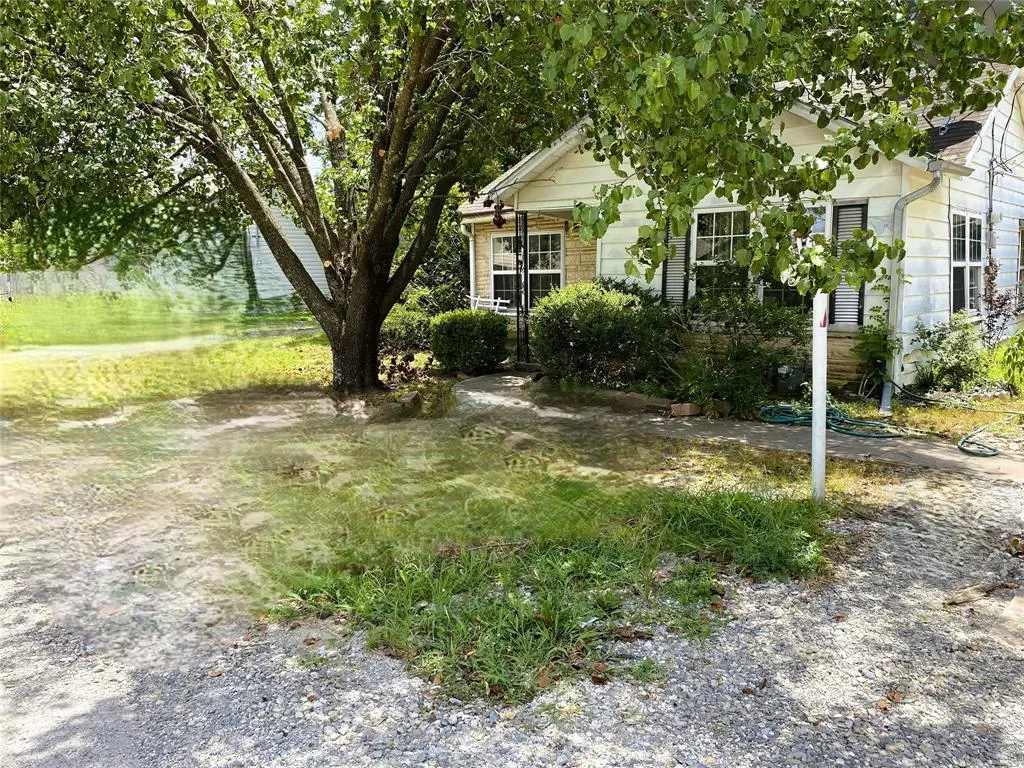
Condition & rehab AI · 12 photos
This property requires significant repairs and maintenance, including landscaping, tree removal, and interior updates. The home has potential for substantial value increase with these improvements.
Repairs flagged
- Major Overgrown lawn — Needs trimming and landscaping
- Major Damaged tree — Needs removal
- Major Worn-out tile flooring — Needs replacement
- Major Worn-out wood paneling — Needs replacement
- Major Old-fashioned tile and fixtures — Needs replacement
Value-add opportunities
- Both Landscaping and tree removal — Improves curb appeal and property value
- Both Tile flooring replacement — Enhances aesthetics and functionality
- Both Wood paneling replacement — Modernizes the interior and adds value
- Both Tile and fixture replacement — Modernizes the bathroom and adds value
Renovation cost estimate screening
| Repair item | Severity | Est. cost |
|---|---|---|
| Overgrown lawn · Needs trimming and landscaping | Major | $15,000–50,000 |
| Damaged tree · Needs removal | Major | $15,000–50,000 |
| Worn-out tile flooring · Needs replacement | Major | $15,000–50,000 |
| Worn-out wood paneling · Needs replacement | Major | $15,000–50,000 |
| Old-fashioned tile and fixtures · Needs replacement | Major | $15,000–50,000 |
| Total estimated repair cost · 5 items | $75,000–250,000 |
Value-add ROI direction
- Both Landscaping and tree removal — Improves curb appeal and property value ↑
- Both Tile flooring replacement — Enhances aesthetics and functionality ↑
- Both Wood paneling replacement — Modernizes the interior and adds value ↑
- Both Tile and fixture replacement — Modernizes the bathroom and adds value ↑
ⓘ Cost ranges are severity-bucket heuristics (US national rule-of-thumb). Get contractor quotes + a written scope before underwriting a rehab budget.
Schools (NCES district)
- District
- Bonham ISD
- NCES district ID
- 4810800
- Math proficiency
- 37% ▼ -1.00%
- Reading proficiency
- 38% ▼ -2.00%
- Median HH income
- $41,740
- Composite
- 31.63/100
- National rank
- #5937
- State rank
- #477 of 826 in TX
Livability — Bonham
- Score
- 64/100
- State rank
- #785
- US rank
- #14360
Category grades
Schools grade is shown separately in the Schools card above.
Census & demographics
- Census place
- Bonham, TX
- County
- Fannin County · 15,155 people
- City population
- 15,155
- Metro
- Bonham, TX
- Population (ZIP)
- 15,155
- Household income
- $68,918
- Rent vs Own
- Severe rent burden
- 281.0
Population outlook (Fannin County) Hauer SSP2
- Today (2025)
- 33,423 people
- By 2030
- 33,035 · -1.2%
- By 2040
- 32,250 · -3.5%
- By 2050
- 31,462 · -5.9%
- By 2075
- 29,447 · -11.9%
- By 2100
- 25,459 · -23.8%
Race, ethnicity, and origin ACS 2023
- Neighborhood character
- Predominantly White (68%)
- Race & ethnicity
- White 68% Hispanic / Latino 17% Black 10% Two or more races 8%
- Hispanic origin (detail)
- Mexican 16%
- Common ancestry
- Lithuanian 3% Slovak 1% Italian 1%
- Foreign-born
- 7% · Canada, Philippines
- Languages at home
- 85% English-only · Spanish 14%
Political lean MEDSL · Fannin
- 2024 margin
- Solid R (+67.4) · D 15.9% · R 83.3%
- 2008→2024 swing
- -27.8pp toward R · 2008: -39.6pp · 2024: -67.4pp
- All cycles
- 2024: R+67.4 2020: R+63.4 2016: R+61.9 2012: R+52.5 2008: R+39.6
Not yet ingested
- Civics
- —
Market trends
- HPI YoY
- ▼ -25.59%
- Current HPI
- 262.7177
- Rent YoY
- —
- Metro
- Bonham, TX
- State GDP YoY
- ▲ 3.95%
- F500 in state
- 110
Industry mix (Fortune 500 HQ in TX)
| Industry | F500 HQs | Revenue |
|---|---|---|
| Energy | 16 | $1,198B |
|
||
| Technology | 5 | $198B |
|
||
| Engineering / Construction | 4 | $72B |
|
||
| Energy Services | 3 | $60B |
|
||
| Utilities | 3 | $41B |
|
||
| Healthcare | 2 | $330B |
|
||
Price history
-36.8% since first listed7 events — show timeline
- 2026-04-03 Price Changed $79,000 NTREIS
- 2026-04-03 Relisted — NTREIS
- 2026-03-14 Pending — NTREIS
- 2025-12-30 Listed $75,000 NTREIS
- 2025-11-17 Listing Removed — NTREIS
- 2025-09-09 Price Changed $99,500 NTREIS
- 2025-07-11 Listed $125,000 NTREIS
Cash-flow waterfall
monthlySold comps — $/sqft
last 12 mo · ≤1 miLoading sold comps…