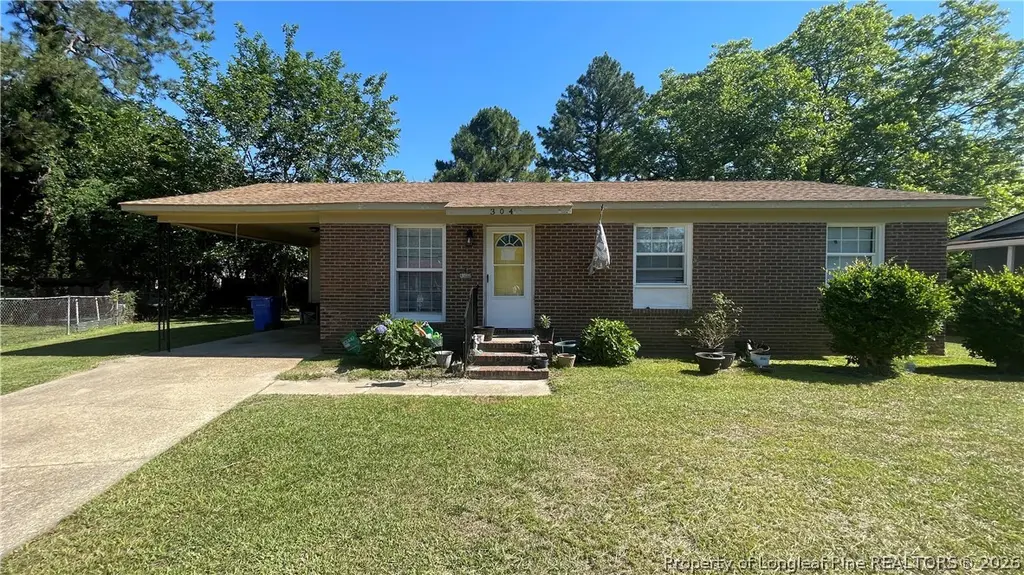
304 Bighorn Dr · Fayetteville, NC
Flood risk 1/10 · Minimal
- FEMA flood zone
- X (unshaded)
- Chance of flooding over 30 yrs
- 0.0%
- Est. flood insurance / yr
- $507 – $1,088
Fire risk 1/10 · Minimal
- Est. fire insurance / yr
- $906 – $1,684
Heat risk 7/10 · Major
- Hot days now (above 106°F)
- 7 days/yr
- Hot days in 30 yrs
- 16 days/yr
Wind risk 6/10 · Moderate
- Chance of severe wind over 30 yrs
- 76.0%
Air-quality risk 2/10 · Minimal
- Unhealthy air days now
- 0 days/yr
- Unhealthy air days in 30 yrs
- 1 days/yr
Risk factors via First Street. Map © Google.
Why this score? — see what drove the C+ grade
The composite is a weighted blend of 9 inputs, each scored 0–100. Each bar is that input's sub-score; the figure is the points it added to the 100-point composite (weight × sub-score).
- Cash flow +23.3/30.0
- ARV discount +12.4/15.0
- DSCR +7.5/10.0
- 1% rule +5.9/10.0
- Livability +3.8/5.0
- Rent growth +3.3/5.0
- Schools +3.1/10.0
- Condition / age +2.5/5.0
- Appreciation +0.0/10.0
$141,000
🖨 Deal sheet (PDF) 📄 Offer letter ✓ Due diligence
Listing remarks
Welcome to 304 Bighorn Drive! Located on a fenced lot in a cul-de-sac, this home offers 3 bedrooms, 1.5 bathrooms, a comfortable living room, eat-in kitchen, separate laundry area, and a single carport with outside storage. Great investment opportunity or perfect for a buyer using a renovation loan! This home requires only minimal repairs, with the primary improvement being replacement of the HVAC unit. Inside, you'll find several upgrades already completed, including vinyl windows, updated fixtures, ceiling fans, attractive LVP flooring, stylish countertops, upgraded vanities, and a kitchen with stainless steel appliances and an abundance of soft-close cabinets providing plenty of storage
Key facts
- Outside storage
- Single carport
- Cul-de-sac
Tags
Property features AI
Exterior
- Parking: Attached carport; 1 covered parking space; 1 carport space
- Utilities: Public water; Public sewer
- Home design: Single-family residence; Residential property in the PONDEROSA subdivision; Level topography; Interior lot on a cul-de-sac
- Construction: Brick veneer and frame construction
- Exterior features: Storage; Fenced backyard with full fencing
Interior
- Kitchen: Dishwasher; Microwave; Range; Refrigerator; Gas water heater
- Bedrooms: 5 total rooms (bedroom count not specified separately)
- Flooring: Vinyl
- Bathrooms: 1 full bathroom; 1 half bathroom
- Heating & cooling: Central electric air conditioning; Ceiling fans
- Interior features: Ceiling fans; Eat-in kitchen; Crawl space basement
- Laundry & utility: Washer hookup in unit on main level
Neighborhood map
What this means for you Summary
Snapshot
- This is a 3-bed/2.0-bath single-family listed at $141k.
Deal economics
- At list price, monthly cash flow is $258 ($3k/yr) — positive.
- The deal already cash-flows at list — no discount required.
- Meets the 1% rule at list price ($2k rent vs $141k).
- Cap rate 8.5% vs local median 4.8% in Fayetteville — top-decile yield for the area; either an underpriced asset or a hidden risk that comps aren't pricing in. Stress-test before assuming the spread holds.
Location & tenants
- Location reads 75/100 on livability (#45 in NC, #4,031 nationally) — a middle-class / working-renter tenant base. Strengths: commute A+, cost of living A+, housing A+; Watch: crime F, employment D-.
- Cumberland County Schools (urban): math 32% / reading 41% proficiency, ranked #126 of 178 in NC (top 71%) — families likely to look elsewhere, expect single-tenant / working-renter base with shorter leases.
- Zoned schools: Morganton Road Elementary (math 27% / reading 42%, grade F, #835 of 1,410 statewide, top 62%, 499 students, 99% FRL); Westover Middle (math 20% / reading 30%, grade F, #396 of 475 statewide, top 84%, 784 students, 100% FRL); Westover High (math 42% / reading 39%, grade F, #387 of 535 statewide, top 73%, 1,202 students, 100% FRL) — zoned schools average 100% FRL vs 55% district-wide (45 pts higher); higher-poverty schools than district average — tighter screening recommended.
- Market conditions: Rents rising (+3.0%/yr); 287 active listings in the ZIP; 40 comparable units currently listed for rent nearby; rentals at typical pace (median 26d on market — plan ~3-4 weeks tenant-placement turnaround); 1,125 units permitted in Cumberland County in 2024 (104 in 5+ unit buildings).
- This rent runs 32% of the median local income ($58k/yr) — at the standard rent-burdened threshold; future hikes will face affordability resistance.
Forward outlook
- Local home prices are declining (-3.0%/yr); year-one equity from $975 of loan paydown is wiped out by about $4k of value loss. Plan a longer hold.
Negotiation context
- Only 4 days on market — expect competitive offers; lowballing is unlikely to land.
Risks & watch-outs
- Climate carrying-cost: major wind risk, 76% chance of damaging wind over 30y; extreme-heat days projected 7→16/yr by 2055 (HVAC capex compounding) — expect insurance premiums to compound above CPI over the hold.
Questions for the listing agent
- Built in 1970 — when were the roof, HVAC, electrical panel, plumbing, and water heater last replaced?
- Is there a deadline driving the sale (1031 exchange, divorce, estate, relocation)? That informs how much negotiation room exists.
- Crime grade is F in this area — have there been break-ins, vandalism, or insurance claims at this property in the last 3 years? What carrier currently insures it and at what premium?
- What's the average days-on-market for RENTAL listings here right now (not sales)? A rising rental-DOM trend means longer vacancies and softer asking-rent achievability than the comps imply.
- What's the recent tenant-quality profile in this submarket — average credit score on applications, eviction rate, late-payment / NSF rate, and stable-employment percentage? A property-management company in the area should have these aggregated.
- How much new for-sale + rental construction is in the pipeline within 1–3 miles? Heavy new supply typically softens prices + rents 12–24 months out; constrained supply supports both.
Investment metrics
- 1% rule
- 1.09% ✓
- Cap rate
- 8.49%
- Cash-on-cash
- 7.85%
- DSCR
- 1.35
- GRM
- 7.6
CMA / ARV
- ARV (on-the-fly)
- $158,184
- Comps found
- 9
Show comp detail 9 sales within ~0.75 mi
| Address | Dist | Beds/Ba | Sqft | Sold | Price | $/sf | Match |
|---|---|---|---|---|---|---|---|
| 350 Longhorn Dr | 0.36mi | 3/2.5 | 1,050 (+4%) | 1mo | $137,000 | $130 | 74 |
| 300 Bighorn Dr | 0.03mi | 3/1.5 | 1,102 (+9%) | 21mo | $160,000 | $145 | 65 |
| 284 Bonanza Dr | 0.18mi | 3/1.5 | 1,164 (+15%) | 1mo | $184,800 | $159 | 64 |
| 5332 Mesa Ct | 0.63mi | 3/2.0 | 1,050 (+4%) | 5mo | $164,000 | $156 | 60 |
| 303 Longhorn Dr | 0.24mi | 3/1.5 | 1,076 (+6%) | 20mo | $167,000 | $155 | 60 |
| 6018 Concho Ct | 0.52mi | 3/2.0 | 1,120 (+10%) | 12mo | $208,000 | $186 | 48 |
| 805 Bedrock Dr | 0.50mi | 3/2.0 | 1,092 (+8%) | 22mo | $170,000 | $156 | 46 |
| 362 Tucson Dr | 0.38mi | 3/1.0 | 1,135 (+12%) | 24mo | $148,000 | $130 | 39 |
| 805 Maverick Ct | 0.66mi | 3/2.0 | 1,153 (+14%) | 14mo | $206,500 | $179 | 35 |
Match score weights: distance 35% · size 25% · config 20% · recency 20%. Top-matched comps best support the ARV.
Projected returns pro-forma
-3.0% appreciation · 3.01% rent growth · sell at horizon
- IRR
- -4.3%
- Equity multiple
- 0.84×
- Total profit
- $-6,363
- Equity at exit
- $21,024
- IRR
- 5.4%
- Equity multiple
- 1.40×
- Total profit
- $15,767
- Equity at exit
- $12,191
Cash invested: $39,480 (down + closing). Projections, not guarantees.
Landlord ↔ Tenant lean methodology
- Overall (STATE)
- 85 Strongly Landlord-Friendly
- State North Carolina
- 85 Strongly Landlord-Friendly · R+3
- County
- — inherits STATE
- City
- — inherits STATE
ZIP-level market 28303
- Home prices YoY
- -25.4%
- Rents YoY
- 3.0%
- Active inventory
- 287
- Price-to-rent
- 7.6×
Monthly cashflow live
- Estimated rent
- $1,539 high interval (Pro) →
- Mortgage (P&I)
- −$739
- Tax from tax record
- −$160 /mo · $1,916/yr
- Insurance
- −$59
- HOA
- −$0
- Lot rent
- −$0
- Vacancy / Maint / Mgmt
- −$323
- Net cashflow
- $258
Break-even live
Sensitivity live
| Price | -10% $338 | -5% $298 | +0% $258 | +5% $218 | +10% $179 |
|---|---|---|---|---|---|
| Rent | -10% $137 | -5% $198 | +0% $258 | +5% $319 | +10% $380 |
| Rate | -1.0pp $329 | -0.5pp $294 | base $258 | +0.5pp $222 | +1.0pp $185 |
UW: 25.0% down · 7.5% · 30yr · 1.5% tax · 5.0% vac · 8.0% maint · 8.0% mgmt
Financing live
Cash to close
- Down payment
- $35,250
- Closing costs
- $4,230
- Reserves months
- —
- Total cash needed
- —
Loan-product check · same deal, 3 products live
Conventional
25% down · 7.5% · 30yr
- Down + closing
- —
- Monthly P&I
- —
- Monthly cashflow
- —
- DSCR
- —
- Eligible?
- —
Personal DTI + credit; lowest rate.
DSCR
20% down · 8.5% · 30yr
- Down + closing
- —
- Monthly P&I
- —
- Monthly cashflow
- —
- DSCR
- —
- Eligible?
- —
No personal income docs; deal must DSCR.
Hard money
10% down · 12.0% · 12mo
- Down + closing
- —
- Monthly P&I
- —
- Monthly cashflow
- —
- DSCR
- —
- Eligible?
- —
Short-term bridge; refi at stabilization.
Rent comps 40 comps
| Address | Beds | Baths | Sqft | Rent | $/sqft | DOM | Units | Dist |
|---|---|---|---|---|---|---|---|---|
| 5650 Netherfield Pl Fayetteville, NC | 1.0–3.0 | 1.0–2.0 | 1025 | $1,410 | $1.37 | 16d | 38 | 0.26mi |
| 246 Partners Way Fayetteville, NC | 2.0 | 2.0 | 1100 | $1,295 | $1.18 | 26d | 1 | 0.35mi |
| 230 Sawtooth Dr Fayetteville, NC | 1.0–3.0 | 1.0–2.0 | 1040 | $1,550 | $1.49 | 16d | 14 | 0.39mi |
| 6033 Santa Fe Dr Fayetteville, NC | 3.0 | 1.5 | 1325 | $1,500 | $1.13 | 26d | 1 | 0.50mi |
| 5725 Ivanhoe Ct Fayetteville, NC | 1.0–3.0 | 1.0–2.0 | 962 | $1,300 | $1.35 | 16d | 6 | 0.56mi |
| 3311 Woodhill Ln Fayetteville, NC | 1.0–3.0 | 1.0–2.0 | 1195 | $1,730 | $1.45 | 16d | 42 | 0.56mi |
| 267 Waterdown Dr Fayetteville, NC | 3.0 | 2.0 | 1307 | $1,325 | $1.01 | 26d | 1 | 0.62mi |
| 6213 Sabine Dr Fayetteville, NC | 3.0 | 1.5 | 1092 | $1,175 | $1.08 | 26d | 1 | 0.63mi |
| 5414 Plateau Rd Fayetteville, NC | 3.0 | 2.0 | 1116 | $1,595 | $1.43 | 26d | 1 | 0.65mi |
| 349 Waterdown Dr #5 Fayetteville, NC | 3.0 | 2.0 | 1307 | $1,350 | $1.03 | 26d | 1 | 0.68mi |
| 513 Lumberly Ln Fayetteville, NC | 2.0 | 2.0 | 1124 | $1,295 | $1.15 | 26d | 1 | 0.71mi |
| 295 Warton Ln Fayetteville, NC | 3.0 | 2.0 | 1307 | $1,325 | $1.01 | 16d | 1 | 0.71mi |
| 890 Bedrock Dr Fayetteville, NC | 4.0 | 2.5 | 1484 | $1,650 | $1.11 | 26d | 1 | 0.71mi |
| 5410 Laramie Ct Fayetteville, NC | 3.0 | 2.0 | 1446 | $1,600 | $1.11 | 16d | 1 | 0.79mi |
| 5591 Bellflower St Fayetteville, NC | 3.0 | 2.0 | 1273 | $1,575 | $1.24 | 16d | 1 | 0.91mi |
| 111 Grande Oaks Dr Fayetteville, NC | 1.0–3.0 | 1.0–2.0 | 1205 | $1,645 | $1.37 | 16d | 46 | 0.92mi |
| 3374 Starboard Way Fayetteville, NC | 3.0 | 2.5 | 1481 | $2,150 | $1.45 | 16d | 1 | 1.01mi |
| 5508 Faith Dr Fayetteville, NC | 1.0–3.0 | 1.5–3.0 | 1106 | $1,439 | $1.30 | 16d | 10 | 1.06mi |
| 5508 Faith Dr Fayetteville, NC | 1.0–3.0 | 1.5–3.0 | 1106 | $1,439 | $1.30 | 23d | 16 | 1.06mi |
| 5200 Mawood St Fayetteville, NC | 3.0 | 2.0 | 1300 | $1,500 | $1.15 | 16d | 1 | 1.08mi |
| 1000 Antietam Crk Dr Fayetteville, NC | 3.0 | 1.0–2.0 | 1059 | $1,700 | $1.61 | 26d | 14 | 1.17mi |
| 338 Summer Hill Rd Fayetteville, NC | 4.0 | 2.0 | 1474 | $1,550 | $1.05 | 26d | 1 | 1.18mi |
| 3330 Harbour Pointe Pl #12 Fayetteville, NC | 3.0 | 2.0 | 1401 | $1,700 | $1.21 | 16d | 1 | 1.23mi |
| 3050 Plantation Garden Blvd Fayetteville, NC | 1.0–3.0 | 1.0–2.0 | 1158 | $1,781 | $1.54 | 16d | 58 | 1.24mi |
| 622 Dashland Dr Unit B Fayetteville, NC | 2.0 | 1.5 | 750 | $940 | $1.25 | 16d | 1 | 1.25mi |
| 7252 Ainsley St Fayetteville, NC | 3.0 | 1.0 | 1265 | $1,299 | $1.03 | 26d | 1 | 1.29mi |
| 7298 Ryan St Fayetteville, NC | 4.0 | 1.5 | 1315 | $1,400 | $1.06 | 26d | 1 | 1.32mi |
| 2056 Wheeling St Fayetteville, NC | 3.0 | 2.5 | 1401 | $1,595 | $1.14 | 26d | 1 | 1.33mi |
| 5831 Waters Edge Dr Fayetteville, NC | 3.0 | 2.0 | 1344 | $1,545 | $1.15 | 26d | 1 | 1.39mi |
| 4981 Galveston Dr Fayetteville, NC | 2.0 | 1.5 | 750 | $1,050 | $1.40 | 26d | 1 | 1.40mi |
| 205 Brookford Ct Fayetteville, NC | 3.0 | 2.0 | 1196 | $1,640 | $1.37 | 26d | 1 | 1.40mi |
| 202 Bertram Pl Fayetteville, NC | 3.0 | 2.0 | 1175 | $1,300 | $1.11 | 16d | 1 | 1.40mi |
| 5761 Waterwood Dr Fayetteville, NC | 3.0 | 2.0 | 1452 | $1,600 | $1.10 | 23d | 1 | 1.40mi |
| 513 Roundtree Dr Fayetteville, NC | 3.0 | 2.0 | 1337 | $1,775 | $1.33 | 26d | 1 | 1.41mi |
| 3639 Dornoch Dr Fayetteville, NC | 2.0 | 2.0 | 1000 | $1,025 | $1.02 | 26d | 1 | 1.42mi |
| 6445 Independence Pl Dr Fayetteville, NC | 1.0–3.0 | 1.0–3.0 | 1106 | $1,779 | $1.61 | 16d | 18 | 1.42mi |
| 1981 Wheeling St Fayetteville, NC | 3.0 | 2.0 | 1400 | $1,500 | $1.07 | 26d | 1 | 1.43mi |
| 3633 Dornoch Dr Apt E Fayetteville, NC | 2.0 | 2.0 | 1000 | $1,025 | $1.02 | 26d | 1 | 1.44mi |
| 5713 Waterwood Dr Fayetteville, NC | 3.0 | 2.0 | 1440 | $1,650 | $1.15 | 23d | 1 | 1.44mi |
| 3627 Dornoch Dr Apt A Fayetteville, NC | 2.0 | 2.0 | 1000 | $1,025 | $1.02 | 26d | 1 | 1.45mi |
Listing history 1 events
-
2026-05-23$141,000 Active
ⓘ Source: listings_history table (triggers on properties + properties_extension) + one-shot
backfill from property_details.listing_events for pre-trigger history.
Tax reassessment forecast NC · Resets to sale price
- Current annual tax
- $1,916 · $160/mo
- Projected year-2 tax
- $1,916 · $160/mo
- Expected delta
- $0/yr ($0/mo · 0.0%)
ⓘ Screening estimate from a state-policy table — verify with the county assessor before closing.
Climate risk First Street
- Flood 1/10 Low FEMA zone X (unshaded) · 0% chance over 30 yrs
- Wildfire 1/10 Low
- Heat 7/10 Severe 7 d/yr ≥106°F today · 16 d/yr by 30 yrs out
- Wind 6/10 Major 76% chance of damaging wind over 30 yrs
- Air quality 2/10 Low 0 unhealthy d/yr today · 1 by 30 yrs out
Nearby sold comps map
Loading sold comps map…
Walkable amenities ~0.75 mi
Loading nearby amenities…
Taxation est. · year 1
- Rental income
- $18,474
- − Mortgage interest
- −$7,898
- − Property taxes
- −$1,916
- − Insurance
- −$705
- − Repairs & maintenance
- −$1,478
- − Management
- −$1,478
- − Depreciation
- −$4,102
- Taxable income
- $897
- Est. tax owed @ 24.0%
- −$215
- After-tax cash flow
- $2,885/yr
For passive investors: Depreciation is non-cash, so a rental often shows a tax loss while cash-flowing — sheltering income. Rental losses are passive: they offset passive income freely, and up to $25,000/yr can offset ordinary (W-2) income if you actively participate and your MAGI is under $100k (phasing out to $0 by $150k); unused losses carry forward. On sale, claimed depreciation is recaptured at up to 25%, and gains may owe capital-gains tax (a 1031 exchange can defer both). Figures are a year-1 estimate at your 24.0% rate — not tax advice; consult a CPA.
Schools (NCES district)
- District
- Cumberland County Schools
- NCES district ID
- 3700011
- Math proficiency
- 32% ▼ -2.00%
- Reading proficiency
- 41% ▼ -1.00%
- Median HH income
- $44,168
- Composite
- 31.0/100
- National rank
- #6096
- State rank
- #126 of 178 in NC
Livability — Fayetteville
- Score
- 75/100
- State rank
- #45
- US rank
- #4031
Category grades
Schools grade is shown separately in the Schools card above.
Census & demographics
- Census place
- Fayetteville, NC
- County
- Cumberland County · 265,314 people
- City population
- 226,118
- Metro
- Fayetteville, NC
- Population (ZIP)
- 30,965
- Household income
- $58,223
- Rent vs Own
- Severe rent burden
- 1370.0
Population outlook (Cumberland County) Hauer SSP2
- Today (2025)
- 330,855 people
- By 2030
- 333,523 · +0.8%
- By 2040
- 335,583 · +1.4%
- By 2050
- 335,325 · +1.4%
- By 2075
- 342,853 · +3.6%
- By 2100
- 340,698 · +3.0%
Race, ethnicity, and origin ACS 2023
- Neighborhood character
- Diverse neighborhood (Simpson 0.70)
- Race & ethnicity
- White 39% Black 37% Two or more races 11% Hispanic / Latino 10% Asian 4% Pacific Islander 1%
- Hispanic origin (detail)
- Mexican 2% Puerto Rican 3%
- Common ancestry
- Slovak 3% Serbian 1% Lithuanian 1%
- Foreign-born
- 9% · Canada, South Korea, Vietnam
- Languages at home
- 86% English-only · Spanish 7% Other Asian/Pacific 2% Korean 1%
Political lean MEDSL · Cumberland
- 2024 margin
- D (+13.4) · D 56.1% · R 42.7% · Other 1.2%
- 2008→2024 swing
- -4.3pp toward R · 2008: 17.7pp · 2024: 13.4pp
- All cycles
- 2024: D+13.4 2020: D+16.6 2016: D+16.0 2012: D+19.7 2008: D+17.7
Not yet ingested
- Civics
- —
Market trends
- HPI YoY
- ▼ -77.14%
- Current HPI
- 226.5097
- Rent YoY
- ▲ 3.01%
- Metro
- Fayetteville, NC
- State GDP YoY
- ▲ 3.28%
- F500 in state
- 26
Industry mix (Fortune 500 HQ in NC)
| Industry | F500 HQs | Revenue |
|---|---|---|
| Financial Services | 2 | $213B |
|
||
| Retail | 2 | $95B |
|
||
| Industrial Conglomerate | 1 | $38B |
|
||
| Metals / Steel | 1 | $35B |
|
||
| Utilities | 1 | $30B |
|
||
| Industrial Machinery | 1 | $19B |
|
||
Price history
1 event — show timeline
- 2026-05-23 Listed $141,000 LPRMLS
Property tax history
+6.6%/yrLatest (2025): $1,916 · +45.1% YoY. Source: county tax records.
Cash-flow waterfall
monthlySold comps — $/sqft
last 12 mo · ≤1 miLoading sold comps…