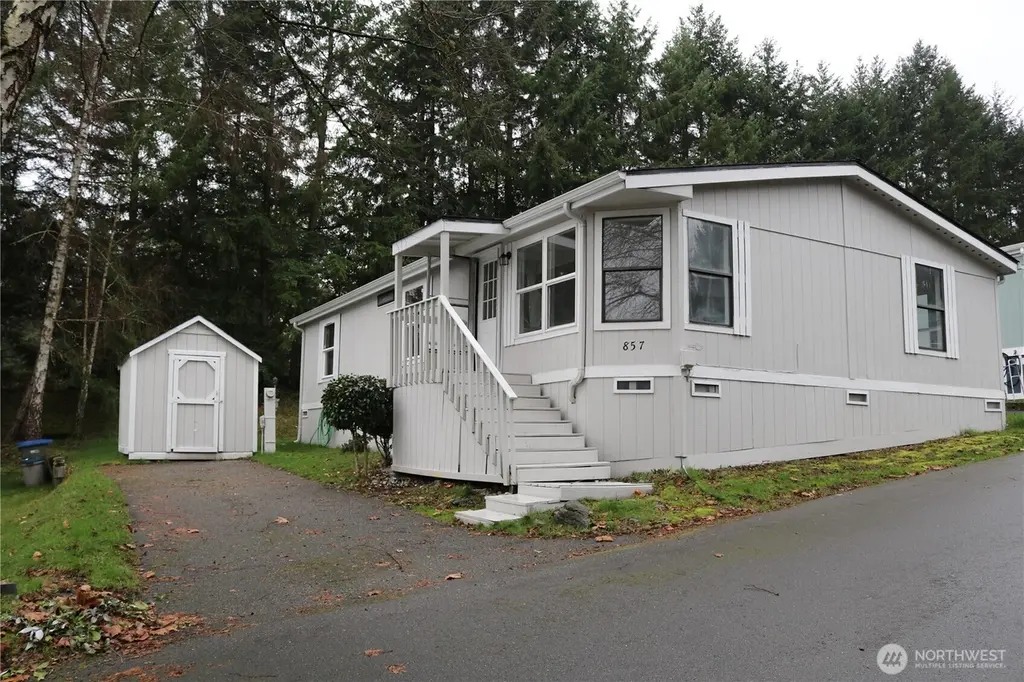
857 Mahogany Ln NW · Silverdale, WA
Flood risk 1/10 · Minimal
- FEMA flood zone
- X (unshaded)
- Chance of flooding over 30 yrs
- 0.0%
- Est. flood insurance / yr
- $507 – $1,088
Fire risk 1/10 · Minimal
- Est. fire insurance / yr
- $604 – $1,122
Heat risk 4/10 · Minor
- Hot days now (above 86°F)
- 7 days/yr
- Hot days in 30 yrs
- 16 days/yr
Wind risk 1/10 · Minimal
- Chance of severe wind over 30 yrs
- —
Air-quality risk 6/10 · Moderate
- Unhealthy air days now
- 8 days/yr
- Unhealthy air days in 30 yrs
- 8 days/yr
Risk factors via First Street. Map © Google.
Why this score? — see what drove the B+ grade
The composite is a weighted blend of 9 inputs, each scored 0–100. Each bar is that input's sub-score; the figure is the points it added to the 100-point composite (weight × sub-score).
- Cash flow +30.0/30.0
- ARV discount +15.0/15.0
- 1% rule +10.0/10.0
- DSCR +10.0/10.0
- Schools +5.5/10.0
- Livability +4.1/5.0
- Condition / age +2.8/5.0
- Rent growth +2.0/5.0
- Appreciation +0.0/10.0
$115,000
🖨 Deal sheet 📄 Offer letter ✓ Due diligence
Listing remarks
Welcome home to this well-maintained double-wide manufactured home in the desirable Madrona Ridge community – with no age restrictions! Offering 1,188 sq ft of comfortable living space, this 3-bedroom, 2-bath home features a spacious open living area perfect for everyday living and entertaining. Huge open livingroom - dining room space. Shed for extra storage. Conveniently located with an easy commute to military bases, hospitals, and shopping, Community allows 2 pets under 28 lbs each.
Key facts
- Extra storage
- Easy commute
- Open living area
Tags
Neighborhood map
What this means for you Summary
Snapshot
- This is a 3-bed/2.0-bath manufactured listed at $115k. Condition is rated average.
Deal economics
- At list price, monthly cash flow is $989 ($12k/yr) — positive.
- The deal already cash-flows at list — no discount required.
- Meets the 1% rule at list price ($2k rent vs $115k).
- Recommended offer: $105k (9.0% below list) — sets the bar for market timing.
- Cap rate 16.6% vs local median 2.7% in Silverdale — top-decile yield for the area; either an underpriced asset or a hidden risk that comps aren't pricing in. Stress-test before assuming the spread holds.
Location & tenants
- Location reads 82/100 on livability (#63 in WA, #1,155 nationally) — a professional / high-income tenant draw. Strengths: employment A+, housing A+, health & safety A+; Watch: amenities D-, cost of living F.
- Central Kitsap School District (urban): math 55% / reading 67% proficiency, ranked #49 of 291 in WA (top 17%) — acceptable for families but not a draw, mixed tenant base, ~2y average lease.
- Market conditions: Rents soft (-2.0%/yr); 120 active listings in the ZIP; 10 comparable units currently listed for rent nearby; rentals leasing fast (median 14d on market — plan ~1-2 weeks tenant-placement turnaround); high-income renter base; 1,294 units permitted in Kitsap County in 2024 (302 in 5+ unit buildings).
Forward outlook
- Local home prices are declining (-3.0%/yr); year-one equity from $795 of loan paydown is wiped out by about $3k of value loss. Plan a longer hold.
- Kitsap County population projected at +8% by 2050 — modest demand growth; plan on rents tracking national, not racing it.
- At projected returns (-3.0% appreciation + 0.0% rent growth), your $32k cash investment doubles in ~4 years — after that, you're playing with house money.
Negotiation context
- It's been on market 113 days — a 9% lower offer ($105k) is reasonable based on typical stale-listing flexibility.
- 3 sale attempts since 5y ago; this cycle's ask has dropped $15k (12%) from the opening price — seller is motivated, your offer sets the floor, not the list.
- Current owner paid $75k; list at $115k implies a 53% gain — meaningful room to come down on a strong offer.
Questions for the listing agent
- It's been on market 113 days. Have you received any prior offers? Is the seller open to a 9% concession, seller financing, or rate buy-down credit?
- Why hasn't it sold? Are there any deal-killer items the seller is aware of (foundation, flood, title, zoning, code violations)?
- Is there a deadline driving the sale (1031 exchange, divorce, estate, relocation)? That informs how much negotiation room exists.
- Schools are A-rated — typically a magnet for longer-tenancy family renters. What's the average tenant stay here, and is there a school-zone premium baked into asking?
- What's the average days-on-market for RENTAL listings here right now (not sales)? A rising rental-DOM trend means longer vacancies and softer asking-rent achievability than the comps imply.
- What's the recent tenant-quality profile in this submarket — average credit score on applications, eviction rate, late-payment / NSF rate, and stable-employment percentage? A property-management company in the area should have these aggregated.
- How much new for-sale + rental construction is in the pipeline within 1–3 miles? Heavy new supply typically softens prices + rents 12–24 months out; constrained supply supports both.
Investment metrics
- 1% rule
- 1.96% ✓
- Cap rate
- 16.62%
- Cash-on-cash
- 36.87%
- DSCR
- 2.64
- GRM
- 4.2
CMA / ARV
- ARV (median comp)
- $149,607
- List price
- $115,000
- Delta
- -23.13%
- Verdict
- UNDERPRICED
- Comps
- 5 within 1.0 mi
Show comp detail 9 sales within ~0.75 mi
| Address | Dist | Beds/Ba | Sqft | Sold | Price | $/sf | Match |
|---|---|---|---|---|---|---|---|
| 857 Mahogany Ln NW | 0.00mi | 3/2.0 | 1,188 (0%) | 0mo | $110,000 | $93 | 100 |
| 869 Mahogany Ln NW | 0.03mi | 3/2.0 | 1,188 (0%) | 8mo | $100,000 | $84 | 92 |
| 998 Mahogany Ln NW | 0.08mi | 3/2.0 | 1,120 (-6%) | 1mo | $115,000 | $103 | 86 |
| 922 NW Mahogany Ln | 0.04mi | 3/2.0 | 1,232 (+4%) | 8mo | $165,500 | $134 | 85 |
| 981 NW Mahogany Ln | 0.10mi | 3/2.0 | 1,080 (-9%) | 6mo | $149,000 | $138 | 75 |
| 817 Mahogany Ln NW | 0.08mi | 3/2.0 | 1,080 (-9%) | 16mo | $115,000 | $106 | 68 |
| 517 NW Silver Meadow Ln | 0.41mi | 2/2.0 (-1) | 1,120 (-6%) | 0mo | $160,000 | $143 | 66 |
| 543 Silver Glen Ln | 0.49mi | 2/2.0 (-1) | 1,136 (-4%) | 12mo | $163,000 | $143 | 55 |
| 562 NW Silver Glen Ln | 0.53mi | 2/2.0 (-1) | 1,232 (+4%) | 13mo | $155,000 | $126 | 54 |
Match score weights: distance 35% · size 25% · config 20% · recency 20%. Top-matched comps best support the ARV.
Projected returns pro-forma
-3.0% appreciation · 0.0% rent growth · sell at horizon
- IRR
- 29.3%
- Equity multiple
- 2.17×
- Total profit
- $37,787
- Equity at exit
- $17,147
- IRR
- 34.9%
- Equity multiple
- 3.75×
- Total profit
- $88,598
- Equity at exit
- $9,943
Cash invested: $32,200 (down + closing). Projections, not guarantees.
Landlord ↔ Tenant lean methodology
- Overall (STATE)
- 28 Tenant-Leaning
- State Washington
- 28 Tenant-Leaning · D+8
- County
- — inherits STATE
- City
- — inherits STATE
ZIP-level market 98383
- Home prices YoY
- -26.7%
- Rents YoY
- -2.0%
- Active inventory
- 120
- Price-to-rent
- 4.2×
Monthly cashflow live
- Estimated rent
- $2,258 high interval (Pro) →
- Mortgage (P&I)
- −$603
- Tax est. 1.5%
- −$144 /mo · $1,725/yr
- Insurance
- −$48
- HOA
- −$0
- Vacancy / Maint / Mgmt
- −$474
- Net cashflow
- $989
Break-even live
UW: 25.0% down · 7.5% · 30yr · 1.5% tax · 5.0% vac · 8.0% maint · 8.0% mgmt
Financing live
Cash to close
- Down payment
- $28,750
- Closing costs
- $3,450
- Reserves months
- —
- Total cash needed
- —
Loan-product check · same deal, 3 products live
Conventional
25% down · 7.5% · 30yr
- Down + closing
- —
- Monthly P&I
- —
- Monthly cashflow
- —
- DSCR
- —
- Eligible?
- —
Personal DTI + credit; lowest rate.
DSCR
20% down · 8.5% · 30yr
- Down + closing
- —
- Monthly P&I
- —
- Monthly cashflow
- —
- DSCR
- —
- Eligible?
- —
No personal income docs; deal must DSCR.
Hard money
10% down · 12.0% · 12mo
- Down + closing
- —
- Monthly P&I
- —
- Monthly cashflow
- —
- DSCR
- —
- Eligible?
- —
Short-term bridge; refi at stabilization.
Rent comps 10 comps
| Address | Beds | Baths | Sqft | Rent | $/sqft | DOM | Units | Dist |
|---|---|---|---|---|---|---|---|---|
| 1255 NW Mirage Ln Silverdale, WA | 1.0–3.0 | 1.0–2.0 | 865 | $2,400 | $2.77 | 13d | 12 | 0.20mi |
| 9896 Enterprise Ln NW Silverdale, WA | 1.0–2.0 | 1.0 | 823 | $1,995 | $2.42 | 43d | 2 | 0.61mi |
| 835 NW Huckle Dr Unit A Bremerton, WA | 2.0 | 1.5 | 1112 | $1,900 | $1.71 | 21d | 1 | 0.63mi |
| 9902 Cranberry Ln NW Silverdale, WA | 1.0–2.0 | 1.0 | 835 | $1,995 | $2.39 | 13d | 6 | 0.74mi |
| 11153 Shipside Ln NW Silverdale, WA | 1.0–2.0 | 1.0 | 743 | $1,989 | $2.68 | 13d | 19 | 0.74mi |
| 9860 Bushlac Ln NW Silverdale, WA | 1.0–2.0 | 1.0 | 716 | $1,978 | $2.76 | 13d | 5 | 0.80mi |
| 1413 NW Santa Fe Ln Silverdale, WA | 1.0–3.0 | 1.0–2.0 | 1002 | $2,484 | $2.48 | 13d | 15 | 0.94mi |
| 1206 NW Tahoe Ln Silverdale, WA | 1.0–3.0 | 1.0–2.0 | 1009 | $2,415 | $2.39 | 13d | 26 | 1.34mi |
| 12240 Daphne Ln NW Silverdale, WA | 1.0–3.0 | 1.0–2.0 | 812 | $2,328 | $2.87 | 13d | 7 | 1.43mi |
| 7720 Vineyards Ln NE Bremerton, WA | 1.0–3.0 | 1.0–2.0 | 840 | $2,325 | $2.77 | 13d | 11 | 1.45mi |
Listing history 17 events
-
2026-06-09status $115,000 Pending 113 DOM
-
2026-06-08days on market $115,000 Active 113 DOM
-
2026-06-07days on market $115,000 Active 112 DOM
-
2026-06-05days on market $115,000 Active 109 DOM
-
2026-06-02days on market $115,000 Active 107 DOM
-
2026-06-01days on market $115,000 Active 106 DOM
-
2026-05-31days on market $115,000 Active 105 DOM
-
2026-05-30days on market $115,000 Active 104 DOM
-
2026-04-28price $115,000
-
2026-03-03price $120,000
-
2026-02-15$130,000 Active
-
2021-06-21soldstatus $75,000 Closed
-
2021-05-30status Pending
-
2021-05-23price $75,000
-
2021-05-23status Active
-
2021-05-19status Pending
-
2021-04-30$70,000 Active
ⓘ Source: listings_history table (triggers on properties + properties_extension) + one-shot
backfill from property_details.listing_events for pre-trigger history.
Climate risk First Street
- Flood 1/10 Low FEMA zone X (unshaded) · 0% chance over 30 yrs
- Wildfire 1/10 Low
- Heat 4/10 Moderate 7 d/yr ≥86°F today · 16 d/yr by 30 yrs out
- Wind 1/10 Low
- Air quality 6/10 Major 8 unhealthy d/yr today · 8 by 30 yrs out
Nearby sold comps map
Loading sold comps map…
Walkable amenities ~0.75 mi
Loading nearby amenities…
Taxation est. · year 1
- Rental income
- $27,099
- − Mortgage interest
- −$6,442
- − Property taxes
- −$1,725
- − Insurance
- −$575
- − Repairs & maintenance
- −$2,168
- − Management
- −$2,168
- − Depreciation
- −$3,345
- Taxable income
- $10,676
- Est. tax owed @ 24.0%
- −$2,562
- After-tax cash flow
- $9,309/yr
For passive investors: Depreciation is non-cash, so a rental often shows a tax loss while cash-flowing — sheltering income. Rental losses are passive: they offset passive income freely, and up to $25,000/yr can offset ordinary (W-2) income if you actively participate and your MAGI is under $100k (phasing out to $0 by $150k); unused losses carry forward. On sale, claimed depreciation is recaptured at up to 25%, and gains may owe capital-gains tax (a 1031 exchange can defer both). Figures are a year-1 estimate at your 24.0% rate — not tax advice; consult a CPA.
Condition & rehab AI · 13 photos
This well-maintained double-wide manufactured home in the desirable Madrona Ridge community is in average condition with some minor repairs and maintenance needed. Fresh paint and new countertops can significantly improve its resale and rental value.
Repairs flagged
- Minor Paint — Some minor scuffing and wear visible on the walls and floors.
- Minor Countertops — Some minor scuffing visible on the kitchen and bathroom countertops.
Value-add opportunities
- Both Paint — Fresh paint can improve the overall appearance and value of the home.
- Both Countertops — New countertops can improve the functionality and value of the kitchen and bathrooms.
- Both Appliances — Upgrading to newer, more energy-efficient appliances can improve the home's value and appeal.
Renovation cost estimate screening
| Repair item | Severity | Est. cost |
|---|---|---|
| Paint · Some minor scuffing and wear visible on the walls and floors. | Minor | $500–3,000 |
| Countertops · Some minor scuffing visible on the kitchen and bathroom countertops. | Minor | $500–3,000 |
| Total estimated repair cost · 2 items | $1,000–6,000 |
Value-add ROI direction
- Both Paint — Fresh paint can improve the overall appearance and value of the home. ↑
- Both Countertops — New countertops can improve the functionality and value of the kitchen and bathrooms. ↑
- Both Appliances — Upgrading to newer, more energy-efficient appliances can improve the home's value and appeal. ↑
ⓘ Cost ranges are severity-bucket heuristics (US national rule-of-thumb). Get contractor quotes + a written scope before underwriting a rehab budget.
Schools (NCES district)
- District
- Central Kitsap School District
- NCES district ID
- 5301080
- Math proficiency
- 55% ▲ 1.00%
- Reading proficiency
- 67% ▬ 0.00%
- Median HH income
- $64,825
- Composite
- 54.87/100
- National rank
- #2813
- State rank
- #49 of 291 in WA
Livability — Silverdale
- Score
- 82/100
- State rank
- #63
- US rank
- #1155
Category grades
Schools grade is shown separately in the Schools card above.
Census & demographics
- Census place
- Silverdale, WA
- County
- Kitsap County · 243,099 people
- City population
- 21,604
- Metro
- Bremerton-Silverdale-Port Orchard, WA
- Population (ZIP)
- 21,604
- Household income
- $111,139
- Rent vs Own
- Severe rent burden
- 878.0
Population outlook (Kitsap County) Hauer SSP2
- Today (2025)
- 277,525 people
- By 2030
- 285,040 · +2.7%
- By 2040
- 294,957 · +6.3%
- By 2050
- 300,622 · +8.3%
- By 2075
- 315,580 · +13.7%
- By 2100
- 304,340 · +9.7%
Race, ethnicity, and origin ACS 2023
- Neighborhood character
- Predominantly White (69%)
- Race & ethnicity
- White 69% Two or more races 11% Asian 8% Hispanic / Latino 8% Black 6%
- Hispanic origin (detail)
- Mexican 7%
- Common ancestry
- Italian 6% Portuguese 5% Slovak 2%
- Foreign-born
- 9% · Canada, Vietnam
- Languages at home
- 90% English-only · Tagalog/Filipino 3% Spanish 3% Other Asian/Pacific 2%
Political lean MEDSL · Kitsap
- 2024 margin
- Strong D (+20.9) · D 58.8% · R 37.9% · Other 3.3%
- 2008→2024 swing
- +8.6pp toward D · 2008: 12.3pp · 2024: 20.9pp
- All cycles
- 2024: D+20.9 2020: D+18.1 2016: D+11.6 2012: D+11.1 2008: D+12.3
Not yet ingested
- Civics
- —
Market trends
- HPI YoY
- ▼ -124.87%
- Current HPI
- 343.44
- Rent YoY
- ▼ -1.99%
- Metro
- Bremerton-Silverdale-Port Orchard, WA
- State GDP YoY
- ▲ 4.65%
- F500 in state
- 22
Industry mix (Fortune 500 HQ in WA)
| Industry | F500 HQs | Revenue |
|---|---|---|
| Retail | 2 | $269B |
|
||
| Technology / Retail | 1 | $638B |
|
||
| Technology | 1 | $245B |
|
||
| Telecommunications | 1 | $38B |
|
||
| Food / Beverage | 1 | $36B |
|
||
| Automotive / Trucks | 1 | $34B |
|
||
Price history
+64.3% since first listed9 events — show timeline
- 2026-04-28 Price Changed $115,000 NWMLS as Distributed by MLS Grid
- 2026-03-03 Price Changed $120,000 NWMLS as Distributed by MLS Grid
- 2026-02-15 Listed $130,000 NWMLS as Distributed by MLS Grid
- 2021-06-21 Sold (MLS) $75,000 NWMLS as Distributed by MLS Grid
- 2021-05-30 Pending — NWMLS as Distributed by MLS Grid
- 2021-05-23 Price Changed $75,000 NWMLS as Distributed by MLS Grid
- 2021-05-23 Relisted — NWMLS as Distributed by MLS Grid
- 2021-05-19 Pending — NWMLS as Distributed by MLS Grid
- 2021-04-30 Listed $70,000 NWMLS as Distributed by MLS Grid
Cash-flow waterfall
monthlySold comps — $/sqft
last 12 mo · ≤1 miLoading sold comps…