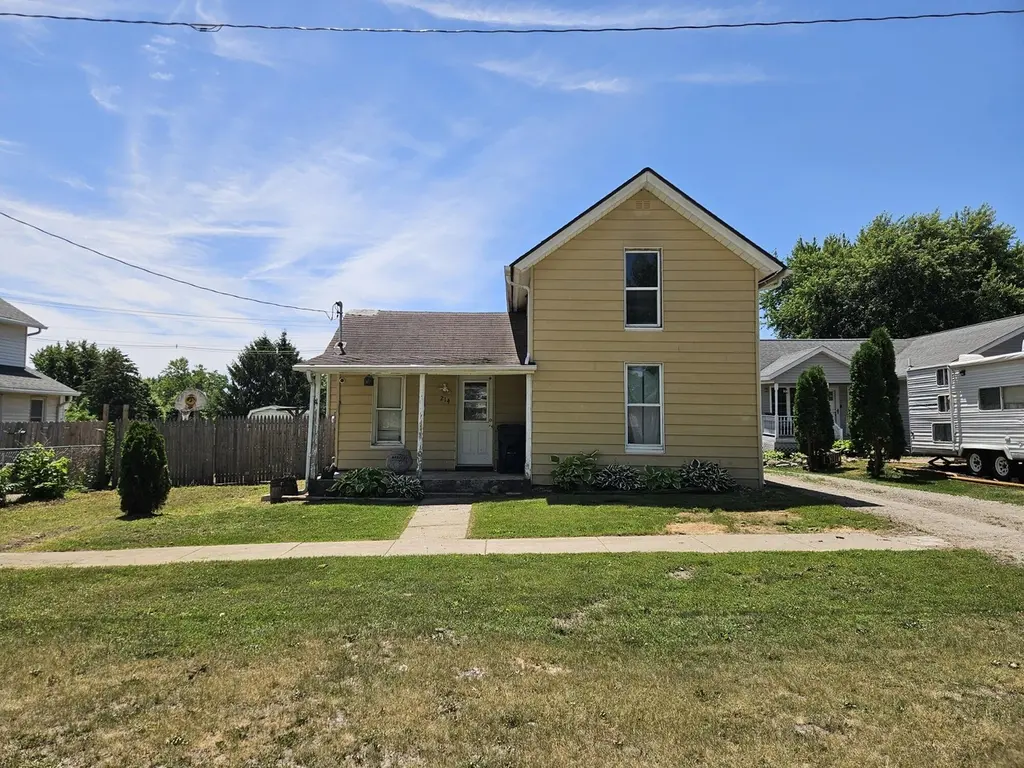
214 E 4th St · Wilton, IA
Flood risk 1/10 · Minimal
- FEMA flood zone
- X (unshaded)
- Chance of flooding over 30 yrs
- 0.0%
- Est. flood insurance / yr
- $473 – $860
Fire risk 4/10 · Minor
- Est. fire insurance / yr
- $902 – $1,676
Heat risk 3/10 · Minor
- Hot days now (above 104°F)
- 7 days/yr
- Hot days in 30 yrs
- 16 days/yr
Wind risk 2/10 · Minimal
- Chance of severe wind over 30 yrs
- —
Air-quality risk 2/10 · Minimal
- Unhealthy air days now
- 1 days/yr
- Unhealthy air days in 30 yrs
- 2 days/yr
Risk factors via First Street. Map © Google.
Why this score? — see what drove the B grade
The composite is a weighted blend of 9 inputs, each scored 0–100. Each bar is that input's sub-score; the figure is the points it added to the 100-point composite (weight × sub-score).
- Cash flow +30.0/30.0
- 1% rule +10.0/10.0
- DSCR +10.0/10.0
- ARV discount +7.5/15.0
- Schools +6.3/10.0
- Livability +4.0/5.0
- Rent growth +2.5/5.0
- Condition / age +2.5/5.0
- Appreciation +0.0/10.0
$45,000
🖨 Deal sheet 📄 Offer letter ✓ Due diligence
Listing remarks MLS
Great value for a fixer-upper. Newer garage has room for at least 4 cars and has floor drain and walls are insulated. BEING SOLD 'AS IS'
Key facts
- 8,276 sq ft lot
- 4 garage spots
- Built 1878
Property features AI
Exterior
- Parking: Detached 4-car garage
- Utilities: Public water; Public sewer
- Home design: One-and-a-half story single-family home; Residential property
- Construction: Aluminum siding
- Exterior features: 60' x 140' lot; Zoned residential
Interior
- Bedrooms: 2 main-level bedrooms
- Bathrooms: 1 main-level bathroom
- Interior features: Partial basement
Neighborhood map
What this means for you Summary
Snapshot
- This is a 4-bed/1.0-bath single-family listed at $45k.
Deal economics
- At list price, monthly cash flow is $534 ($6k/yr) — positive.
- The deal already cash-flows at list — no discount required.
- Meets the 1% rule at list price ($1k rent vs $45k).
Location & tenants
- Location reads 79/100 on livability (#101 in IA, #2,027 nationally) — a middle-class / working-renter tenant base. Strengths: crime A+, cost of living A+, housing A+; Watch: amenities F, commute F.
- Wilton Community School District (town): math 72% / reading 75% proficiency, ranked #80 of 289 in IA (top 28%) — strong family-tenant draw, lease renewals of 3-5y typical.
- Market conditions: 29 active listings in the ZIP; 65 units permitted in Muscatine County in 2024 (45 in 5+ unit buildings).
Forward outlook
- Local home prices are declining (-3.0%/yr); year-one equity from $311 of loan paydown is wiped out by about $1k of value loss. Plan a longer hold.
- Muscatine County population projected at +8% by 2050 — modest demand growth; plan on rents tracking national, not racing it.
- At projected returns (-3.0% appreciation + 3.0% rent growth), your $13k cash investment doubles in ~3 years — after that, you're playing with house money.
Negotiation context
- Only 5 days on market — expect competitive offers; lowballing is unlikely to land.
- 2 sale attempts since 13y ago with the ask held roughly flat each time — persistent listings suggest the price (not the market) is what's stuck; bring a comps-based counter.
Risks & watch-outs
- Watch-outs: property tax is 4.2% of price; built in 1878 — expect roof / HVAC / electrical / plumbing capex.
Questions for the listing agent
- Built in 1878 — when were the roof, HVAC, electrical panel, plumbing, and water heater last replaced?
- Property tax is high relative to price — has the assessment been appealed recently, and will the sale trigger a re-assessment?
- Is there a deadline driving the sale (1031 exchange, divorce, estate, relocation)? That informs how much negotiation room exists.
- Schools are A-rated — typically a magnet for longer-tenancy family renters. What's the average tenant stay here, and is there a school-zone premium baked into asking?
- What's the average days-on-market for RENTAL listings here right now (not sales)? A rising rental-DOM trend means longer vacancies and softer asking-rent achievability than the comps imply.
- What's the recent tenant-quality profile in this submarket — average credit score on applications, eviction rate, late-payment / NSF rate, and stable-employment percentage? A property-management company in the area should have these aggregated.
- How much new for-sale + rental construction is in the pipeline within 1–3 miles? Heavy new supply typically softens prices + rents 12–24 months out; constrained supply supports both.
Investment metrics
- 1% rule
- 2.66% ✓
- Cap rate
- 20.54%
- Cash-on-cash
- 50.89%
- DSCR
- 3.26
- GRM
- 3.1
CMA / ARV
- ARV (on-the-fly)
- $175,812
- Comps found
- 5
Show comp detail 5 sales within ~0.75 mi
| Address | Dist | Beds/Ba | Sqft | Sold | Price | $/sf | Match |
|---|---|---|---|---|---|---|---|
| 915 East St | 0.41mi | 3/1.0 (-1) | 1,272 (-0%) | 12mo | $194,500 | $153 | 66 |
| 612 Maurer St | 0.22mi | 3/1.0 (-1) | 1,290 (+1%) | 23mo | $150,000 | $116 | 63 |
| 113 E 2nd St | 0.15mi | 3/1.0 (-1) | 1,188 (-7%) | 20mo | $164,000 | $138 | 60 |
| 915 Locust St | 0.41mi | 3/2.0 (-1) | 1,215 (-5%) | 14mo | $205,000 | $169 | 52 |
| 204 Cypress St | 0.23mi | 3/2.0 (-1) | 1,145 (-10%) | 17mo | $150,000 | $131 | 50 |
Match score weights: distance 35% · size 25% · config 20% · recency 20%. Top-matched comps best support the ARV.
Projected returns pro-forma
-3.0% appreciation · 3.0% rent growth · sell at horizon
- IRR
- 48.8%
- Equity multiple
- 3.13×
- Total profit
- $26,819
- Equity at exit
- $6,710
- IRR
- 54.4%
- Equity multiple
- 6.36×
- Total profit
- $67,499
- Equity at exit
- $3,891
Cash invested: $12,600 (down + closing). Projections, not guarantees.
Landlord ↔ Tenant lean methodology
- Overall (STATE)
- 83 Strongly Landlord-Friendly
- State Iowa
- 83 Strongly Landlord-Friendly · R+6
- County
- — inherits STATE
- City
- — inherits STATE
ZIP-level market 52778
- Home prices YoY
- -31.8%
- Active inventory
- 29
- Price-to-rent
- 3.1×
Monthly cashflow live
- Estimated rent
- $1,198 medium interval (Pro) →
- Mortgage (P&I)
- −$236
- Tax from tax record
- −$157 /mo · $1,884/yr
- Insurance
- −$19
- HOA
- −$0
- Vacancy / Maint / Mgmt
- −$251
- Net cashflow
- $534
Break-even live
UW: 25.0% down · 7.5% · 30yr · 1.5% tax · 5.0% vac · 8.0% maint · 8.0% mgmt
Financing live
Cash to close
- Down payment
- $11,250
- Closing costs
- $1,350
- Reserves months
- —
- Total cash needed
- —
Loan-product check · same deal, 3 products live
Conventional
25% down · 7.5% · 30yr
- Down + closing
- —
- Monthly P&I
- —
- Monthly cashflow
- —
- DSCR
- —
- Eligible?
- —
Personal DTI + credit; lowest rate.
DSCR
20% down · 8.5% · 30yr
- Down + closing
- —
- Monthly P&I
- —
- Monthly cashflow
- —
- DSCR
- —
- Eligible?
- —
No personal income docs; deal must DSCR.
Hard money
10% down · 12.0% · 12mo
- Down + closing
- —
- Monthly P&I
- —
- Monthly cashflow
- —
- DSCR
- —
- Eligible?
- —
Short-term bridge; refi at stabilization.
Listing history 5 events
-
2026-06-09status $45,000 Pending 5 DOM
-
2026-06-08days on market $45,000 Active 5 DOM
-
2026-06-07days on market $45,000 Active 4 DOM
-
2026-06-04remarks 170-char remark
-
2026-06-04$45,000 Active 1 DOM
ⓘ Source: listings_history table (triggers on properties + properties_extension) + one-shot
backfill from property_details.listing_events for pre-trigger history.
Tax reassessment forecast IA · Partial reset (capped growth)
- Current annual tax
- $1,884 · $157/mo
- Projected year-2 tax
- $1,884 · $157/mo
- Expected delta
- $0/yr ($0/mo · 0.0%)
ⓘ Screening estimate from a state-policy table — verify with the county assessor before closing.
Climate risk First Street
- Flood 1/10 Low FEMA zone X (unshaded) · 0% chance over 30 yrs
- Wildfire 4/10 Moderate
- Heat 3/10 Moderate 7 d/yr ≥104°F today · 16 d/yr by 30 yrs out
- Wind 2/10 Low
- Air quality 2/10 Low 1 unhealthy d/yr today · 2 by 30 yrs out
Nearby sold comps map
Loading sold comps map…
Walkable amenities ~0.75 mi
Loading nearby amenities…
Taxation est. · year 1
- Rental income
- $14,370
- − Mortgage interest
- −$2,521
- − Property taxes
- −$1,884
- − Insurance
- −$225
- − Repairs & maintenance
- −$1,150
- − Management
- −$1,150
- − Depreciation
- −$1,309
- Taxable income
- $6,132
- Est. tax owed @ 24.0%
- −$1,472
- After-tax cash flow
- $4,940/yr
For passive investors: Depreciation is non-cash, so a rental often shows a tax loss while cash-flowing — sheltering income. Rental losses are passive: they offset passive income freely, and up to $25,000/yr can offset ordinary (W-2) income if you actively participate and your MAGI is under $100k (phasing out to $0 by $150k); unused losses carry forward. On sale, claimed depreciation is recaptured at up to 25%, and gains may owe capital-gains tax (a 1031 exchange can defer both). Figures are a year-1 estimate at your 24.0% rate — not tax advice; consult a CPA.
Schools (NCES district)
- District
- Wilton Community School District
- NCES district ID
- 1931800
- Math proficiency
- 72% ▲ 1.00%
- Reading proficiency
- 75% ▲ 4.00%
- Median HH income
- $58,073
- Composite
- 63.04/100
- National rank
- #648
- State rank
- #80 of 289 in IA
Livability — Wilton
- Score
- 79/100
- State rank
- #101
- US rank
- #2027
Category grades
Schools grade is shown separately in the Schools card above.
Census & demographics
- Census place
- Wilton, IA
- Population (ZIP)
- 3,677
Population outlook (Muscatine County) Hauer SSP2
- Today (2025)
- 44,820 people
- By 2030
- 45,461 · +1.4%
- By 2040
- 46,765 · +4.3%
- By 2050
- 48,609 · +8.5%
- By 2075
- 56,014 · +25.0%
- By 2100
- 63,513 · +41.7%
Race, ethnicity, and origin ACS 2023
- Neighborhood character
- Predominantly White (91%)
- Race & ethnicity
- White 91% Hispanic / Latino 5% Two or more races 3% Black 1%
- Hispanic origin (detail)
- Mexican 5%
- Common ancestry
- Lithuanian 2% Italian 1% Iranian 1%
- Foreign-born
- 1% · China, Canada
- Languages at home
- 98% English-only · Spanish 1% Russian/Polish/Slavic 1% Arabic 1%
Political lean MEDSL · Muscatine
- 2024 margin
- R (+14.9) · D 41.7% · R 56.6% · Other 1.7%
- 2008→2024 swing
- -30.6pp toward R · 2008: 15.7pp · 2024: -14.9pp
- All cycles
- 2024: R+14.9 2020: R+7.0 2016: R+6.6 2012: D+15.5 2008: D+15.7
Not yet ingested
- Civics
- —
Market trends
- HPI YoY
- ▼ -93.07%
- Current HPI
- 199.9894
- Rent YoY
- —
- Metro
- —
- State GDP YoY
- ▲ 2.48%
- F500 in state
- 4
Industry mix (Fortune 500 HQ in IA)
| Industry | F500 HQs | Revenue |
|---|---|---|
| Financial Services | 1 | $16B |
|
||
| Retail / Convenience | 1 | $15B |
|
||
Price history
-10.0% since first listed3 events — show timeline
- 2026-06-03 Listed $45,000 Muscatine BOR
- 2013-05-02 Listed $90,000 Muscatine BOR
- 2008-06-25 Sold (MLS) $50,000 Muscatine BOR
Property tax history
-0.1%/yrLatest (2025): $1,884 · +5.4% YoY. Source: county tax records.
Cash-flow waterfall
monthlySold comps — $/sqft
last 12 mo · ≤1 miLoading sold comps…