 🌊 Lakefront
429 Bow Lake Rd · Northwood, NH
Flood risk 1/10 · Minimal
- FEMA flood zone
- X (unshaded)
- Chance of flooding over 30 yrs
- 0.0%
- Est. flood insurance / yr
- $507 – $1,088
Fire risk 2/10 · Minimal
- Est. fire insurance / yr
- $507 – $941
Heat risk 3/10 · Minor
- Hot days now (above 93°F)
- 7 days/yr
- Hot days in 30 yrs
- 15 days/yr
Wind risk 4/10 · Minor
- Chance of severe wind over 30 yrs
- 18.0%
Air-quality risk 2/10 · Minimal
- Unhealthy air days now
- 1 days/yr
- Unhealthy air days in 30 yrs
- 2 days/yr
Risk factors via First Street. Map © Google.
Why this score? — see what drove the D- grade
The composite is a weighted blend of 9 inputs, each scored 0–100. Each bar is that input's sub-score; the figure is the points it added to the 100-point composite (weight × sub-score).
- Cash flow +12.9/30.0
- ARV discount +7.5/15.0
- Schools +5.1/10.0
- DSCR +3.9/10.0
- 1% rule +3.0/10.0
- Rent growth +2.5/5.0
- Livability +2.5/5.0
- Condition / age +2.5/5.0
- Appreciation +0.0/10.0
$434,900
🖨 Deal sheet 📄 Offer letter ✓ Due diligence
Listing remarks MLS
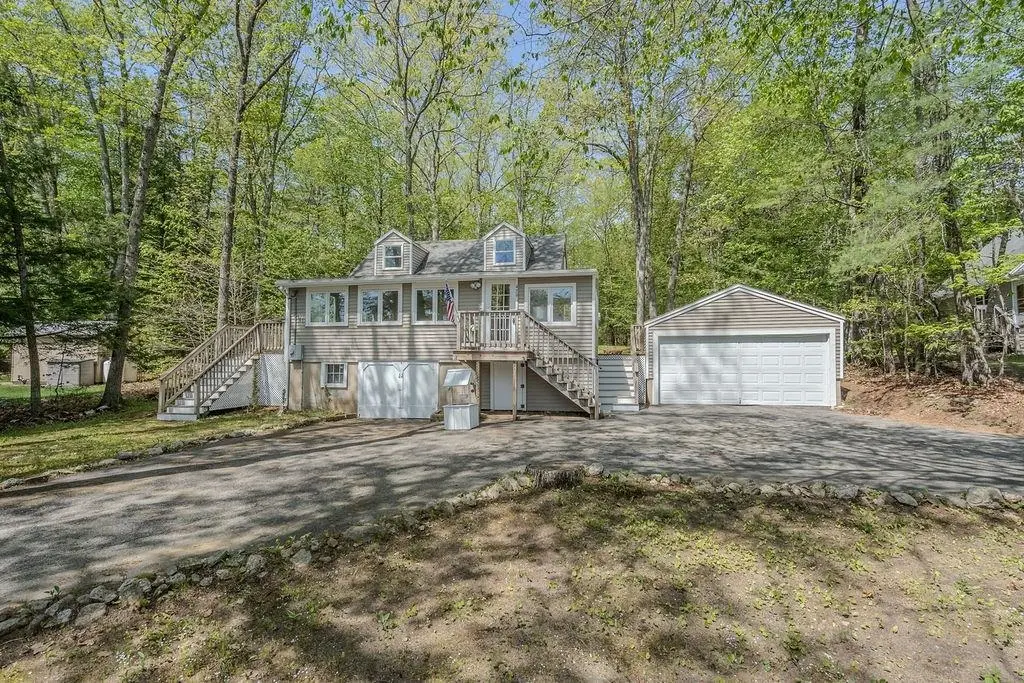
TRIPLE AAA 3 bedroom home AFFORDABLE, A stones throw from beautiful Bow Lakes's Mary Waldron Beach. All new roof, vinyl siding, carpets, appliances. Has wood stove in living room and gas wall burner. 2 car garage, good storage, landscaped lot, circular drive with plenty of parking, deck with views of Bow Lake, move in ready. Wonderful place to live, and enjoy all year round.
Key facts
- Double lot
- Updated kitchen
- Lakeview escape
Tags
Property features AI
Finance
- Other: Property disclosure available
Exterior
- Parking: 2-car garage
- Utilities: Drilled private well; Private septic system with concrete leach field; 200 amp electric service with circuit breakers (Eversource); Propane fuel on site (Rymes/Superior Propane); High-speed internet available; Cable service (Breezeline); On-site gas
- Home design: Cape-style home; Existing construction; Tan exterior color; Not waterfront but has lake views and lake access; Year built 1950
- Construction: Wood frame with vinyl siding; Asphalt shingle roof; Concrete foundation
- Exterior features: Beach access to Bow Lake (cross a street to access; municipal residents only; other access details); Lake access; Paved driveway
Interior
- Kitchen: Refrigerator; Electric stove
- Flooring: Carpet; Tile
- Bathrooms: One full bathroom
- Heating & cooling: Propane heating; Baseboard heating; Electric heating
- Interior features: Six total rooms; Unfinished full walkout basement with exterior access
- Laundry & utility: Water heater
Neighborhood map
What this means for you Summary
Snapshot
- This is a 3-bed/1.0-bath other listed at $435k.
Deal economics
- At list price, monthly cash flow is $-33 ($-399/yr) — negative.
- To cash-flow at today's rent, offer at most $429k (1.4% below list).
- To meet the 1% rule (rent ≥ 1% of price), the offer needs to be $350k (19.5% below list).
- Recommended offer: $350k (19.5% below list) — sets the bar for 1% rule.
Location & tenants
- Location reads: area grade D — affects rentability + tenant quality, not the cash-flow math above.
- Northwood School District (rural): math 51% / reading 60% proficiency, ranked #65 of 171 in NH (top 38%) — acceptable for families but not a draw, mixed tenant base, ~2y average lease; only 15% free/reduced lunch — higher-income household profile.
- Zoned schools: Northwood Elementary School (math 42% / reading 52%, grade D-, #114 of 263 statewide, top 46%, 388 students, 16% FRL) — zoned schools at 16% FRL track the district average.
- Market conditions: 42 active listings in the ZIP; 1 comparable units currently listed for rent nearby; 1,276 units permitted in Rockingham County in 2024 (593 in 5+ unit buildings).
Forward outlook
- Local home prices are declining (-3.0%/yr); year-one equity from $3k of loan paydown is wiped out by about $13k of value loss. Plan a longer hold.
Negotiation context
- It's been on market 26 days — a 2% lower offer ($428k) is reasonable based on typical stale-listing flexibility.
- 4 sale attempts since 26y ago; this cycle's ask has dropped $55k (11%) from the opening price — seller is motivated, your offer sets the floor, not the list.
- Current owner paid $135k; list at $435k implies a 222% gain — meaningful room to come down on a strong offer.
Risks & watch-outs
- Watch-outs: built in 1950 — expect roof / HVAC / electrical / plumbing capex.
Questions for the listing agent
- What do current leases actually rent for vs. the listed asking? Can we see a recent rent roll and the last 12 months of T-12 income?
- Built in 1950 — when were the roof, HVAC, electrical panel, plumbing, and water heater last replaced?
- Is there a deadline driving the sale (1031 exchange, divorce, estate, relocation)? That informs how much negotiation room exists.
- The area grade is low — what's the realistic commute time and amenity access for the typical tenant pool here? Any planned neighborhood developments (good or bad) we should know about?
- This sits on a lake — are riparian / water-frontage rights deeded with the parcel? Any dock permits, shoreline easements, or HOA water-use restrictions?
- What's the documented flood / surge / shoreline-erosion history here (FEMA AND non-FEMA — e.g., storm surge, creek backup, septic-field saturation)?
- Any water-quality or seasonal algae-bloom issues that affect tenant satisfaction or short-term-rental demand?
- What's the average days-on-market for RENTAL listings here right now (not sales)? A rising rental-DOM trend means longer vacancies and softer asking-rent achievability than the comps imply.
- What's the recent tenant-quality profile in this submarket — average credit score on applications, eviction rate, late-payment / NSF rate, and stable-employment percentage? A property-management company in the area should have these aggregated.
- How much new for-sale + rental construction is in the pipeline within 1–3 miles? Heavy new supply typically softens prices + rents 12–24 months out; constrained supply supports both.
Investment metrics
- 1% rule
- 0.80% ✗
- Cap rate
- 6.20%
- Cash-on-cash
- -0.33%
- DSCR
- 0.99
- GRM
- 10.4
CMA / ARV
No comps found within radius.
Projected returns pro-forma
-3.0% appreciation · 3.0% rent growth · sell at horizon
- IRR
- -16.9%
- Equity multiple
- 0.40×
- Total profit
- $-72,667
- Equity at exit
- $64,845
- IRR
- -8.8%
- Equity multiple
- 0.46×
- Total profit
- $-66,310
- Equity at exit
- $37,602
Cash invested: $121,772 (down + closing). Projections, not guarantees.
Landlord ↔ Tenant lean methodology
- Overall (STATE)
- 56 Moderately Landlord-Leaning
- State New Hampshire
- 56 Moderately Landlord-Leaning · D+1
- County
- — inherits STATE
- City
- — inherits STATE
ZIP-level market 03261
- Home prices YoY
- -21.7%
- Active inventory
- 42
- Price-to-rent
- 10.4×
Monthly cashflow live
- Estimated rent
- $3,500 medium interval (Pro) →
- Mortgage (P&I)
- −$2,281
- Tax from tax record
- −$336 /mo · $4,037/yr
- Insurance
- −$181
- HOA
- −$0
- Vacancy / Maint / Mgmt
- −$735
- Net cashflow
- $-33
Break-even live
UW: 25.0% down · 7.5% · 30yr · 1.5% tax · 5.0% vac · 8.0% maint · 8.0% mgmt
Financing live
Cash to close
- Down payment
- $108,725
- Closing costs
- $13,047
- Reserves months
- —
- Total cash needed
- —
Loan-product check · same deal, 3 products live
Conventional
25% down · 7.5% · 30yr
- Down + closing
- —
- Monthly P&I
- —
- Monthly cashflow
- —
- DSCR
- —
- Eligible?
- —
Personal DTI + credit; lowest rate.
DSCR
20% down · 8.5% · 30yr
- Down + closing
- —
- Monthly P&I
- —
- Monthly cashflow
- —
- DSCR
- —
- Eligible?
- —
No personal income docs; deal must DSCR.
Hard money
10% down · 12.0% · 12mo
- Down + closing
- —
- Monthly P&I
- —
- Monthly cashflow
- —
- DSCR
- —
- Eligible?
- —
Short-term bridge; refi at stabilization.
Rent comps 1 comps
| Address | Beds | Baths | Sqft | Rent | $/sqft | DOM | Units | Dist |
|---|---|---|---|---|---|---|---|---|
| 438 Bow Lake Rd Northwood, NH | 3.0 | 2.0 | 936 | $3,500 | $3.74 | 43d | 1 | 0.04mi |
Listing history 25 events
-
2026-06-18days on market $434,900 Active 26 DOM
-
2026-06-17days on market $434,900 Active 25 DOM
-
2026-06-16days on market $434,900 Active 24 DOM
-
2026-06-15days on market $434,900 Active 23 DOM
-
2026-06-13days on market $434,900 Active 21 DOM
-
2026-06-12remarks 691-char remark
-
2026-06-12pricedays on market $434,900 Active 20 DOM
-
2026-06-09days on market $459,900 Active 17 DOM
-
2026-06-08days on market $459,900 Active 16 DOM
-
2026-06-07days on market $459,900 Active 15 DOM
-
2026-06-05days on market $459,900 Active 13 DOM
-
2026-06-04days on market $459,900 Active 11 DOM
-
2026-06-03price $459,900 Active 10 DOM
-
2026-06-02days on market $489,900 Active 10 DOM
-
2026-06-01days on market $489,900 Active 9 DOM
-
2026-05-31days on market $489,900 Active 8 DOM
-
2026-05-23$489,900 Active
-
2026-05-20historical $489,900
-
2026-05-20$489,900 Active
-
2012-12-04soldstatus $135,000
-
2012-11-30soldstatus $135,000 377-char remark
Show marketing remark (377 chars)
TRIPLE AAA 3 bedroom home AFFORDABLE, A stones throw from beautiful Bow Lakes's Mary Waldron Beach. All new roof, vinyl siding, carpets, appliances. Has wood stove in living room and gas wall burner. 2 car garage, good storage, landscaped lot, circular drive with plenty of parking, deck with views of Bow Lake, move in ready. Wonderful place to live, and enjoy all year round.
-
2012-09-29$159,000 377-char remark
Show marketing remark (377 chars)
TRIPLE AAA 3 bedroom home AFFORDABLE, A stones throw from beautiful Bow Lakes's Mary Waldron Beach. All new roof, vinyl siding, carpets, appliances. Has wood stove in living room and gas wall burner. 2 car garage, good storage, landscaped lot, circular drive with plenty of parking, deck with views of Bow Lake, move in ready. Wonderful place to live, and enjoy all year round.
-
2000-12-11soldstatus $108,000 176-char remark
Show marketing remark (176 chars)
GREAT GETAWAY WITH WATER VIEWS AND TOWN BEACH IN WALKING DISTANCE. 3 BEDROOM SEPTIC SYSTEM INSTALLED 2 YEARS AGO, DRILLED WELL, ENCLOSED PORCH AND GARAGE. NO SELLER CONCESSIONS
-
2000-11-04historical 176-char remark
Show marketing remark (176 chars)
GREAT GETAWAY WITH WATER VIEWS AND TOWN BEACH IN WALKING DISTANCE. 3 BEDROOM SEPTIC SYSTEM INSTALLED 2 YEARS AGO, DRILLED WELL, ENCLOSED PORCH AND GARAGE. NO SELLER CONCESSIONS
-
2000-09-27$115,000 176-char remark
Show marketing remark (176 chars)
GREAT GETAWAY WITH WATER VIEWS AND TOWN BEACH IN WALKING DISTANCE. 3 BEDROOM SEPTIC SYSTEM INSTALLED 2 YEARS AGO, DRILLED WELL, ENCLOSED PORCH AND GARAGE. NO SELLER CONCESSIONS
ⓘ Source: listings_history table (triggers on properties + properties_extension) + one-shot
backfill from property_details.listing_events for pre-trigger history.
Tax reassessment forecast NH · Partial reset (capped growth)
- Current annual tax
- $4,037 · $336/mo
- Projected year-2 tax
- $6,759 · $563/mo
- Expected delta
- +$2,722/yr (+$227/mo · 67.4%)
ⓘ Screening estimate from a state-policy table — verify with the county assessor before closing.
Climate risk First Street
- Flood 1/10 Low FEMA zone X (unshaded) · 0% chance over 30 yrs
- Wildfire 2/10 Low
- Heat 3/10 Moderate 7 d/yr ≥93°F today · 15 d/yr by 30 yrs out
- Wind 4/10 Moderate 18% chance of damaging wind over 30 yrs
- Air quality 2/10 Low 1 unhealthy d/yr today · 2 by 30 yrs out
Nearby sold comps map
Loading sold comps map…
Walkable amenities ~0.75 mi
Loading nearby amenities…
Taxation est. · year 1
- Rental income
- $42,000
- − Mortgage interest
- −$24,361
- − Property taxes
- −$4,037
- − Insurance
- −$2,174
- − Repairs & maintenance
- −$3,360
- − Management
- −$3,360
- − Depreciation
- −$12,652
- Taxable loss
- −$7,944
- Est. tax savings @ 24.0%
- +$1,907
- After-tax cash flow
- $1,507/yr
For passive investors: Depreciation is non-cash, so a rental often shows a tax loss while cash-flowing — sheltering income. Rental losses are passive: they offset passive income freely, and up to $25,000/yr can offset ordinary (W-2) income if you actively participate and your MAGI is under $100k (phasing out to $0 by $150k); unused losses carry forward. On sale, claimed depreciation is recaptured at up to 25%, and gains may owe capital-gains tax (a 1031 exchange can defer both). Figures are a year-1 estimate at your 24.0% rate — not tax advice; consult a CPA.
Schools (NCES district)
- District
- Northwood School District
- NCES district ID
- 3305430
- Math proficiency
- 51% ▲ 3.00%
- Reading proficiency
- 60% ▲ 12.00%
- Median HH income
- $73,090
- Composite
- 51.32/100
- National rank
- #3718
- State rank
- #65 of 171 in NH
Livability — Northwood
No livability data for this city. (Only ~50 U.S. cities are tracked.)
Census & demographics
- Population (ZIP)
- 4,653
Population outlook (Rockingham County) Hauer SSP2
- Today (2025)
- 316,118 people
- By 2030
- 320,929 · +1.5%
- By 2040
- 323,358 · +2.3%
- By 2050
- 314,977 · -0.4%
- By 2075
- 297,686 · -5.8%
- By 2100
- 256,363 · -18.9%
Race, ethnicity, and origin ACS 2023
- Neighborhood character
- Predominantly White (89%)
- Race & ethnicity
- White 89% Two or more races 6% Hispanic / Latino 5% Black 2%
- Hispanic origin (detail)
- Mexican 4%
- Common ancestry
- Lithuanian 16% Romanian 6% Portuguese 4%
- Foreign-born
- 2% · China
- Languages at home
- 98% English-only · German/W. Germanic 1% Chinese 1%
Political lean MEDSL · Rockingham
- 2024 margin
- Toss-up / Even · D 48.3% · R 50.8%
- 2008→2024 swing
- -3.5pp toward R · 2008: 1.1pp · 2024: -2.4pp
- All cycles
- 2024: R+2.4 2020: D+2.1 2016: R+5.8 2012: R+4.5 2008: D+1.1
Not yet ingested
- Civics
- —
Market trends
- HPI YoY
- ▼ -71.35%
- Current HPI
- 258.0711
- Rent YoY
- —
- Metro
- —
- State GDP YoY
- —
- F500 in state
- 0
Price history
+326.0% since first listed9 events — show timeline
- 2026-05-23 Listed $489,900 PrimeMLS
- 2026-05-20 Coming Soon $489,900 PrimeMLS
- 2026-05-20 Listed $489,900 PrimeMLS
- 2012-12-04 Sold (Public Records) $135,000 Public Records
- 2012-11-30 Sold (MLS) $135,000 PrimeMLS
- 2012-09-29 Listed $159,000 PrimeMLS
- 2000-12-11 Sold (MLS) $108,000 PrimeMLS
- 2000-11-04 Delisted — PrimeMLS
- 2000-09-27 Listed $115,000 PrimeMLS
Property tax history
+2.2%/yrLatest (2024): $4,037 · +12.8% YoY. Source: county tax records.
Cash-flow waterfall
monthlySold comps — $/sqft
last 12 mo · ≤1 miLoading sold comps…