 🏗️ New Construction
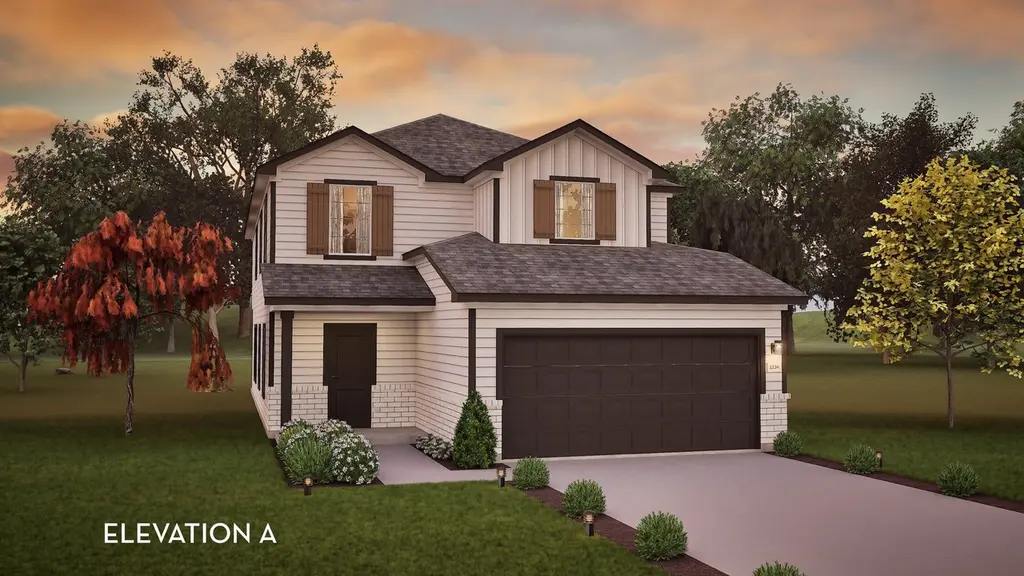
Willow Plan · Conroe, TX
Flood risk No data
- FEMA flood zone
- —
- Chance of flooding over 30 yrs
- —
- Est. flood insurance / yr
- —
Fire risk No data
- Est. fire insurance / yr
- —
Heat risk No data
- Hot days now (above threshold)
- —
- Hot days in 30 yrs
- —
Wind risk No data
- Chance of severe wind over 30 yrs
- —
Air-quality risk No data
- Unhealthy air days now
- —
- Unhealthy air days in 30 yrs
- —
Risk factors via First Street. Map © Google.
Why this score? — see what drove the D grade
The composite is a weighted blend of 9 inputs, each scored 0–100. Each bar is that input's sub-score; the figure is the points it added to the 100-point composite (weight × sub-score).
- Cash flow +11.6/30.0
- ARV discount +7.5/15.0
- Condition / age +4.0/5.0
- Livability +3.7/5.0
- 1% rule +3.4/10.0
- DSCR +3.4/10.0
- Schools +3.2/10.0
- Rent growth +2.7/5.0
- Appreciation +0.9/10.0
$269,990
🖨 Deal sheet 📄 Offer letter ✓ Due diligence
Listing remarks
The stylish Willow home offers a fresh take on modern living with its thoughtfully designed two-story layout. With its 5 bedrooms and 3 bathrooms, this floor plan is ideal for growing families, first-time buyers, or anyone seeking a spacious and cozy new space. With its inviting design and open concept living areas, the Willow plan blends comfort and functionality in a way that feels effortlessly livable. Walking into the home through the front porch, you're instantly greeted by the foyer that leads straight into the large family room and front-facing two-car garage. If you and your family need a larger space for extra storage or another vehicle, there is an option to add a half-car garage.
Key facts
- Large family room
- Front porch
- Natural light
Tags
Property features AI
Finance
- Financial info: List price $269,990; New construction plan inventory
Exterior
- Parking: 2 total parking spaces; 2-car garage
- Home design: Single-family plan home (Willow); Located in Willis, TX
- Exterior features: Living area approximately 2,412
Interior
- Bedrooms: 5 bedrooms
- Bathrooms: 3 full baths and 1 half bath
- Interior features: Plan home (Willow)
Neighborhood map
What this means for you Summary
Snapshot
- This is a 5-bed/3.5-bath single-family listed at $270k. Condition is rated good.
Deal economics
- At list price, monthly cash flow is $-86 ($-1k/yr) — negative.
- To cash-flow at today's rent, offer at most $265k (2.0% below list).
- To meet the 1% rule (rent ≥ 1% of price), the offer needs to be $231k (14.3% below list).
- Recommended offer: $231k (14.3% below list) — sets the bar for 1% rule.
- Cap rate 5.9% vs local median 3.1% in Conroe — top-decile yield for the area; either an underpriced asset or a hidden risk that comps aren't pricing in. Stress-test before assuming the spread holds.
Location & tenants
- Location reads 74/100 on livability (#169 in TX, #4,447 nationally) — a middle-class / working-renter tenant base. Strengths: cost of living A+, housing A+, amenities B; Watch: schools D+, commute F, health & safety F.
- Willis ISD (rural): math 33% / reading 40% proficiency, ranked #458 of 826 in TX (top 55%) — families likely to look elsewhere, expect single-tenant / working-renter base with shorter leases.
- Market conditions: Rents flat; 710 active listings in the ZIP; 1 comparable units currently listed for rent nearby; 13,259 units permitted in Montgomery County in 2024 (1,402 in 5+ unit buildings).
- This rent runs 39% of the median local income ($71k/yr) — at the standard rent-burdened threshold; future hikes will face affordability resistance.
Forward outlook
- Local home prices are declining (-3.0%/yr); year-one equity from $2k of loan paydown is wiped out by about $8k of value loss. Plan a longer hold.
- Montgomery County population projected at +65% by 2050 — long-run rental-demand tailwind backs the buy-and-hold thesis.
Negotiation context
- It's been on market 40 days — a 3% lower offer ($262k) is reasonable based on typical stale-listing flexibility.
Questions for the listing agent
- What do current leases actually rent for vs. the listed asking? Can we see a recent rent roll and the last 12 months of T-12 income?
- It's been on market 40 days. Have you received any prior offers? Is the seller open to a 14% concession, seller financing, or rate buy-down credit?
- Is there a deadline driving the sale (1031 exchange, divorce, estate, relocation)? That informs how much negotiation room exists.
- Schools are D-rated, which usually means shorter tenancies and higher turnover. Who's the typical renter profile here, and what's been the actual vacancy rate?
- The area grade is low — what's the realistic commute time and amenity access for the typical tenant pool here? Any planned neighborhood developments (good or bad) we should know about?
- What's the average days-on-market for RENTAL listings here right now (not sales)? A rising rental-DOM trend means longer vacancies and softer asking-rent achievability than the comps imply.
- What's the recent tenant-quality profile in this submarket — average credit score on applications, eviction rate, late-payment / NSF rate, and stable-employment percentage? A property-management company in the area should have these aggregated.
- How much new for-sale + rental construction is in the pipeline within 1–3 miles? Heavy new supply typically softens prices + rents 12–24 months out; constrained supply supports both.
Investment metrics
- 1% rule
- 0.84% ✗
- Cap rate
- 5.92%
- Cash-on-cash
- -1.34%
- DSCR
- 0.94
- GRM
- 10.0
CMA / ARV
- ARV (median comp)
- $277,079
- List price
- $269,990
- Delta
- -2.56%
- Verdict
- FAIR
- Comps
- 20 within 1.0 mi
Show comp detail 12 sales within ~0.75 mi
| Address | Dist | Beds/Ba | Sqft | Sold | Price | $/sf | Match |
|---|---|---|---|---|---|---|---|
| 427 Starfly Dr | 0.14mi | 5/3.0 | 2,531 (+5%) | 8mo | $287,050 | $113 | 77 |
| 10711 Sora Dr | 0.06mi | 4/2.5 (-1) | 2,218 (-8%) | 1mo | $280,200 | $126 | 74 |
| 407 Starfly Dr | 0.12mi | 5/3.0 | 2,531 (+5%) | 13mo | $317,950 | $126 | 73 |
| 950 Oak Glen Dr | 0.47mi | 4/2.5 (-1) | 2,378 (-1%) | 1mo | $263,000 | $111 | 66 |
| 247 Pine Cavern Dr | 0.38mi | 4/3.0 (-1) | 2,312 (-4%) | 6mo | $259,900 | $112 | 64 |
| 10918 Flycatcher Dr | 0.11mi | 4/2.5 (-1) | 2,218 (-8%) | 14mo | $274,809 | $124 | 61 |
| 443 Starfly Dr | 0.16mi | 4/2.5 (-1) | 2,218 (-8%) | 13mo | $314,330 | $142 | 59 |
| 996 Oak Glen Dr | 0.47mi | 4/2.5 (-1) | 2,499 (+4%) | 7mo | $235,000 | $94 | 57 |
| 10795 Sora Dr | 0.21mi | 4/2.5 (-1) | 2,198 (-9%) | 14mo | $293,275 | $133 | 55 |
| 141 Shadow Leaf Trl | 0.40mi | 4/2.5 (-1) | 2,576 (+7%) | 13mo | $299,000 | $116 | 50 |
| 301 Maple Bark Trl | 0.51mi | 4/3.0 (-1) | 2,081 (-14%) | 4mo | $249,900 | $120 | 43 |
| 157 Wasatch Peaks Way | 0.74mi | 4/3.0 (-1) | 2,246 (-7%) | 9mo | $355,990 | $158 | 39 |
Match score weights: distance 35% · size 25% · config 20% · recency 20%. Top-matched comps best support the ARV.
Projected returns pro-forma
-3.0% appreciation · 0.98% rent growth · sell at horizon
- IRR
- -20.8%
- Equity multiple
- 0.29×
- Total profit
- $-54,979
- Equity at exit
- $41,313
- IRR
- -19.4%
- Equity multiple
- 0.06×
- Total profit
- $-72,990
- Equity at exit
- $23,957
Cash invested: $77,582 (down + closing). Projections, not guarantees.
Landlord ↔ Tenant lean methodology
- Overall (STATE)
- 87 Strongly Landlord-Friendly
- State Texas
- 87 Strongly Landlord-Friendly · R+5
- County
- — inherits STATE
- City
- — inherits STATE
ZIP-level market 77378
- Home prices YoY
- -3.0%
- Rents YoY
- 1.0%
- Active inventory
- 710
- Price-to-rent
- 9.7×
Monthly cashflow live
- Estimated rent
- $2,314 medium interval (Pro) →
- Mortgage (P&I)
- −$1,453
- Tax est. 1.5%
- −$346 /mo · $4,156/yr
- Insurance
- −$115
- HOA
- −$0
- Vacancy / Maint / Mgmt
- −$486
- Net cashflow
- $-86
Break-even live
UW: 25.0% down · 7.5% · 30yr · 1.5% tax · 5.0% vac · 8.0% maint · 8.0% mgmt
Financing live
Cash to close
- Down payment
- $69,270
- Closing costs
- $8,312
- Reserves months
- —
- Total cash needed
- —
Loan-product check · same deal, 3 products live
Conventional
25% down · 7.5% · 30yr
- Down + closing
- —
- Monthly P&I
- —
- Monthly cashflow
- —
- DSCR
- —
- Eligible?
- —
Personal DTI + credit; lowest rate.
DSCR
20% down · 8.5% · 30yr
- Down + closing
- —
- Monthly P&I
- —
- Monthly cashflow
- —
- DSCR
- —
- Eligible?
- —
No personal income docs; deal must DSCR.
Hard money
10% down · 12.0% · 12mo
- Down + closing
- —
- Monthly P&I
- —
- Monthly cashflow
- —
- DSCR
- —
- Eligible?
- —
Short-term bridge; refi at stabilization.
Rent comps 1 comps
| Address | Beds | Baths | Sqft | Rent | $/sqft | DOM | Units | Dist |
|---|---|---|---|---|---|---|---|---|
| 974 Oak Falls Dr Willis, TX | 4.0 | 2.5 | 2499 | $2,210 | $0.88 | 43d | 1 | 0.53mi |
Listing history 14 events
-
2026-06-18days on market $269,990 Active 40 DOM
-
2026-06-17days on market $269,990 Active 39 DOM
-
2026-06-16days on market $269,990 Active 38 DOM
-
2026-06-15days on market $269,990 Active 37 DOM
-
2026-06-13days on market $269,990 Active 35 DOM
-
2026-06-09days on market $269,990 Active 31 DOM
-
2026-06-08days on market $269,990 Active 30 DOM
-
2026-06-07days on market $269,990 Active 29 DOM
-
2026-06-04days on market $269,990 Active 26 DOM
-
2026-06-03days on market $269,990 Active 25 DOM
-
2026-06-02days on market $269,990 Active 24 DOM
-
2026-06-01days on market $269,990 Active 23 DOM
-
2026-05-31days on market $269,990 Active 22 DOM
-
2026-05-09$269,990 Active 1500-char remark
ⓘ Source: listings_history table (triggers on properties + properties_extension) + one-shot
backfill from property_details.listing_events for pre-trigger history.
Nearby sold comps map
Loading sold comps map…
Walkable amenities ~0.75 mi
Loading nearby amenities…
Taxation est. · year 1
- Rental income
- $27,774
- − Mortgage interest
- −$15,521
- − Property taxes
- −$4,156
- − Insurance
- −$1,385
- − Repairs & maintenance
- −$2,222
- − Management
- −$2,222
- − Depreciation
- −$8,060
- Taxable loss
- −$5,793
- Est. tax savings @ 24.0%
- +$1,390
- After-tax cash flow
- $353/yr
For passive investors: Depreciation is non-cash, so a rental often shows a tax loss while cash-flowing — sheltering income. Rental losses are passive: they offset passive income freely, and up to $25,000/yr can offset ordinary (W-2) income if you actively participate and your MAGI is under $100k (phasing out to $0 by $150k); unused losses carry forward. On sale, claimed depreciation is recaptured at up to 25%, and gains may owe capital-gains tax (a 1031 exchange can defer both). Figures are a year-1 estimate at your 24.0% rate — not tax advice; consult a CPA.
Condition & rehab AI · 7 photos
This Willow plan by CastleRock Communities is in excellent condition with no visible repairs needed. It offers a good ROI with updates focusing on curb appeal and interior aesthetics.
Value-add opportunities
- Both Painting exterior and interior — Enhances curb appeal and interior aesthetics
- Both Landscaping improvements — Enhances curb appeal and adds value
- Both New flooring in high-traffic areas — Improves appearance and reduces maintenance
- Both New kitchen appliances — Enhances functionality and appeal
- Both New bathroom fixtures — Enhances functionality and appeal
Renovation cost estimate screening
Value-add ROI direction
- Both Painting exterior and interior — Enhances curb appeal and interior aesthetics ↑
- Both Landscaping improvements — Enhances curb appeal and adds value ↑
- Both New flooring in high-traffic areas — Improves appearance and reduces maintenance ↑
- Both New kitchen appliances — Enhances functionality and appeal ↑
- Both New bathroom fixtures — Enhances functionality and appeal ↑
ⓘ Cost ranges are severity-bucket heuristics (US national rule-of-thumb). Get contractor quotes + a written scope before underwriting a rehab budget.
Schools (NCES district)
- District
- Willis ISD
- NCES district ID
- 4845900
- Math proficiency
- 33% ▼ -15.00%
- Reading proficiency
- 40% ▼ -2.00%
- Median HH income
- $57,828
- Composite
- 32.32/100
- National rank
- #5746
- State rank
- #458 of 826 in TX
Livability — Conroe
- Score
- 74/100
- State rank
- #169
- US rank
- #4447
Category grades
Schools grade is shown separately in the Schools card above.
Census & demographics
- Census place
- Conroe, TX
- County
- Montgomery County · 663,713 people
- City population
- 205,417
- Metro
- Houston-The Woodlands-Sugar Land, TX
- Population (ZIP)
- 17,629
- Household income
- $71,143
- Rent vs Own
- Severe rent burden
- 402.0
Population outlook (Montgomery County) Hauer SSP2
- Today (2025)
- 713,896 people
- By 2030
- 805,263 · +12.8%
- By 2040
- 992,708 · +39.1%
- By 2050
- 1,179,590 · +65.2%
- By 2075
- 1,628,084 · +128.1%
- By 2100
- 1,937,880 · +171.5%
Race, ethnicity, and origin ACS 2023
- Neighborhood character
- Diverse neighborhood (Simpson 0.55)
- Race & ethnicity
- White 58% Hispanic / Latino 32% Two or more races 14% Black 7% Native American 1%
- Hispanic origin (detail)
- Mexican 27%
- Common ancestry
- Romanian 2% Slovak 2% Serbian 1%
- Foreign-born
- 12% · Canada
- Languages at home
- 80% English-only · Spanish 19%
Political lean MEDSL · Montgomery
- 2024 margin
- Solid R (+45.5) · D 26.8% · R 72.3%
- 2008→2024 swing
- +7.2pp toward D · 2008: -52.7pp · 2024: -45.5pp
- All cycles
- 2024: R+45.5 2020: R+43.8 2016: R+51.4 2012: R+60.7 2008: R+52.7
Not yet ingested
- Civics
- —
Market trends
- HPI YoY
- ▼ -8.25%
- Current HPI
- 261.9673
- Rent YoY
- ▲ 0.98%
- Metro
- Houston-The Woodlands-Sugar Land, TX
- State GDP YoY
- ▲ 3.95%
- F500 in state
- 110
Industry mix (Fortune 500 HQ in TX)
| Industry | F500 HQs | Revenue |
|---|---|---|
| Energy | 16 | $1,198B |
|
||
| Technology | 5 | $198B |
|
||
| Engineering / Construction | 4 | $72B |
|
||
| Energy Services | 3 | $60B |
|
||
| Utilities | 3 | $41B |
|
||
| Healthcare | 2 | $330B |
|
||
Cash-flow waterfall
monthlySold comps — $/sqft
last 12 mo · ≤1 miLoading sold comps…