 6-Plex
15412 S Atlantic Ave · East Rancho Dominguez, CA
Flood risk 3/10 · Minor
- FEMA flood zone
- X
- Chance of flooding over 30 yrs
- 0.18%
- Est. flood insurance / yr
- $507 – $1,088
Fire risk 1/10 · Minimal
- Est. fire insurance / yr
- $659 – $1,223
Heat risk 5/10 · Moderate
- Hot days now (above 90°F)
- 6 days/yr
- Hot days in 30 yrs
- 18 days/yr
Wind risk 1/10 · Minimal
- Chance of severe wind over 30 yrs
- —
Air-quality risk 6/10 · Moderate
- Unhealthy air days now
- 10 days/yr
- Unhealthy air days in 30 yrs
- 10 days/yr
Risk factors via First Street. Map © Google.
Why this score? — see what drove the D- grade
The composite is a weighted blend of 9 inputs, each scored 0–100. Each bar is that input's sub-score; the figure is the points it added to the 100-point composite (weight × sub-score).
- Cash flow +18.5/30.0
- DSCR +5.8/10.0
- 1% rule +4.4/10.0
- Schools +3.2/10.0
- Livability +2.9/5.0
- Rent growth +2.5/5.0
- Condition / age +2.5/5.0
- ARV discount +0.0/15.0
- Appreciation +0.0/10.0
$950,000
🖨 Deal sheet 📄 Offer letter ✓ Due diligence
Multi-family units
County records classify this as Multi-Family (5+ Unit). Listing-text estimate: 6 units. confirmed
5+ unit building — per-unit beds/baths from public records are typically unavailable; the breakdown below (if shown) is an estimate from the listing text.
Listing remarks MLS
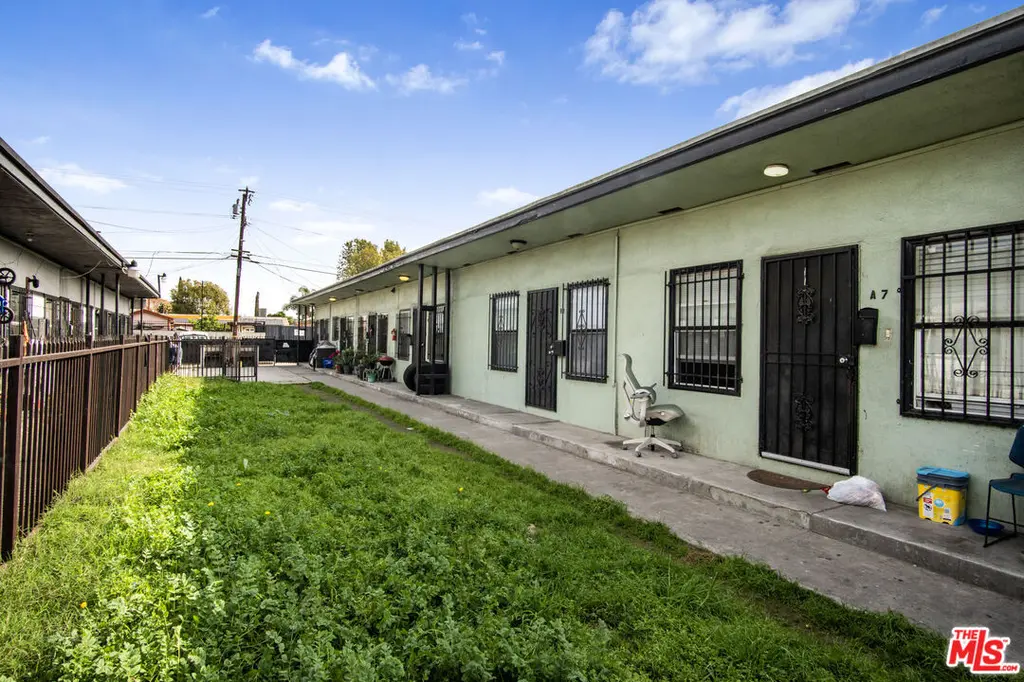
We are pleased to present 15412 S Atlantic Avenue, a 6 unit investment opportunity not subject to LA RSO in Compton, CA. The property is comprised of six bungalow-style totaling 2,140 SF with a unit mix of all (5) 1 Bed / 1 Bath units and (1) Studio. There are currently (5) Section 8 tenants in-place: 1 Bed/ 1 Bath units ranging from $1,486 - $1,800. The remaining Studio is currently rented below market at $954. HACLA voucher payment standard for city of Compton is currently $2,172 for 1 bedroom units and $1,920 for Studios. The property will be delivered fully occupied with a gross monthly income of $8,867.32, or $106,408 annually. The opportunity yields a 6.53% Cap Rate on current income (9.40 GRM) with approximately 20% rental upside to market and 44% to HACLA payment standard. 15412 S Atlantic Ave is located in East Compton, just west of the 710 freeway with convenient access to Long Beach, South Bay, Cal State Dominguez Hills / Dignity Health Sports Park, and local national grocers / retailers.
Key facts
- Convenient access
- Bungalow style
- 4,926 sq ft lot
Tags
Neighborhood map
What this means for you Summary
Snapshot
- This is a 5×1bd/1ba + 1×?bd/1ba units multifamily listed at $950k.
Deal economics
- At list price, monthly cash flow is $909 ($11k/yr) — positive. Per door: $151/mo.
- The deal already cash-flows at list — no discount required.
- To meet the 1% rule (rent ≥ 1% of price), the offer needs to be $892k (6.1% below list).
- Recommended offer: $836k (12.0% below list) — sets the bar for market timing.
Location & tenants
- Location reads 57/100 on livability (#744 in CA) — a working-class tenant base; expect higher turnover. Strengths: commute A+; Watch: crime F, amenities F, cost of living F.
- Compton Unified (suburban): math 31% / reading 38% proficiency, ranked #910 of 1,400 in CA (top 65%) — families likely to look elsewhere, expect single-tenant / working-renter base with shorter leases; 78% free/reduced lunch — lower-income household profile, screen leases tightly.
- Market conditions: 40 active listings in the ZIP; 19,697 units permitted in Los Angeles County in 2024 (9,426 in 5+ unit buildings).
Forward outlook
- Local home prices are declining (-3.0%/yr); year-one equity from $7k of loan paydown is wiped out by about $28k of value loss. Plan a longer hold.
- Los Angeles County population projected at +9% by 2050 — modest demand growth; plan on rents tracking national, not racing it.
Negotiation context
- It's been on market 128 days — a 12% lower offer ($836k) is reasonable based on typical stale-listing flexibility.
- 12 sale attempts since 27y ago; this cycle's ask has dropped $50k (5%) from the opening price — seller is motivated, your offer sets the floor, not the list.
- Current owner paid $420k; list at $950k implies a 126% gain — meaningful room to come down on a strong offer.
Risks & watch-outs
- Watch-outs: built in 1952 — expect roof / HVAC / electrical / plumbing capex.
- Climate carrying-cost: extreme-heat days projected 6→18/yr by 2055 (HVAC capex compounding) — expect insurance premiums to compound above CPI over the hold.
Questions for the listing agent
- It's been on market 128 days. Have you received any prior offers? Is the seller open to a 12% concession, seller financing, or rate buy-down credit?
- Can we see the unit-by-unit rent roll, current vacancy, and any below-market leases? What's the average tenancy length?
- What capital expenditures (roof, boiler, parking lot, exteriors) have been made in the last 5 years, and what's planned in the next 2?
- Built in 1952 — when were the roof, HVAC, electrical panel, plumbing, and water heater last replaced?
- Why hasn't it sold? Are there any deal-killer items the seller is aware of (foundation, flood, title, zoning, code violations)?
- Is there a deadline driving the sale (1031 exchange, divorce, estate, relocation)? That informs how much negotiation room exists.
- Crime grade is F in this area — have there been break-ins, vandalism, or insurance claims at this property in the last 3 years? What carrier currently insures it and at what premium?
- The area grade is low — what's the realistic commute time and amenity access for the typical tenant pool here? Any planned neighborhood developments (good or bad) we should know about?
- What's the average days-on-market for RENTAL listings here right now (not sales)? A rising rental-DOM trend means longer vacancies and softer asking-rent achievability than the comps imply.
- What's the recent tenant-quality profile in this submarket — average credit score on applications, eviction rate, late-payment / NSF rate, and stable-employment percentage? A property-management company in the area should have these aggregated.
- How much new apartment / multifamily construction is in the pipeline within 1–3 miles? Heavy new supply (>2% of stock underway) typically softens rents 12–24 months out; light construction supports rent growth.
Investment metrics
- 1% rule
- 0.94% ✗
- Cap rate
- 7.44%
- Cash-on-cash
- 4.10%
- DSCR
- 1.18
- GRM
- 8.9
CMA / ARV
- ARV (median comp)
- $763,251
- List price
- $950,000
- Delta
- 24.47%
- Verdict
- OVERPRICED
- Comps
- 20 within 1.0 mi
Show comp detail 3 sales within ~0.75 mi
| Address | Dist | Beds/Ba | Sqft | Sold | Price | $/sf | Match |
|---|---|---|---|---|---|---|---|
| 15327 S Butler Ave | 0.27mi | 7/4.0 (+1) | 2,080 (-3%) | 8mo | $820,000 | $394 | 63 |
| 15004-15006 S Lime | 0.26mi | 5/2.0 (-1) | 1,932 (-10%) | 6mo | $840,000 | $435 | 46 |
| 15115 S Frailey Ave | 0.20mi | 7/4.0 (+1) | 2,436 (+14%) | 18mo | $275,000 | $113 | 39 |
Match score weights: distance 35% · size 25% · config 20% · recency 20%. Top-matched comps best support the ARV.
Projected returns pro-forma
-3.0% appreciation · 3.0% rent growth · sell at horizon
- IRR
- -9.9%
- Equity multiple
- 0.64×
- Total profit
- $-96,175
- Equity at exit
- $141,648
- IRR
- -0.5%
- Equity multiple
- 0.96×
- Total profit
- $-9,717
- Equity at exit
- $82,139
Cash invested: $266,000 (down + closing). Projections, not guarantees.
Landlord ↔ Tenant lean methodology
- Overall (STATE)
- 18 Strongly Tenant-Friendly
- State California
- 18 Strongly Tenant-Friendly · D+13
- County
- — inherits STATE
- City
- — inherits STATE
ZIP-level market 90221
- Active inventory
- 40
- Price-to-rent
- 52.7×
Monthly cashflow live
- Estimated rent
- $8,922 medium interval (Pro) →
- Mortgage (P&I)
- −$4,982
- Tax from tax record
- −$762 /mo · $9,140/yr
- Insurance
- −$396
- HOA
- −$0
- Vacancy / Maint / Mgmt
- −$1,874
- Net cashflow
- $909
Break-even live
6-unit breakdown (identical units grouped — click to expand)
| Units | Beds | Baths | Est. rent |
|---|---|---|---|
| 5× units | 1 | 1 | $7,510 |
| #1 | 1 | 1 | $1,502 |
| #2 | 1 | 1 | $1,502 |
| #3 | 1 | 1 | $1,502 |
| #4 | 1 | 1 | $1,502 |
| #5 | 1 | 1 | $1,502 |
| 1× unit | 0 | 1 | $1,414 |
| Total (6 units) | $8,922 | ||
UW: 25.0% down · 7.5% · 30yr · 1.5% tax · 5.0% vac · 8.0% maint · 8.0% mgmt
Financing live
Cash to close
- Down payment
- $237,500
- Closing costs
- $28,500
- Reserves months
- —
- Total cash needed
- —
Loan-product check · same deal, 3 products live
Conventional
25% down · 7.5% · 30yr
- Down + closing
- —
- Monthly P&I
- —
- Monthly cashflow
- —
- DSCR
- —
- Eligible?
- —
Personal DTI + credit; lowest rate.
DSCR
20% down · 8.5% · 30yr
- Down + closing
- —
- Monthly P&I
- —
- Monthly cashflow
- —
- DSCR
- —
- Eligible?
- —
No personal income docs; deal must DSCR.
Hard money
10% down · 12.0% · 12mo
- Down + closing
- —
- Monthly P&I
- —
- Monthly cashflow
- —
- DSCR
- —
- Eligible?
- —
Short-term bridge; refi at stabilization.
Listing history 50 events
-
2026-06-18days on market $950,000 Active 128 DOM
-
2026-06-17days on market $950,000 Active 127 DOM
-
2026-06-16days on market $950,000 Active 126 DOM
-
2026-06-15days on market $950,000 Active 125 DOM
-
2026-06-13days on market $950,000 Active 122 DOM
-
2026-06-09days on market $950,000 Active 119 DOM
-
2026-06-08days on market $950,000 Active 118 DOM
-
2026-06-07days on market $950,000 Active 117 DOM
-
2026-06-04days on market $950,000 Active 114 DOM
-
2026-06-03days on market $950,000 Active 113 DOM
-
2026-06-02days on market $950,000 Active 112 DOM
-
2026-06-01days on market $950,000 Active 111 DOM
-
2026-05-31days on market $950,000 Active 110 DOM
-
2026-05-19price $950,000 1015-char remark
Show marketing remark (1015 chars)
We are pleased to present 15412 S Atlantic Avenue, a 6 unit investment opportunity not subject to LA RSO in Compton, CA. The property is comprised of six bungalow-style totaling 2,140 SF with a unit mix of all (5) 1 Bed / 1 Bath units and (1) Studio. There are currently (5) Section 8 tenants in-place: 1 Bed/ 1 Bath units ranging from $1,486 - $1,800. The remaining Studio is currently rented below market at $954. HACLA voucher payment standard for city of Compton is currently $2,172 for 1 bedroom units and $1,920 for Studios. The property will be delivered fully occupied with a gross monthly income of $8,867.32, or $106,408 annually. The opportunity yields a 6.53% Cap Rate on current income (9.40 GRM) with approximately 20% rental upside to market and 44% to HACLA payment standard. 15412 S Atlantic Ave is located in East Compton, just west of the 710 freeway with convenient access to Long Beach, South Bay, Cal State Dominguez Hills / Dignity Health Sports Park, and local national grocers / retailers.
-
2026-02-10$1,000,000 Active 1015-char remark
Show marketing remark (1015 chars)
We are pleased to present 15412 S Atlantic Avenue, a 6 unit investment opportunity not subject to LA RSO in Compton, CA. The property is comprised of six bungalow-style totaling 2,140 SF with a unit mix of all (5) 1 Bed / 1 Bath units and (1) Studio. There are currently (5) Section 8 tenants in-place: 1 Bed/ 1 Bath units ranging from $1,486 - $1,800. The remaining Studio is currently rented below market at $954. HACLA voucher payment standard for city of Compton is currently $2,172 for 1 bedroom units and $1,920 for Studios. The property will be delivered fully occupied with a gross monthly income of $8,867.32, or $106,408 annually. The opportunity yields a 6.53% Cap Rate on current income (9.40 GRM) with approximately 20% rental upside to market and 44% to HACLA payment standard. 15412 S Atlantic Ave is located in East Compton, just west of the 710 freeway with convenient access to Long Beach, South Bay, Cal State Dominguez Hills / Dignity Health Sports Park, and local national grocers / retailers.
-
2016-04-04soldstatus $420,000 Closed Sale 382-char remark
Show marketing remark (382 chars)
Property does not Qualify for Financing due to being in the middle of City Rezoning Negotiation; No Lender Financing Offers are able to be accepted until Rezoning with Conditional Use Permit is Resolved; The only offers Seller is willing to accept currently are CASH OFFERS with Current rezoning issues to be purchased in this manner by Cash Buyer and will not accept no LOW offers;
-
2016-04-04soldstatus $420,000
Show marketing remark (382 chars)
Property does not Qualify for Financing due to being in the middle of City Rezoning Negotiation; No Lender Financing Offers are able to be accepted until Rezoning with Conditional Use Permit is Resolved; The only offers Seller is willing to accept currently are CASH OFFERS with Current rezoning issues to be purchased in this manner by Cash Buyer and will not accept no LOW offers;
-
2016-04-01soldstatus $420,000
-
2016-03-18status Pending Sale 382-char remark
Show marketing remark (382 chars)
Property does not Qualify for Financing due to being in the middle of City Rezoning Negotiation; No Lender Financing Offers are able to be accepted until Rezoning with Conditional Use Permit is Resolved; The only offers Seller is willing to accept currently are CASH OFFERS with Current rezoning issues to be purchased in this manner by Cash Buyer and will not accept no LOW offers;
-
2015-10-16$439,000 Active 382-char remark
Show marketing remark (382 chars)
Property does not Qualify for Financing due to being in the middle of City Rezoning Negotiation; No Lender Financing Offers are able to be accepted until Rezoning with Conditional Use Permit is Resolved; The only offers Seller is willing to accept currently are CASH OFFERS with Current rezoning issues to be purchased in this manner by Cash Buyer and will not accept no LOW offers;
-
2015-10-15$439,000
-
2015-09-16historical
-
2015-07-11status Pending Sale
-
2015-07-10historical Hold Do Not Show
-
2015-05-13price $439,000
-
2015-05-03price $495,000
-
2015-04-16price $575,000
-
2015-04-14$600,000 Active
-
2015-04-13$439,000
-
2003-01-17soldstatus $196,500
-
2003-01-17soldstatus $191,500
-
2002-10-25historical
-
2002-10-24$199,900
-
2002-10-01historical
-
2002-10-01$240,000
-
2002-07-15$240,000
-
2001-04-18historical
-
2000-12-26
-
2000-11-01price $249,900
-
2000-11-01price $249,900
-
2000-11-01price $249,900
-
2000-11-01price $249,900
-
2000-08-31historical
-
2000-06-29$249,900
-
2000-05-31historical
-
2000-05-04$229,900
-
1999-07-07price $315,000
-
1999-07-07price $315,000
-
1999-07-07price $315,000
-
1999-05-15$315,000
ⓘ Source: listings_history table (triggers on properties + properties_extension) + one-shot
backfill from property_details.listing_events for pre-trigger history.
Tax reassessment forecast CA · Resets to sale price
- Current annual tax
- $9,140 · $762/mo
- Projected year-2 tax
- $9,140 · $762/mo
- Expected delta
- $0/yr ($0/mo · 0.0%)
ⓘ Screening estimate from a state-policy table — verify with the county assessor before closing.
Climate risk First Street
- Flood 3/10 Moderate FEMA zone X · 18% chance over 30 yrs
- Wildfire 1/10 Low
- Heat 5/10 Major 6 d/yr ≥90°F today · 18 d/yr by 30 yrs out
- Wind 1/10 Low
- Air quality 6/10 Major 10 unhealthy d/yr today · 10 by 30 yrs out
Nearby sold comps map
Loading sold comps map…
Walkable amenities ~0.75 mi
Loading nearby amenities…
Taxation est. · year 1
- Rental income
- $107,064
- − Mortgage interest
- −$53,215
- − Property taxes
- −$9,140
- − Insurance
- −$4,750
- − Repairs & maintenance
- −$8,565
- − Management
- −$8,565
- − Depreciation
- −$27,636
- Taxable loss
- −$4,807
- Est. tax savings @ 24.0%
- +$1,154
- After-tax cash flow
- $12,061/yr
For passive investors: Depreciation is non-cash, so a rental often shows a tax loss while cash-flowing — sheltering income. Rental losses are passive: they offset passive income freely, and up to $25,000/yr can offset ordinary (W-2) income if you actively participate and your MAGI is under $100k (phasing out to $0 by $150k); unused losses carry forward. On sale, claimed depreciation is recaptured at up to 25%, and gains may owe capital-gains tax (a 1031 exchange can defer both). Figures are a year-1 estimate at your 24.0% rate — not tax advice; consult a CPA.
Schools (NCES district)
- District
- Compton Unified
- NCES district ID
- 0609620
- Math proficiency
- 31% ▲ 5.00%
- Reading proficiency
- 38% ▲ 3.00%
- Median HH income
- $45,045
- Composite
- 32.1/100
- National rank
- #10985
- State rank
- #910 of 1400 in CA
Livability — East Rancho Dominguez
- Score
- 57/100
- State rank
- #744
- US rank
- #21785
Category grades
Schools grade is shown separately in the Schools card above.
Census & demographics
- Census place
- East Rancho Dominguez, CA
- Population (ZIP)
- 50,782
Population outlook (Los Angeles County) Hauer SSP2
- Today (2025)
- 10,940,515 people
- By 2030
- 11,256,481 · +2.9%
- By 2040
- 11,729,929 · +7.2%
- By 2050
- 11,948,407 · +9.2%
- By 2075
- 11,818,114 · +8.0%
- By 2100
- 10,842,928 · -0.9%
Race, ethnicity, and origin ACS 2023
- Neighborhood character
- Predominantly Hispanic (79%)
- Race & ethnicity
- Hispanic / Latino 79% Two or more races 33% Black 18% Native American 2% Asian 1%
- Hispanic origin (detail)
- Mexican 70%
- Foreign-born
- 37% · Canada
- Languages at home
- 30% English-only · Spanish 68% Tagalog/Filipino 1%
Political lean MEDSL · Los Angeles
- 2024 margin
- Solid D (+32.9) · D 64.8% · R 31.9% · Other 3.3%
- 2008→2024 swing
- -7.4pp toward R · 2008: 40.4pp · 2024: 32.9pp
- All cycles
- 2024: D+32.9 2020: D+44.2 2016: D+48.0 2012: D+40.0 2008: D+40.4
Not yet ingested
- Civics
- —
Market trends
- HPI YoY
- ▼ -482.21%
- Current HPI
- 490.5921
- Rent YoY
- —
- Metro
- —
- State GDP YoY
- ▲ 3.21%
- F500 in state
- 116
Industry mix (Fortune 500 HQ in CA)
| Industry | F500 HQs | Revenue |
|---|---|---|
| Technology | 27 | $1,492B |
|
||
| Financial Services | 3 | $174B |
|
||
| Retail | 3 | $44B |
|
||
| Insurance | 3 | $26B |
|
||
| Media / Entertainment | 2 | $115B |
|
||
| Pharmaceuticals / Biotech | 2 | $62B |
|
||
Price history
+150.0% since first listed39 events — show timeline
- 2026-05-19 Price Changed $950,000 TheMLS
- 2026-02-10 Listed $1,000,000 TheMLS
- 2016-04-04 Sold (MLS) $420,000 SDMLS
- 2016-04-04 Sold (MLS) $420,000 CRMLS
- 2016-04-01 Sold (Public Records) $420,000 Public Records
- 2016-03-18 Pending — CRMLS
- 2015-10-16 Listed $439,000 CRMLS
- 2015-10-15 Listed $439,000 SDMLS
- 2015-09-16 Listing Removed — SDMLS
- 2015-07-11 Pending — CRMLS
- 2015-07-10 Delisted — CRMLS
- 2015-05-13 Price Changed $439,000 CRMLS
- 2015-05-03 Price Changed $495,000 CRMLS
- 2015-04-16 Price Changed $575,000 CRMLS
- 2015-04-14 Listed $600,000 CRMLS
- 2015-04-13 Listed $439,000 SDMLS
- 2003-01-17 Sold (Public Records) $191,500 Public Records
- 2003-01-17 Sold (MLS) $196,500 CRMLS
- 2002-10-25 Listing Removed — CRMLS
- 2002-10-24 Listed $199,900 CRMLS
- 2002-10-01 Listed $240,000 CRMLS
- 2002-10-01 Listing Removed — CRMLS
- 2002-07-15 Listed $240,000 CRMLS
- 2001-04-18 Delisted — TheMLS
- 2000-12-26 Listed — TheMLS
- 2000-11-01 Price Changed $249,900 CRMLS
- 2000-11-01 Price Changed $249,900 CRMLS
- 2000-11-01 Price Changed $249,900 CRMLS
- 2000-11-01 Price Changed $249,900 CRMLS
- 2000-08-31 Listing Removed — CRMLS
- 2000-06-29 Listed $249,900 CRMLS
- 2000-05-31 Listing Removed — CRMLS
- 2000-05-04 Listed $229,900 CRMLS
- 1999-07-07 Price Changed $315,000 CRMLS
- 1999-07-07 Price Changed $315,000 CRMLS
- 1999-07-07 Price Changed $315,000 CRMLS
- 1999-05-15 Listed $315,000 CRMLS
- 1993-09-10 Sold (Public Records) $429,051 Public Records
- 1990-12-20 Sold (Public Records) $380,000 Public Records
Property tax history
+4.0%/yrLatest (2025): $9,140 · +2.7% YoY. Source: county tax records.
Cash-flow waterfall
monthlySold comps — $/sqft
last 12 mo · ≤1 miLoading sold comps…