352 Roxford Rd N · Lyncourt, NY
Flood risk 1/10 · Minimal
- FEMA flood zone
- X (unshaded)
- Chance of flooding over 30 yrs
- 0.0%
- Est. flood insurance / yr
- $473 – $860
Fire risk 1/10 · Minimal
- Est. fire insurance / yr
- $691 – $1,283
Heat risk 3/10 · Minor
- Hot days now (above 95°F)
- 7 days/yr
- Hot days in 30 yrs
- 16 days/yr
Wind risk 1/10 · Minimal
- Chance of severe wind over 30 yrs
- 1.0%
Air-quality risk 2/10 · Minimal
- Unhealthy air days now
- 0 days/yr
- Unhealthy air days in 30 yrs
- 1 days/yr
Risk factors via First Street. Map © Google.
Why this score? — see what drove the C+ grade
The composite is a weighted blend of 9 inputs, each scored 0–100. Each bar is that input's sub-score; the figure is the points it added to the 100-point composite (weight × sub-score).
- Cash flow +15.6/30.0
- ARV discount +15.0/15.0
- Appreciation +10.0/10.0
- 1% rule +5.6/10.0
- DSCR +4.8/10.0
- Livability +4.1/5.0
- Schools +3.0/10.0
- Rent growth +2.5/5.0
- Condition / age +2.5/5.0
$160,000
🖨 Deal sheet 📄 Offer letter ✓ Due diligence
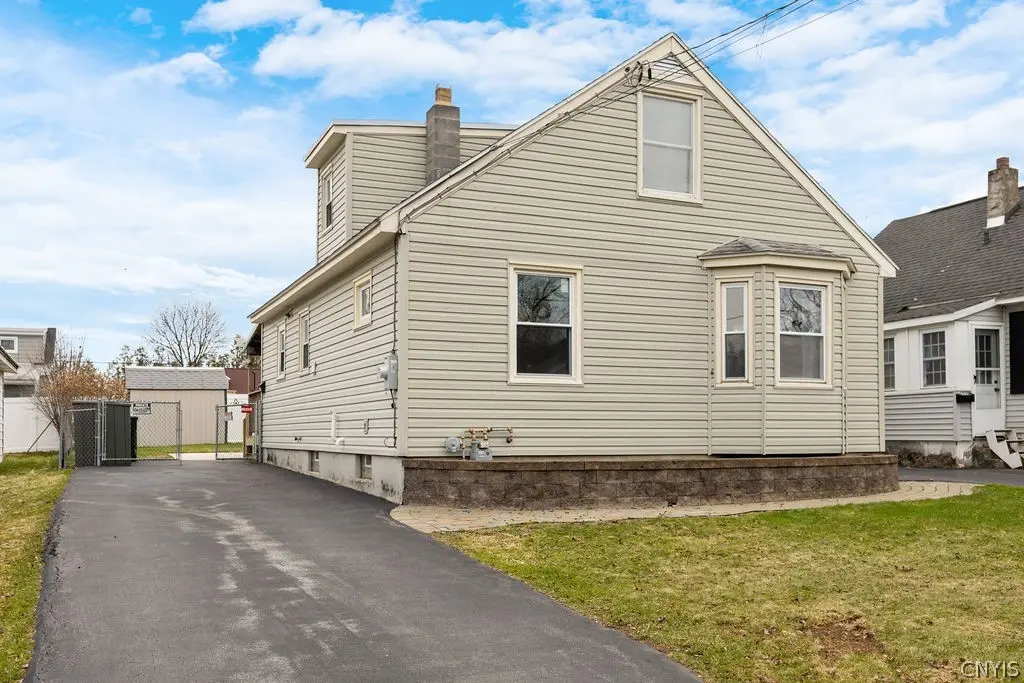
Listing remarks
Charming 3-bedroom Cape Cod in a convenient Lyncourt location! This well-maintained home offers a flexible layout with a first-floor bedroom, cozy family room, and eat-in kitchen. Natural woodwork adds warmth, while hardwood flooring provide a clean, updated feel. Enjoy year-round comfort with central air and forced air heat. The fully fenced backyard is perfect for relaxing or entertaining, complete with a deck and storage shed. Additional highlights include a full basement with laundry, sump pump with backup systems, and generator hookup for peace of mind. Located on a neighborhood street near public transportation and everyday amenities. A great opportunity for owner-occupants or investo
Key facts
- Natural woodwork
- Hardwood flooring
- First-floor bedroom
Tags
Neighborhood map
What this means for you Summary
Snapshot
- This is a 3-bed/1.0-bath single-family listed at $160k.
Deal economics
- At list price, monthly cash flow is $68 ($817/yr) — positive.
- The deal already cash-flows at list — no discount required.
- Meets the 1% rule at list price ($2k rent vs $160k).
Location & tenants
- Location reads 82/100 on livability (#72 in NY, #1,075 nationally) — a professional / high-income tenant draw. Strengths: cost of living A+, housing A+, health & safety A+; Watch: schools C-, amenities C-.
- Lyncourt Union Free School District (suburban): math 33% / reading 30% proficiency, ranked #719 of 755 in NY (top 95%) — families likely to look elsewhere, expect single-tenant / working-renter base with shorter leases.
- Market conditions: 99 active listings in the ZIP; 8 comparable units currently listed for rent nearby; rentals lingering (median 44d on market — plan ~5-8 weeks vacancy on turnover, expect pricing pressure); 62% of comp listings sitting > 30 days — soft ceiling on asking rent; lower-income renter base — watch delinquency; 616 units permitted in Onondaga County in 2024 (256 in 5+ unit buildings).
- At $1,692/mo this rent would consume 45% of the median local household income ($45k/yr) (locally 1437% of renters already pay >50% of income on rent) — very limited rent-growth headroom before tenants either downsize or default.
Forward outlook
- In year one you build about $17k of equity ($1k loan paydown + $16k appreciation (10.0% local appreciation)).
- Onondaga County population projected to shrink 9% by 2050 — rents likely to lag national; underwrite the cash flow, not the appreciation.
- At projected returns (10.0% appreciation + 3.0% rent growth), your $45k cash investment doubles in ~3 years — after that, you're playing with house money.
- By year 3, paydown + projected appreciation supports a ~$43k cash-out refi (75% LTV) — recoverable capital for the next deal without selling this one.
Negotiation context
- Only 5 days on market — expect competitive offers; lowballing is unlikely to land.
- Current owner paid $51k; list at $160k implies a 214% gain — meaningful room to come down on a strong offer.
Risks & watch-outs
- Watch-outs: property tax is 2.7% of price; built in 1955 — expect roof / HVAC / electrical / plumbing capex.
Questions for the listing agent
- Built in 1955 — when were the roof, HVAC, electrical panel, plumbing, and water heater last replaced?
- Property tax is high relative to price — has the assessment been appealed recently, and will the sale trigger a re-assessment?
- Is there a deadline driving the sale (1031 exchange, divorce, estate, relocation)? That informs how much negotiation room exists.
- What's the average days-on-market for RENTAL listings here right now (not sales)? A rising rental-DOM trend means longer vacancies and softer asking-rent achievability than the comps imply.
- What's the recent tenant-quality profile in this submarket — average credit score on applications, eviction rate, late-payment / NSF rate, and stable-employment percentage? A property-management company in the area should have these aggregated.
- How much new for-sale + rental construction is in the pipeline within 1–3 miles? Heavy new supply typically softens prices + rents 12–24 months out; constrained supply supports both.
Investment metrics
- 1% rule
- 1.06% ✓
- Cap rate
- 6.80%
- Cash-on-cash
- 1.82%
- DSCR
- 1.08
- GRM
- 7.9
CMA / ARV
- ARV (on-the-fly)
- $209,520
- Comps found
- 12
Show comp detail 12 sales within ~0.75 mi
| Address | Dist | Beds/Ba | Sqft | Sold | Price | $/sf | Match |
|---|---|---|---|---|---|---|---|
| 352 Roxford Rd N | 0.00mi | 3/1.5 | 1,164 (0%) | 0mo | $209,500 | $180 | 98 |
| 263 Wayland Rd | 0.13mi | 3/1.5 | 1,267 (+9%) | 3mo | $200,000 | $158 | 75 |
| 1108 Wadsworth St | 0.61mi | 3/1.0 | 1,168 (+0%) | 1mo | $165,000 | $141 | 70 |
| 203 Brookline Rd | 0.52mi | 3/1.0 | 1,126 (-3%) | 2mo | $190,000 | $169 | 68 |
| 232 Malverne Dr | 0.66mi | 3/1.5 | 1,142 (-2%) | 1mo | $224,900 | $197 | 64 |
| 606 Roxford Rd S | 0.68mi | 2/1.5 (-1) | 1,162 (-0%) | 1mo | $210,000 | $181 | 60 |
| 132 Lind Ave | 0.50mi | 3/1.0 | 1,284 (+10%) | 2mo | $190,000 | $148 | 58 |
| 497 Pleasantview Ave | 0.57mi | 3/1.5 | 1,056 (-9%) | 1mo | $189,900 | $180 | 55 |
| 105 Florida Rd S | 0.68mi | 3/2.0 | 1,118 (-4%) | 3mo | $242,500 | $217 | 55 |
| 108 Harrington St | 0.62mi | 3/1.0 | 1,056 (-9%) | 2mo | $225,000 | $213 | 54 |
| 125 1/2 Westview Ave | 0.49mi | 4/1.5 (+1) | 1,292 (+11%) | 3mo | $220,000 | $170 | 49 |
| 2908 Court St | 0.53mi | 3/2.0 | 1,312 (+13%) | 2mo | $170,000 | $130 | 48 |
Match score weights: distance 35% · size 25% · config 20% · recency 20%. Top-matched comps best support the ARV.
Projected returns pro-forma
10.0% appreciation · 3.0% rent growth · sell at horizon
- IRR
- 25.6%
- Equity multiple
- 3.04×
- Total profit
- $91,603
- Equity at exit
- $144,141
- IRR
- 22.6%
- Equity multiple
- 6.95×
- Total profit
- $266,595
- Equity at exit
- $310,845
Cash invested: $44,800 (down + closing). Projections, not guarantees.
Landlord ↔ Tenant lean methodology
- Overall (STATE)
- 15 Strongly Tenant-Friendly
- State New York
- 15 Strongly Tenant-Friendly · D+10
- County
- — inherits STATE
- City
- — inherits STATE
ZIP-level market 13208
- Home prices YoY
- 8.4%
- Active inventory
- 99
- Price-to-rent
- 7.9×
Monthly cashflow live
- Estimated rent
- $1,692 high interval (Pro) →
- Mortgage (P&I)
- −$839
- Tax from tax record
- −$363 /mo · $4,358/yr
- Insurance
- −$67
- HOA
- −$0
- Vacancy / Maint / Mgmt
- −$355
- Net cashflow
- $68
Break-even live
UW: 25.0% down · 7.5% · 30yr · 1.5% tax · 5.0% vac · 8.0% maint · 8.0% mgmt
Financing live
Cash to close
- Down payment
- $40,000
- Closing costs
- $4,800
- Reserves months
- —
- Total cash needed
- —
Loan-product check · same deal, 3 products live
Conventional
25% down · 7.5% · 30yr
- Down + closing
- —
- Monthly P&I
- —
- Monthly cashflow
- —
- DSCR
- —
- Eligible?
- —
Personal DTI + credit; lowest rate.
DSCR
20% down · 8.5% · 30yr
- Down + closing
- —
- Monthly P&I
- —
- Monthly cashflow
- —
- DSCR
- —
- Eligible?
- —
No personal income docs; deal must DSCR.
Hard money
10% down · 12.0% · 12mo
- Down + closing
- —
- Monthly P&I
- —
- Monthly cashflow
- —
- DSCR
- —
- Eligible?
- —
Short-term bridge; refi at stabilization.
Rent comps 8 comps
| Address | Beds | Baths | Sqft | Rent | $/sqft | DOM | Units | Dist |
|---|---|---|---|---|---|---|---|---|
| 106 Harrington St Syracuse, NY | 3.0 | 1.0 | 1168 | $1,875 | $1.61 | 43d | 1 | 0.61mi |
| 2802 Lemoyne Ave Unit 1 Syracuse, NY | 3.0 | 1.0 | 988 | $1,700 | $1.72 | 13d | 1 | 0.70mi |
| 286 Ross Park Syracuse, NY | 3.0 | 1.0 | 1100 | $1,500 | $1.36 | 44d | 1 | 0.89mi |
| 1140 Wolf St Apt 3 Syracuse, NY | 2.0 | 1.0 | 800 | $1,200 | $1.50 | 43d | 1 | 1.06mi |
| 1132 Wolf St Unit 4 Syracuse, NY | 3.0 | 1.0 | 1041 | $1,350 | $1.30 | 43d | 1 | 1.07mi |
| 423 Wendell Ter Syracuse, NY | 4.0 | 1.0 | 1312 | $2,500 | $1.91 | 13d | 1 | 1.27mi |
| 126 Woodruff Ave Syracuse, NY | 3.0 | 1.0 | 1200 | $1,675 | $1.40 | 43d | 1 | 1.30mi |
| 212 Dorchester Ave Syracuse, NY | 1.0–2.0 | 1.0 | 640 | $1,420 | $2.22 | 13d | 15 | 1.38mi |
Listing history 4 events
-
2026-04-01status Pending
-
2026-03-31historical Active Under Contract
-
2026-03-27$160,000 Active
-
1996-03-22soldstatus $51,000
ⓘ Source: listings_history table (triggers on properties + properties_extension) + one-shot
backfill from property_details.listing_events for pre-trigger history.
Tax reassessment forecast NY · Partial reset (capped growth)
- Current annual tax
- $4,358 · $363/mo
- Projected year-2 tax
- $4,358 · $363/mo
- Expected delta
- $0/yr ($0/mo · 0.0%)
ⓘ Screening estimate from a state-policy table — verify with the county assessor before closing.
Climate risk First Street
- Flood 1/10 Low FEMA zone X (unshaded) · 0% chance over 30 yrs
- Wildfire 1/10 Low
- Heat 3/10 Moderate 7 d/yr ≥95°F today · 16 d/yr by 30 yrs out
- Wind 1/10 Low 100% chance of damaging wind over 30 yrs
- Air quality 2/10 Low 0 unhealthy d/yr today · 1 by 30 yrs out
Nearby sold comps map
Loading sold comps map…
Walkable amenities ~0.75 mi
Loading nearby amenities…
Taxation est. · year 1
- Rental income
- $20,309
- − Mortgage interest
- −$8,962
- − Property taxes
- −$4,358
- − Insurance
- −$800
- − Repairs & maintenance
- −$1,625
- − Management
- −$1,625
- − Depreciation
- −$4,655
- Taxable loss
- −$1,716
- Est. tax savings @ 24.0%
- +$412
- After-tax cash flow
- $1,229/yr
For passive investors: Depreciation is non-cash, so a rental often shows a tax loss while cash-flowing — sheltering income. Rental losses are passive: they offset passive income freely, and up to $25,000/yr can offset ordinary (W-2) income if you actively participate and your MAGI is under $100k (phasing out to $0 by $150k); unused losses carry forward. On sale, claimed depreciation is recaptured at up to 25%, and gains may owe capital-gains tax (a 1031 exchange can defer both). Figures are a year-1 estimate at your 24.0% rate — not tax advice; consult a CPA.
Schools (NCES district)
- District
- Lyncourt Union Free School District
- NCES district ID
- 3617940
- Math proficiency
- 33% ▲ 3.00%
- Reading proficiency
- 30% ▲ 5.00%
- Median HH income
- $44,650
- Composite
- 29.71/100
- National rank
- #11736
- State rank
- #719 of 755 in NY
Livability — Lyncourt
- Score
- 82/100
- State rank
- #72
- US rank
- #1075
Category grades
Schools grade is shown separately in the Schools card above.
Census & demographics
- Census place
- Lyncourt, NY
- County
- Onondaga County · 247,257 people
- City population
- 152,627
- Metro
- Syracuse, NY
- Population (ZIP)
- 22,993
- Household income
- $44,712
- Rent vs Own
- Severe rent burden
- 1437.0
Population outlook (Onondaga County) Hauer SSP2
- Today (2025)
- 467,894 people
- By 2030
- 463,381 · -1.0%
- By 2040
- 447,697 · -4.3%
- By 2050
- 426,399 · -8.9%
- By 2075
- 373,661 · -20.1%
- By 2100
- 307,967 · -34.2%
Race, ethnicity, and origin ACS 2023
- Neighborhood character
- Highly diverse neighborhood (Simpson 0.70)
- Race & ethnicity
- White 46% Black 24% Asian 14% Two or more races 10% Hispanic / Latino 6%
- Hispanic origin (detail)
- Puerto Rican 4% Dominican 1%
- Common ancestry
- Romanian 3% Swedish 3% Italian 1%
- Foreign-born
- 22% · Vietnam, Philippines, Canada
- Languages at home
- 70% English-only · Spanish 6% Other Asian/Pacific 5% Vietnamese 4%
Political lean MEDSL · Onondaga
- 2024 margin
- D (+17.3) · D 58.6% · R 41.4%
- 2008→2024 swing
- -3.0pp toward R · 2008: 20.3pp · 2024: 17.3pp
- All cycles
- 2024: D+17.3 2020: D+20.6 2016: D+12.8 2012: D+21.1 2008: D+20.3
Not yet ingested
- Civics
- —
Market trends
- HPI YoY
- ▲ 30.91%
- Current HPI
- 399.3284
- Rent YoY
- —
- Metro
- Syracuse, NY
- State GDP YoY
- ▲ 2.60%
- F500 in state
- 92
Industry mix (Fortune 500 HQ in NY)
| Industry | F500 HQs | Revenue |
|---|---|---|
| Financial Services | 10 | $950B |
|
||
| Consumer Goods | 9 | $162B |
|
||
| Insurance | 4 | $225B |
|
||
| Telecommunications | 2 | $144B |
|
||
| Pharmaceuticals | 2 | $112B |
|
||
| Media / Entertainment | 2 | $69B |
|
||
Price history
+213.7% since first listed4 events — show timeline
- 2026-04-01 Pending — CNYIS
- 2026-03-31 Contingent — CNYIS
- 2026-03-27 Listed $160,000 CNYIS
- 1996-03-22 Sold (Public Records) $51,000 Public Records
Property tax history
+11.4%/yrLatest (2025): $4,358 · +1.2% YoY. Source: county tax records.
Cash-flow waterfall
monthlySold comps — $/sqft
last 12 mo · ≤1 miLoading sold comps…