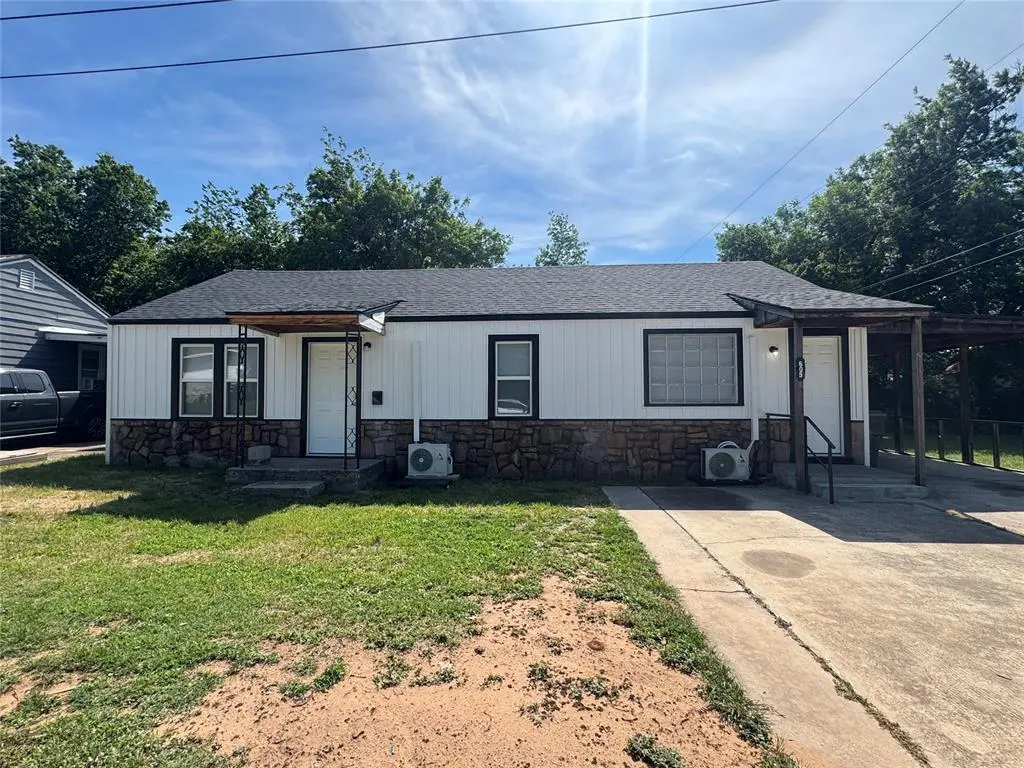
605 S 13th St · Chickasha, OK
Flood risk No data
- FEMA flood zone
- —
- Chance of flooding over 30 yrs
- —
- Est. flood insurance / yr
- —
Fire risk No data
- Est. fire insurance / yr
- —
Heat risk No data
- Hot days now (above threshold)
- —
- Hot days in 30 yrs
- —
Wind risk No data
- Chance of severe wind over 30 yrs
- —
Air-quality risk No data
- Unhealthy air days now
- —
- Unhealthy air days in 30 yrs
- —
Risk factors via First Street. Map © Google.
Why this score? — see what drove the C- grade
The composite is a weighted blend of 9 inputs, each scored 0–100. Each bar is that input's sub-score; the figure is the points it added to the 100-point composite (weight × sub-score).
- Cash flow +24.1/30.0
- DSCR +7.8/10.0
- ARV discount +7.5/15.0
- 1% rule +5.0/10.0
- Livability +3.3/5.0
- Rent growth +2.5/5.0
- Condition / age +2.5/5.0
- Schools +2.1/10.0
- Appreciation +0.0/10.0
$129,900
🖨 Deal sheet (PDF) 📄 Offer letter ✓ Due diligence
Listing remarks
Completely remodeled and move-in ready!! This beautifully refreshed 3-bedroom, 2-bath home offers approximately 1,160 square feet of comfortable living space with thoughtful upgrades throughout. Enjoy all new flooring, fresh paint, a fully updated kitchen and completely remodeled bathrooms designed with today's buyer in mind. Whether you're a first-time buyer, or looking for an investment opportunity, this home is a must see!!
Key facts
- Fresh paint
- New flooring
- Updated kitchen
Tags
Property features AI
Finance
- Other: Property is existing (not new construction); Occupied: No; Days on market: 1
- Financial info: Assumable loans: No; Current price listed at $129,900
- HOA & community: No mandatory association dues
Exterior
- Home design: Single family residence; One level; Residential property; Located in Chickasha Ot addition; Homestead exempt
- Construction: Frame construction; Composition roof (replaced/installed 2025); Combination foundation
- Exterior features: Corner lot
Interior
- Bedrooms: 3 bedrooms
- Bathrooms: 2 full bathrooms
- Interior features: One living area; No fireplace; Covered porch
Neighborhood map
What this means for you Summary
Snapshot
- This is a 3-bed/1.0-bath single-family listed at $130k.
Deal economics
- At list price, monthly cash flow is $256 ($3k/yr) — positive.
- The deal already cash-flows at list — no discount required.
- Meets the 1% rule at list price ($1k rent vs $130k).
- Recommended offer: $126k (3.0% below list) — sets the bar for market timing.
- Cap rate 8.7% vs local median 4.8% in Chickasha — top-decile yield for the area; either an underpriced asset or a hidden risk that comps aren't pricing in. Stress-test before assuming the spread holds.
Location & tenants
- Location reads 66/100 on livability (#117 in OK) — a middle-class / working-renter tenant base. Strengths: cost of living A+, housing A+; Watch: amenities F, commute F, health & safety F.
- Chickasha (town): math 23% / reading 27% proficiency, ranked #115 of 270 in OK (top 43%) — low school quality limits family demand, transient renter base, plan for 1-2y turnover; 64% free/reduced lunch — lower-income household profile, screen leases tightly.
- Zoned schools: Chickasha Hs (math 12% / reading 27%, grade F, #296 of 447 statewide, top 67%, 749 students, 0% FRL) — zoned schools average 0% FRL vs 64% district-wide (64 pts lower); this property's tenant base skews higher-income than the district average.
- Market conditions: 203 active listings in the ZIP; 14 comparable units currently listed for rent nearby; rentals leasing fast (median 2d on market — plan ~1-2 weeks tenant-placement turnaround); 224 units permitted in Grady County in 2024 (0 in 5+ unit buildings).
Forward outlook
- Local home prices are declining (-3.0%/yr); year-one equity from $898 of loan paydown is wiped out by about $4k of value loss. Plan a longer hold.
- Grady County population projected at +20% by 2050 — long-run rental-demand tailwind backs the buy-and-hold thesis.
Negotiation context
- It's been on market 34 days — a 3% lower offer ($126k) is reasonable based on typical stale-listing flexibility.
- 3 sale attempts since 2y ago with the ask held roughly flat each time — persistent listings suggest the price (not the market) is what's stuck; bring a comps-based counter.
- Current owner paid $40k; list at $130k implies a 225% gain — meaningful room to come down on a strong offer.
Risks & watch-outs
- Watch-outs: built in 1940 — expect roof / HVAC / electrical / plumbing capex.
Questions for the listing agent
- It's been on market 34 days. Have you received any prior offers? Is the seller open to a 3% concession, seller financing, or rate buy-down credit?
- Built in 1940 — when were the roof, HVAC, electrical panel, plumbing, and water heater last replaced?
- Is there a deadline driving the sale (1031 exchange, divorce, estate, relocation)? That informs how much negotiation room exists.
- Schools are D-rated, which usually means shorter tenancies and higher turnover. Who's the typical renter profile here, and what's been the actual vacancy rate?
- What's the average days-on-market for RENTAL listings here right now (not sales)? A rising rental-DOM trend means longer vacancies and softer asking-rent achievability than the comps imply.
- What's the recent tenant-quality profile in this submarket — average credit score on applications, eviction rate, late-payment / NSF rate, and stable-employment percentage? A property-management company in the area should have these aggregated.
- How much new for-sale + rental construction is in the pipeline within 1–3 miles? Heavy new supply typically softens prices + rents 12–24 months out; constrained supply supports both.
Investment metrics
- 1% rule
- 1.00% ✓
- Cap rate
- 8.66%
- Cash-on-cash
- 8.45%
- DSCR
- 1.38
- GRM
- 8.3
CMA / ARV
- ARV (on-the-fly)
- $80,040
- Comps found
- 12
Show comp detail 12 sales within ~0.75 mi
| Address | Dist | Beds/Ba | Sqft | Sold | Price | $/sf | Match |
|---|---|---|---|---|---|---|---|
| 1619 W Iowa Ave | 0.33mi | 2/1.0 (-1) | 1,156 (-0%) | 0mo | $60,000 | $52 | 79 |
| 502 S 9 St | 0.29mi | 3/1.0 | 1,224 (+6%) | 1mo | $85,000 | $69 | 76 |
| 926 S 9th St | 0.36mi | 3/1.5 | 1,122 (-3%) | 4mo | $115,000 | $102 | 73 |
| 1127 S 10th St | 0.43mi | 2/1.5 (-1) | 1,162 (+0%) | 2mo | $105,000 | $90 | 71 |
| 726 S 15th St | 0.20mi | 2/1.0 (-1) | 1,064 (-8%) | 1mo | $31,000 | $29 | 71 |
| 1005 W Washington Ave | 0.33mi | 3/1.0 | 1,244 (+7%) | 3mo | $50,000 | $40 | 70 |
| 1020 S 14th St | 0.31mi | 2/1.0 (-1) | 1,063 (-8%) | 0mo | $96,000 | $90 | 66 |
| 319 S 9th St | 0.38mi | 2/1.0 (-1) | 1,060 (-9%) | 2mo | $65,000 | $61 | 62 |
| 1813 W Dakota Ave | 0.41mi | 3/2.0 | 1,292 (+11%) | 0mo | $174,000 | $135 | 57 |
| 214 N 17th St | 0.63mi | 2/1.0 (-1) | 1,212 (+4%) | 2mo | $55,000 | $45 | 56 |
| 1008 S 6th St | 0.58mi | 3/1.5 | 1,330 (+15%) | 1mo | $135,000 | $102 | 46 |
| 420 W Minnesota Ave | 0.66mi | 2/2.0 (-1) | 1,248 (+8%) | 3mo | $44,500 | $36 | 45 |
Match score weights: distance 35% · size 25% · config 20% · recency 20%. Top-matched comps best support the ARV.
Projected returns pro-forma
-3.0% appreciation · 3.0% rent growth · sell at horizon
- IRR
- -3.5%
- Equity multiple
- 0.87×
- Total profit
- $-4,786
- Equity at exit
- $19,369
- IRR
- 6.1%
- Equity multiple
- 1.46×
- Total profit
- $16,618
- Equity at exit
- $11,231
Cash invested: $36,372 (down + closing). Projections, not guarantees.
Landlord ↔ Tenant lean methodology
- Overall (STATE)
- 83 Strongly Landlord-Friendly
- State Oklahoma
- 83 Strongly Landlord-Friendly · R+20
- County
- — inherits STATE
- City
- — inherits STATE
ZIP-level market 73018
- Home prices YoY
- -21.1%
- Active inventory
- 203
- Price-to-rent
- 8.3×
Monthly cashflow live
- Estimated rent
- $1,304 high interval (Pro) →
- Mortgage (P&I)
- −$681
- Tax from tax record
- −$39 /mo · $466/yr
- Insurance
- −$54
- HOA
- −$0
- Vacancy / Maint / Mgmt
- −$274
- Net cashflow
- $256
Break-even live
Sensitivity live
| Price | -10% $330 | -5% $293 | +0% $256 | +5% $219 | +10% $183 |
|---|---|---|---|---|---|
| Rent | -10% $153 | -5% $205 | +0% $256 | +5% $308 | +10% $359 |
| Rate | -1.0pp $322 | -0.5pp $289 | base $256 | +0.5pp $223 | +1.0pp $188 |
UW: 25.0% down · 7.5% · 30yr · 1.5% tax · 5.0% vac · 8.0% maint · 8.0% mgmt
Financing live
Cash to close
- Down payment
- $32,475
- Closing costs
- $3,897
- Reserves months
- —
- Total cash needed
- —
Loan-product check · same deal, 3 products live
Conventional
25% down · 7.5% · 30yr
- Down + closing
- —
- Monthly P&I
- —
- Monthly cashflow
- —
- DSCR
- —
- Eligible?
- —
Personal DTI + credit; lowest rate.
DSCR
20% down · 8.5% · 30yr
- Down + closing
- —
- Monthly P&I
- —
- Monthly cashflow
- —
- DSCR
- —
- Eligible?
- —
No personal income docs; deal must DSCR.
Hard money
10% down · 12.0% · 12mo
- Down + closing
- —
- Monthly P&I
- —
- Monthly cashflow
- —
- DSCR
- —
- Eligible?
- —
Short-term bridge; refi at stabilization.
Rent comps 14 comps
| Address | Beds | Baths | Sqft | Rent | $/sqft | DOM | Units | Dist |
|---|---|---|---|---|---|---|---|---|
| 1223 W Colorado Ave Chickasha, OK | 2.0 | 2.0 | 864 | $1,275 | $1.48 | 2d | 1 | 0.24mi |
| 1008 S 14th St Chickasha, OK | 3.0 | 2.0 | 1485 | $1,395 | $0.94 | 2d | 1 | 0.32mi |
| 1024 S 13th St Chickasha, OK | 2.0 | 2.0 | 1265 | $925 | $0.73 | 11d | 1 | 0.32mi |
| 519 W Minnesota Ave Chickasha, OK | 2.0 | 2.0 | 1100 | $1,250 | $1.14 | 2d | 1 | 0.59mi |
| 509 W Oregon Ave Chickasha, OK | 2.0 | 2.0 | 900 | $1,200 | $1.33 | 2d | 1 | 0.60mi |
| 810 W Illinois Ave Chickasha, OK | 2.0 | 2.0 | 1100 | $1,250 | $1.14 | 24d | 1 | 0.77mi |
| 810 W Illinois Ave Chickasha, OK | 2.0 | 2.0 | 1100 | $1,250 | $1.14 | 3d | 1 | 0.77mi |
| 816 S 2nd St Chickasha, OK | 3.0 | 2.0 | 1047 | $1,100 | $1.05 | 2d | 1 | 0.85mi |
| 607 W Wisconsin Ave Chickasha, OK | 3.0 | 2.0 | 1270 | $1,395 | $1.10 | 11d | 1 | 1.08mi |
| 1315 S Sheppard St Chickasha, OK | 2.0 | 2.0 | 864 | $1,250 | $1.45 | 3d | 1 | 1.15mi |
| 2220 W Utah Ave Unit 2220 Chickasha, OK | 2.0 | 1.0 | 910 | $1,055 | $1.16 | 2d | 1 | 1.24mi |
| 2226 W Utah Ave Chickasha, OK | 2.0 | 1.0 | 1000 | $1,055 | $1.05 | 15d | 1 | 1.26mi |
| 3507 W Mississippi Ave Chickasha, OK | 4.0 | 2.0 | 1240 | $1,474 | $1.19 | 2d | 1 | 1.43mi |
| 641 Marlin Ct Chickasha, OK | 2.0–3.0 | 2.0 | 1300 | $1,595 | $1.23 | 2d | 3 | 1.43mi |
Listing history 20 events
-
2026-06-18days on market $129,900 Active 34 DOM
-
2026-06-17days on market $129,900 Active 33 DOM
-
2026-06-16days on market $129,900 Active 32 DOM
-
2026-06-15days on market $129,900 Active 31 DOM
-
2026-06-13days on market $129,900 Active 29 DOM
-
2026-06-09days on market $129,900 Active 25 DOM
-
2026-06-08days on market $129,900 Active 24 DOM
-
2026-06-07days on market $129,900 Active 23 DOM
-
2026-06-05days on market $129,900 Active 20 DOM
-
2026-06-03days on market $129,900 Active 19 DOM
-
2026-06-02days on market $129,900 Active 18 DOM
-
2026-06-01days on market $129,900 Active 17 DOM
-
2026-05-31days on market $129,900 Active 16 DOM
-
2026-05-14$129,900 Active
-
2024-09-13historical
-
2024-07-26status Active
-
2024-07-05status Pending
-
2024-04-09price $54,500
-
2024-03-12$59,500 Active
-
2012-10-26soldstatus $40,000
ⓘ Source: listings_history table (triggers on properties + properties_extension) + one-shot
backfill from property_details.listing_events for pre-trigger history.
Tax reassessment forecast OK · Resets to sale price
- Current annual tax
- $466 · $39/mo
- Projected year-2 tax
- $1,169 · $97/mo
- Expected delta
- +$703/yr (+$59/mo · 150.9%)
ⓘ Screening estimate from a state-policy table — verify with the county assessor before closing.
Nearby sold comps map
Loading sold comps map…
Walkable amenities ~0.75 mi
Loading nearby amenities…
Taxation est. · year 1
- Rental income
- $15,652
- − Mortgage interest
- −$7,276
- − Property taxes
- −$466
- − Insurance
- −$650
- − Repairs & maintenance
- −$1,252
- − Management
- −$1,252
- − Depreciation
- −$3,779
- Taxable income
- $977
- Est. tax owed @ 24.0%
- −$234
- After-tax cash flow
- $2,840/yr
For passive investors: Depreciation is non-cash, so a rental often shows a tax loss while cash-flowing — sheltering income. Rental losses are passive: they offset passive income freely, and up to $25,000/yr can offset ordinary (W-2) income if you actively participate and your MAGI is under $100k (phasing out to $0 by $150k); unused losses carry forward. On sale, claimed depreciation is recaptured at up to 25%, and gains may owe capital-gains tax (a 1031 exchange can defer both). Figures are a year-1 estimate at your 24.0% rate — not tax advice; consult a CPA.
Schools (NCES district)
- District
- Chickasha
- NCES district ID
- 4007560
- Math proficiency
- 23% ▼ -11.00%
- Reading proficiency
- 27% ▼ -8.00%
- Median HH income
- $38,561
- Composite
- 20.95/100
- National rank
- #8476
- State rank
- #115 of 270 in OK
Livability — Chickasha
- Score
- 66/100
- State rank
- #117
- US rank
- #11902
Category grades
Schools grade is shown separately in the Schools card above.
Census & demographics
- Census place
- Chickasha, OK
- County
- Grady County · 20,505 people
- City population
- 20,505
- Metro
- Oklahoma City, OK
- Population (ZIP)
- 20,505
- Household income
- $56,484
- Rent vs Own
- Severe rent burden
- 685.0
Population outlook (Grady County) Hauer SSP2
- Today (2025)
- 59,962 people
- By 2030
- 62,513 · +4.3%
- By 2040
- 67,338 · +12.3%
- By 2050
- 71,719 · +19.6%
- By 2075
- 82,684 · +37.9%
- By 2100
- 89,387 · +49.1%
Race, ethnicity, and origin ACS 2023
- Neighborhood character
- Predominantly White (74%)
- Race & ethnicity
- White 74% Two or more races 11% Hispanic / Latino 9% Black 5% Native American 5%
- Hispanic origin (detail)
- Mexican 6%
- Common ancestry
- Slovak 2% Iranian 2% Italian 2%
- Foreign-born
- 2% · Canada
- Languages at home
- 96% English-only · Spanish 3%
Political lean MEDSL · Grady
- 2024 margin
- Solid R (+62.7) · D 17.9% · R 80.6% · Other 1.5%
- 2008→2024 swing
- -16.0pp toward R · 2008: -46.7pp · 2024: -62.7pp
- All cycles
- 2024: R+62.7 2020: R+62.3 2016: R+60.3 2012: R+51.2 2008: R+46.7
Not yet ingested
- Civics
- —
Market trends
- HPI YoY
- ▼ -66.82%
- Current HPI
- 249.6051
- Rent YoY
- —
- Metro
- Oklahoma City, OK
- State GDP YoY
- ▲ 1.55%
- F500 in state
- 6
Industry mix (Fortune 500 HQ in OK)
| Industry | F500 HQs | Revenue |
|---|---|---|
| Energy | 3 | $48B |
|
||
Price history
+224.8% since first listed7 events — show timeline
- 2026-05-14 Listed $129,900 MLSOK
- 2024-09-13 Listing Removed — MLSOK
- 2024-07-26 Relisted — MLSOK
- 2024-07-05 Pending — MLSOK
- 2024-04-09 Price Changed $54,500 MLSOK
- 2024-03-12 Listed $59,500 MLSOK
- 2012-10-26 Sold (Public Records) $40,000 Public Records
Property tax history
+4.7%/yrLatest (2025): $466 · +5.7% YoY. Source: county tax records.
Cash-flow waterfall
monthlySold comps — $/sqft
last 12 mo · ≤1 miLoading sold comps…